


Are you waiting for the right opportunity to trade the crypto market once it stops moving sideways? Once the bull run resumes or there is a short-term relief rally, having the Supertrend Indicator on hand to help you trade is always wise.
Trend-following indicators are crucial for day traders who want to ride even the smallest of waves. In the world of technical analysis, the Supertrend Indicator is arguably the simplest to use, especially for trading crypto. Here’s everything you need to know about using the Supertrend Indicator to your advantage, particularly when day trading.
Top Crypto Trading Exchanges
Best for interest rates

Best for spot trading

Best for altcoins trading

- What is the Supertrend Indicator?
- How the Supertrend Indicator works
- How relevant is the Supertrend Indicator to crypto trading?
- Supertrend Indicator and the best crypto settings
- Best crypto day trading strategies using the Supertrend Indicator
- How do you use SuperTrend as a stop loss?
- Is the Supertrend indicator suitable for different crypto trading styles?
- Is the Supertrend indicator profitable?
- Frequently asked questions
What is the Supertrend Indicator?
The Supertrend Indicator is a popular trend-following technical analysis tool. By using it, you can determine the possible direction of a crypto asset. Note that while the Supertrend Indicator works for multiple crypto trading timeframes it is best suited for day trading.
The indicator is represented by a single line that changes color. And it is plotted directly on the price chart.
Did you know? Olivier Seban — a French Trader — is the brain behind the Supertrend indicator.
Elements of a Supertrend Indicator
Unlike other basic trend-following indicators like the Simple Moving Average (SMA) that rely on price smoothing, the Supertrend Indicator brings additional elements into the mix. It tracks the volatility aspect of asset movement and is a better bet than the likes of Simple Moving Average (SMA), which offers lagging results.
The volatility aspect is determined by the Average True Range (ATR). This element of the Supertrend Indicator represents the movement corresponding to an asset’s price in a given time frame. Higher ATR represents high volatility and vice versa.
Besides the Average True Range (ATR), the Supertrend Indicator has what we call a multiplier. It is a number that you multiply with the ATR to make it more or less sensitive to minor price changes. The multiplier is what makes the Supertrend Indicator suitable for different types of crypto trading — day trading, scalp trading, swing trading, etc. You can also consider it an adjustment metric.
A high multiplier makes sense for long-term crypto trading, whereas a low multiplier value makes the Supertrend Indicator suitable for day trading. As two elements are involved, the Supertrend Indicator is better at providing more accurate trading signals compared with other indicators.
In some cases, the ATR is used interchangeably with the period. The period is the time frame across which the ATR is calculated. Both the period and multiplier form the backbone of the Supertrend strategy.
Red line, green line
Looking at the Supertrend Indicator gives you two colors — red and green. The indicator turning green indicates bullishness at the crypto’s counter, and the same turning red hints at bearishness. The red and green lines can also serve as stop loss levels for short and long trades, respectively.
As for the charting setup, the red line is considered the upper line, whereas the green line works as the lower line in regard to the price action.
The below tweet that tracks the efficacy of the Supertrend Indicator for bitcoin trading:
How the Supertrend Indicator works
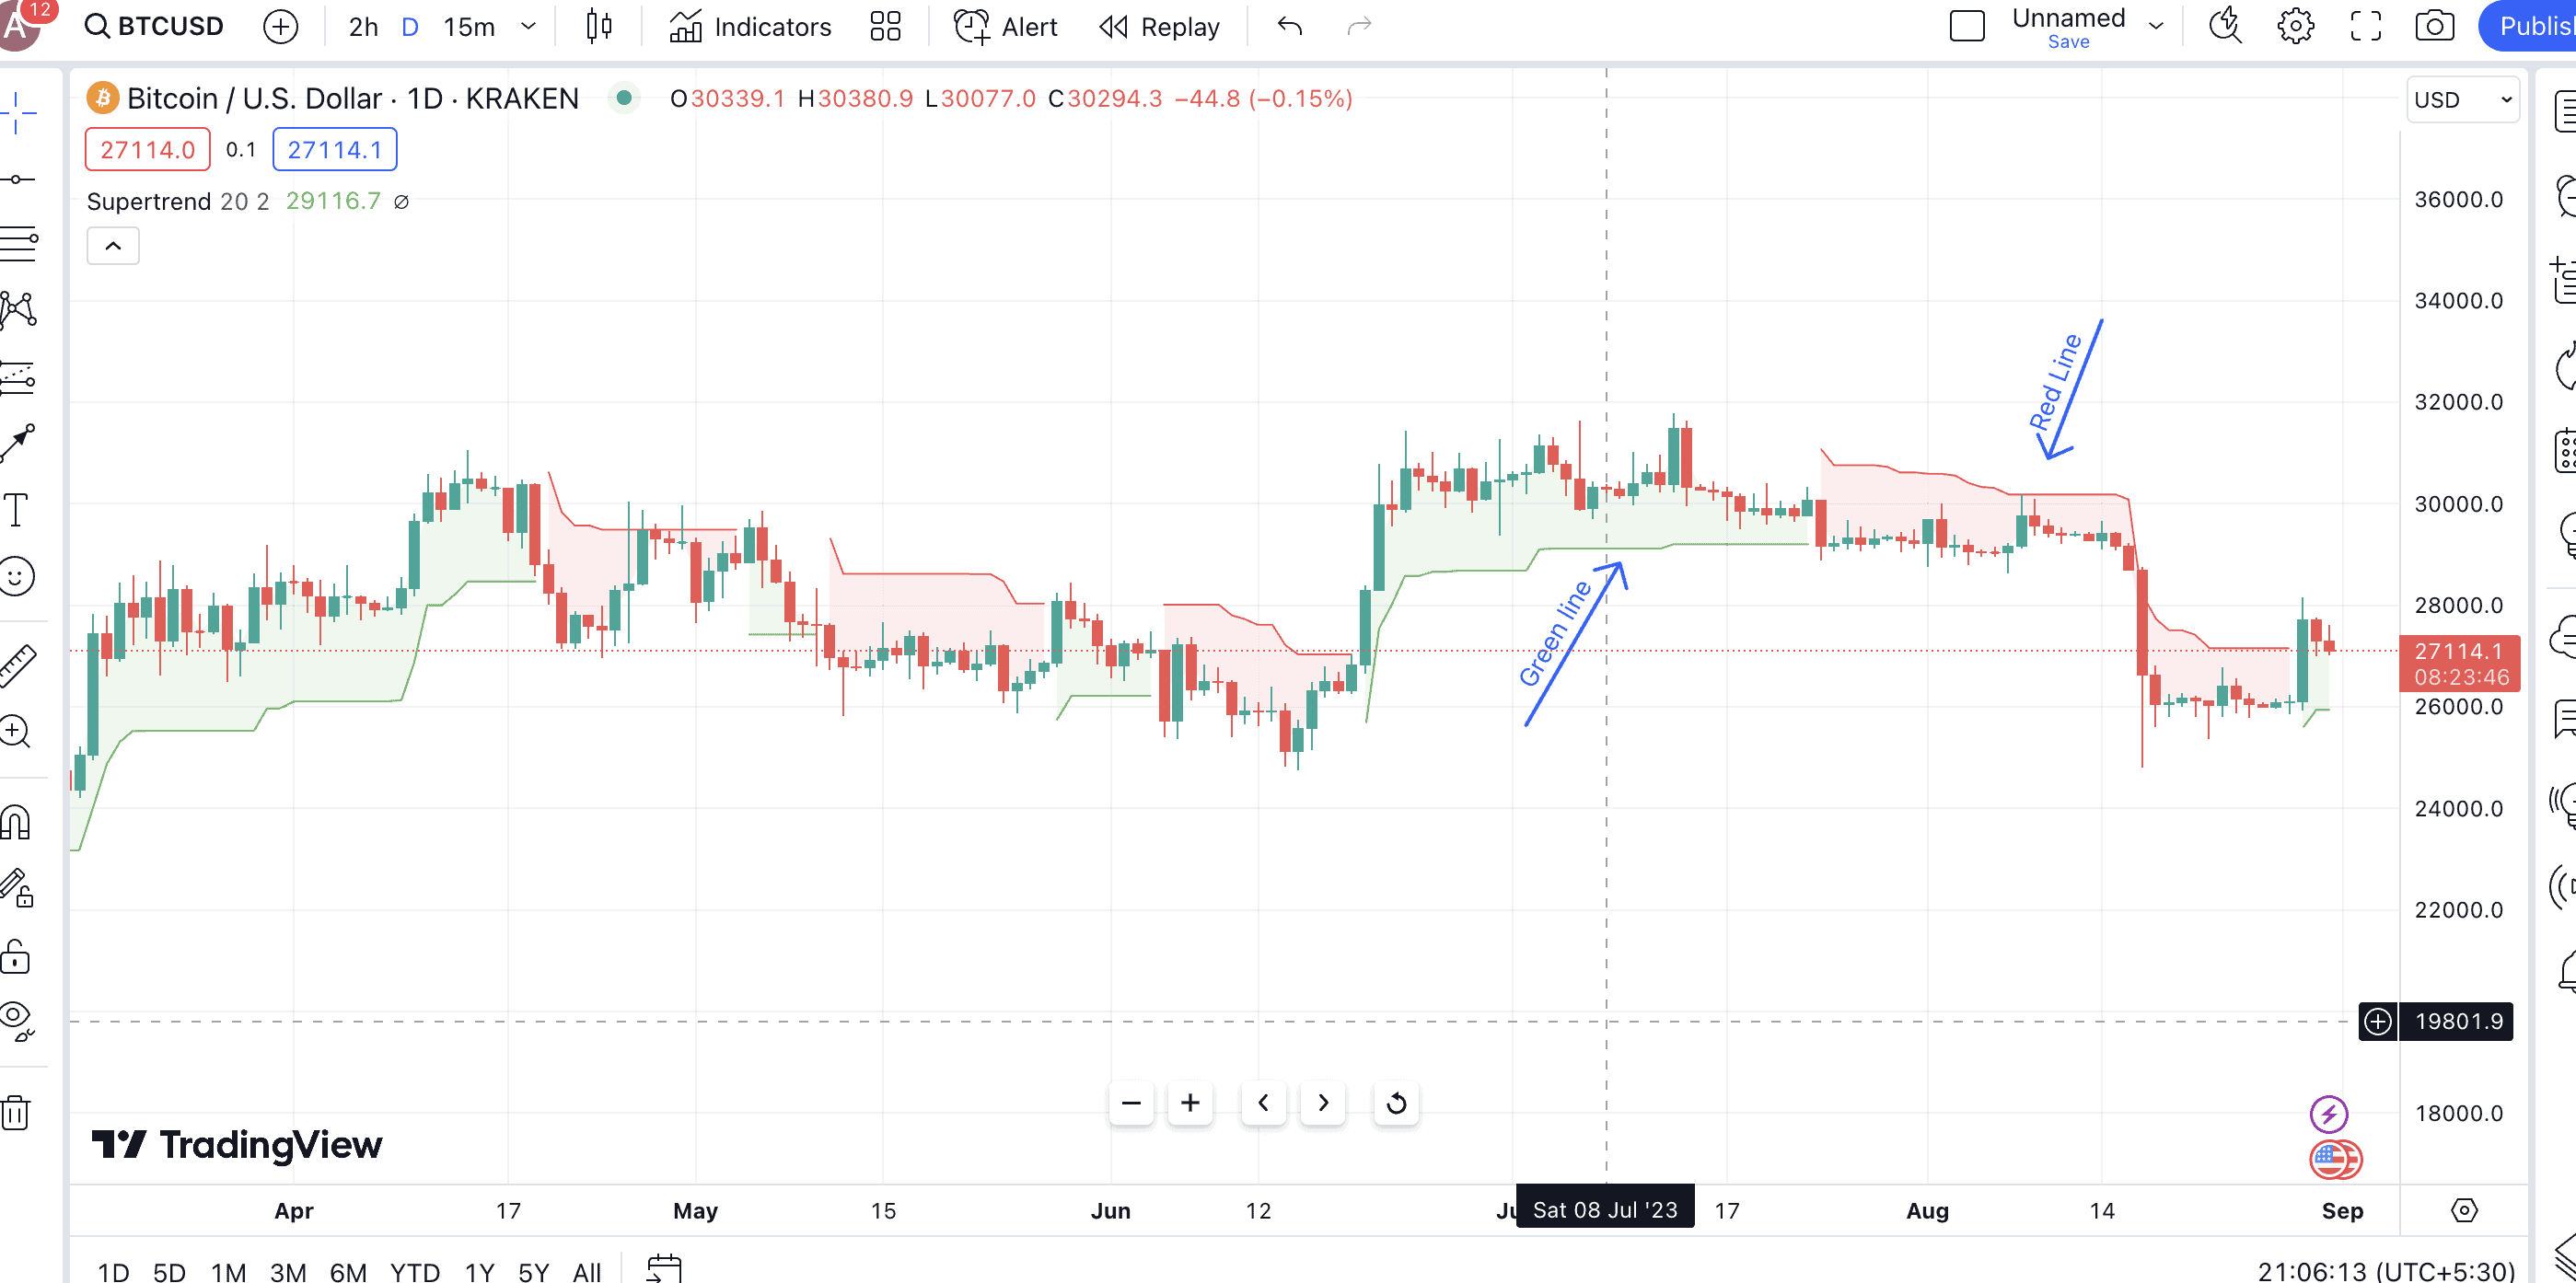
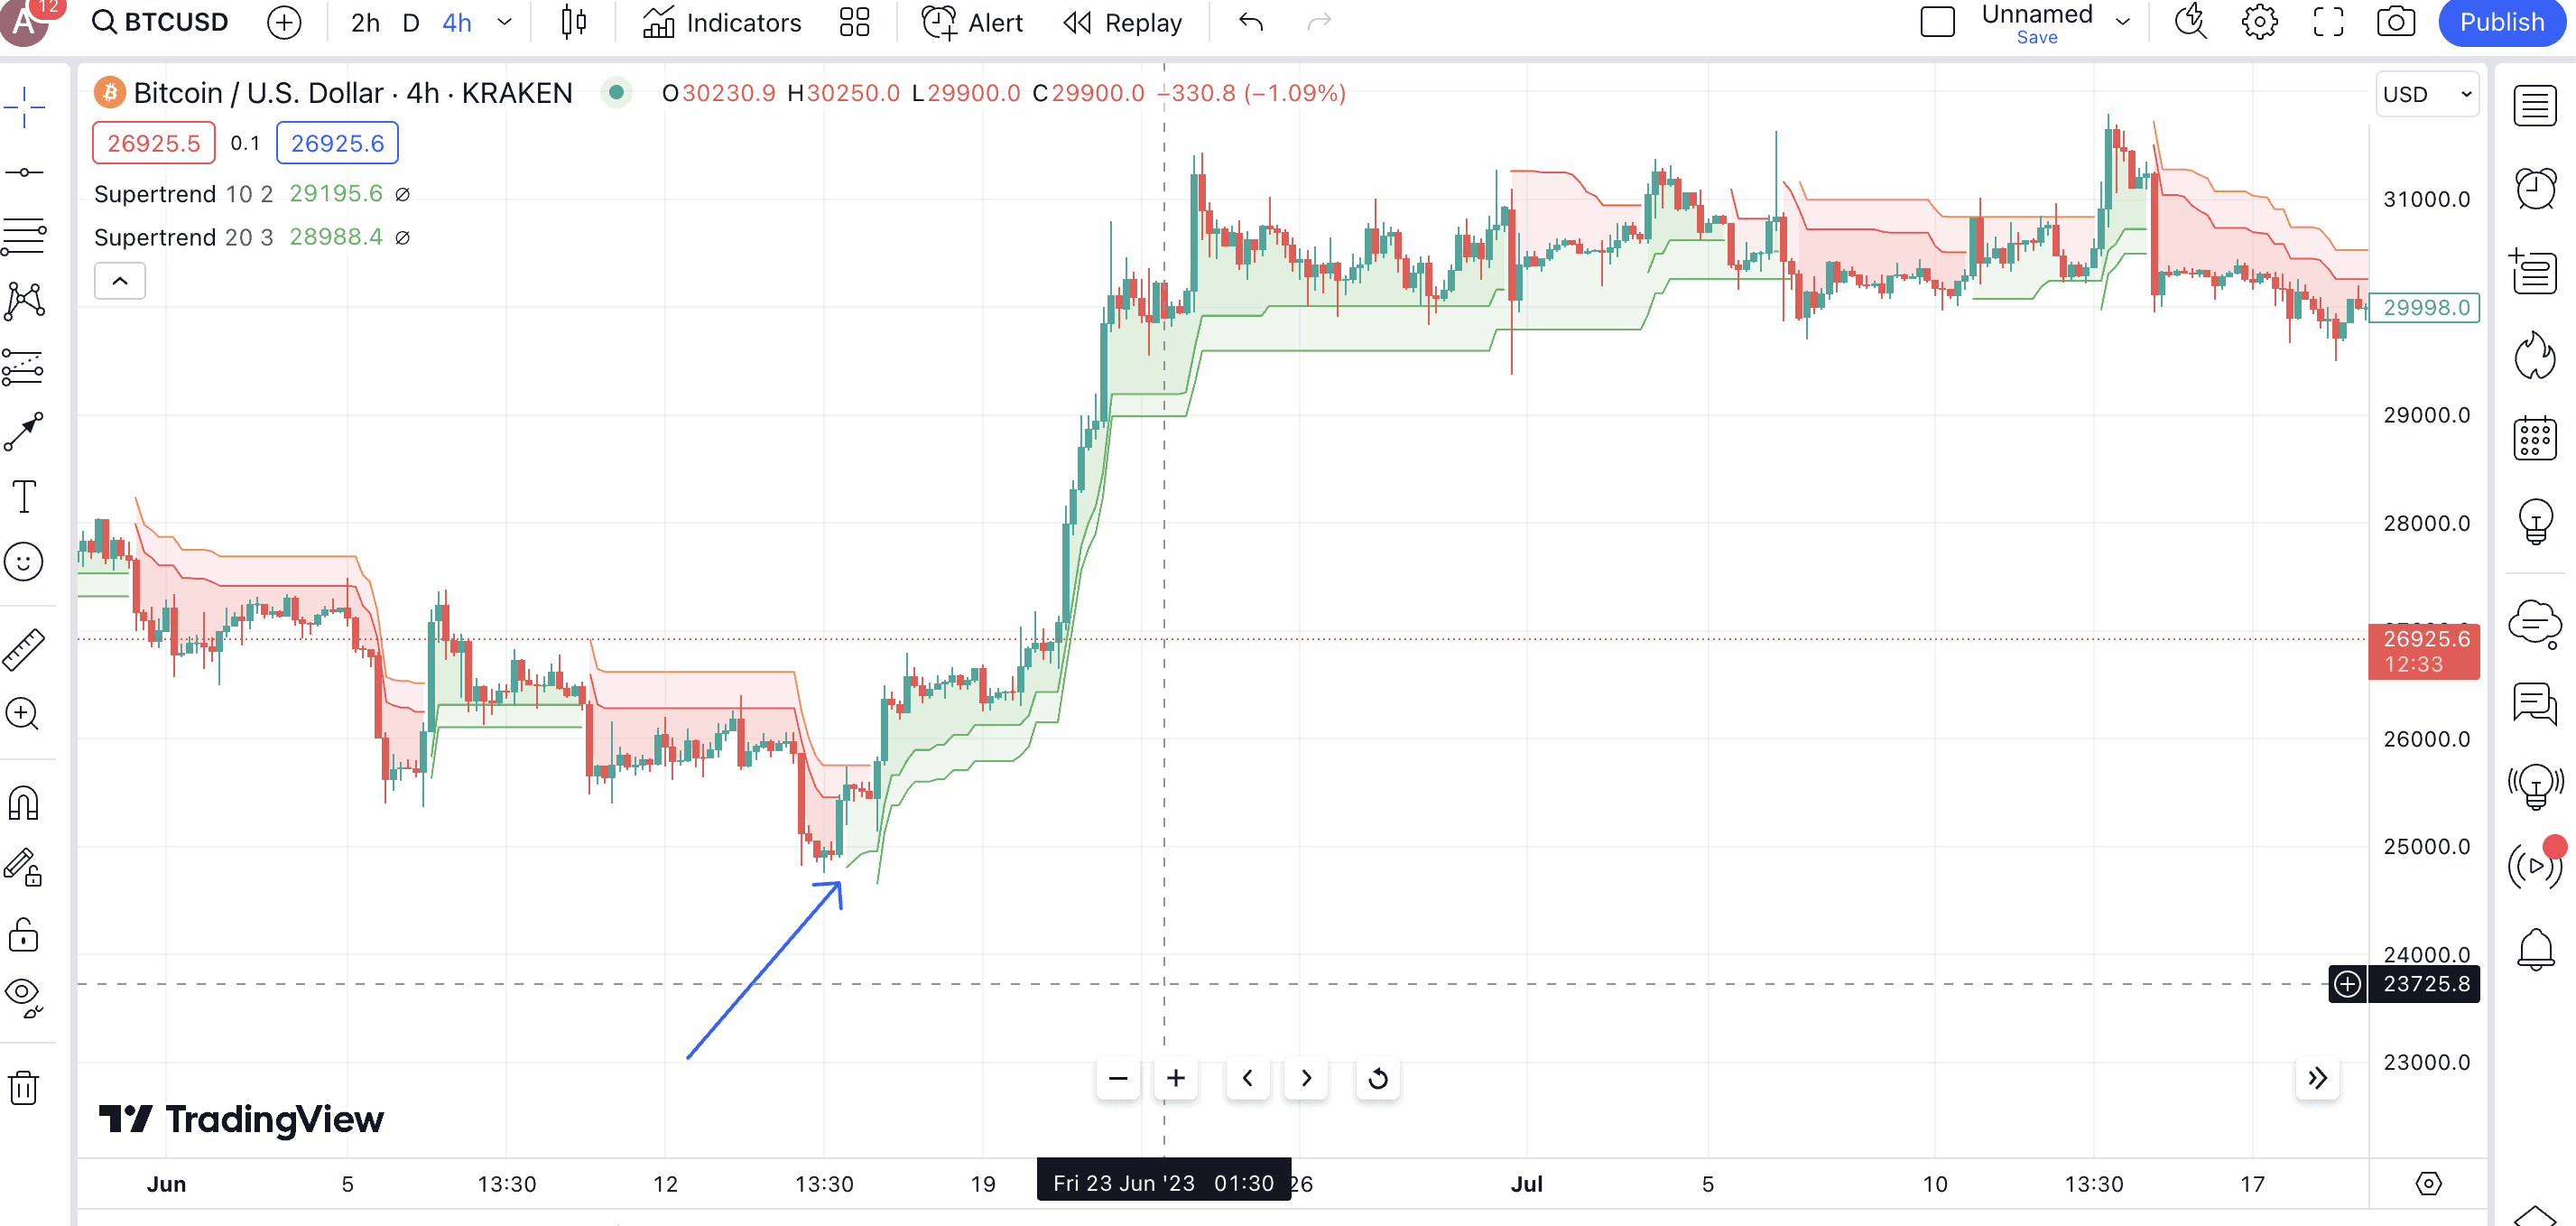
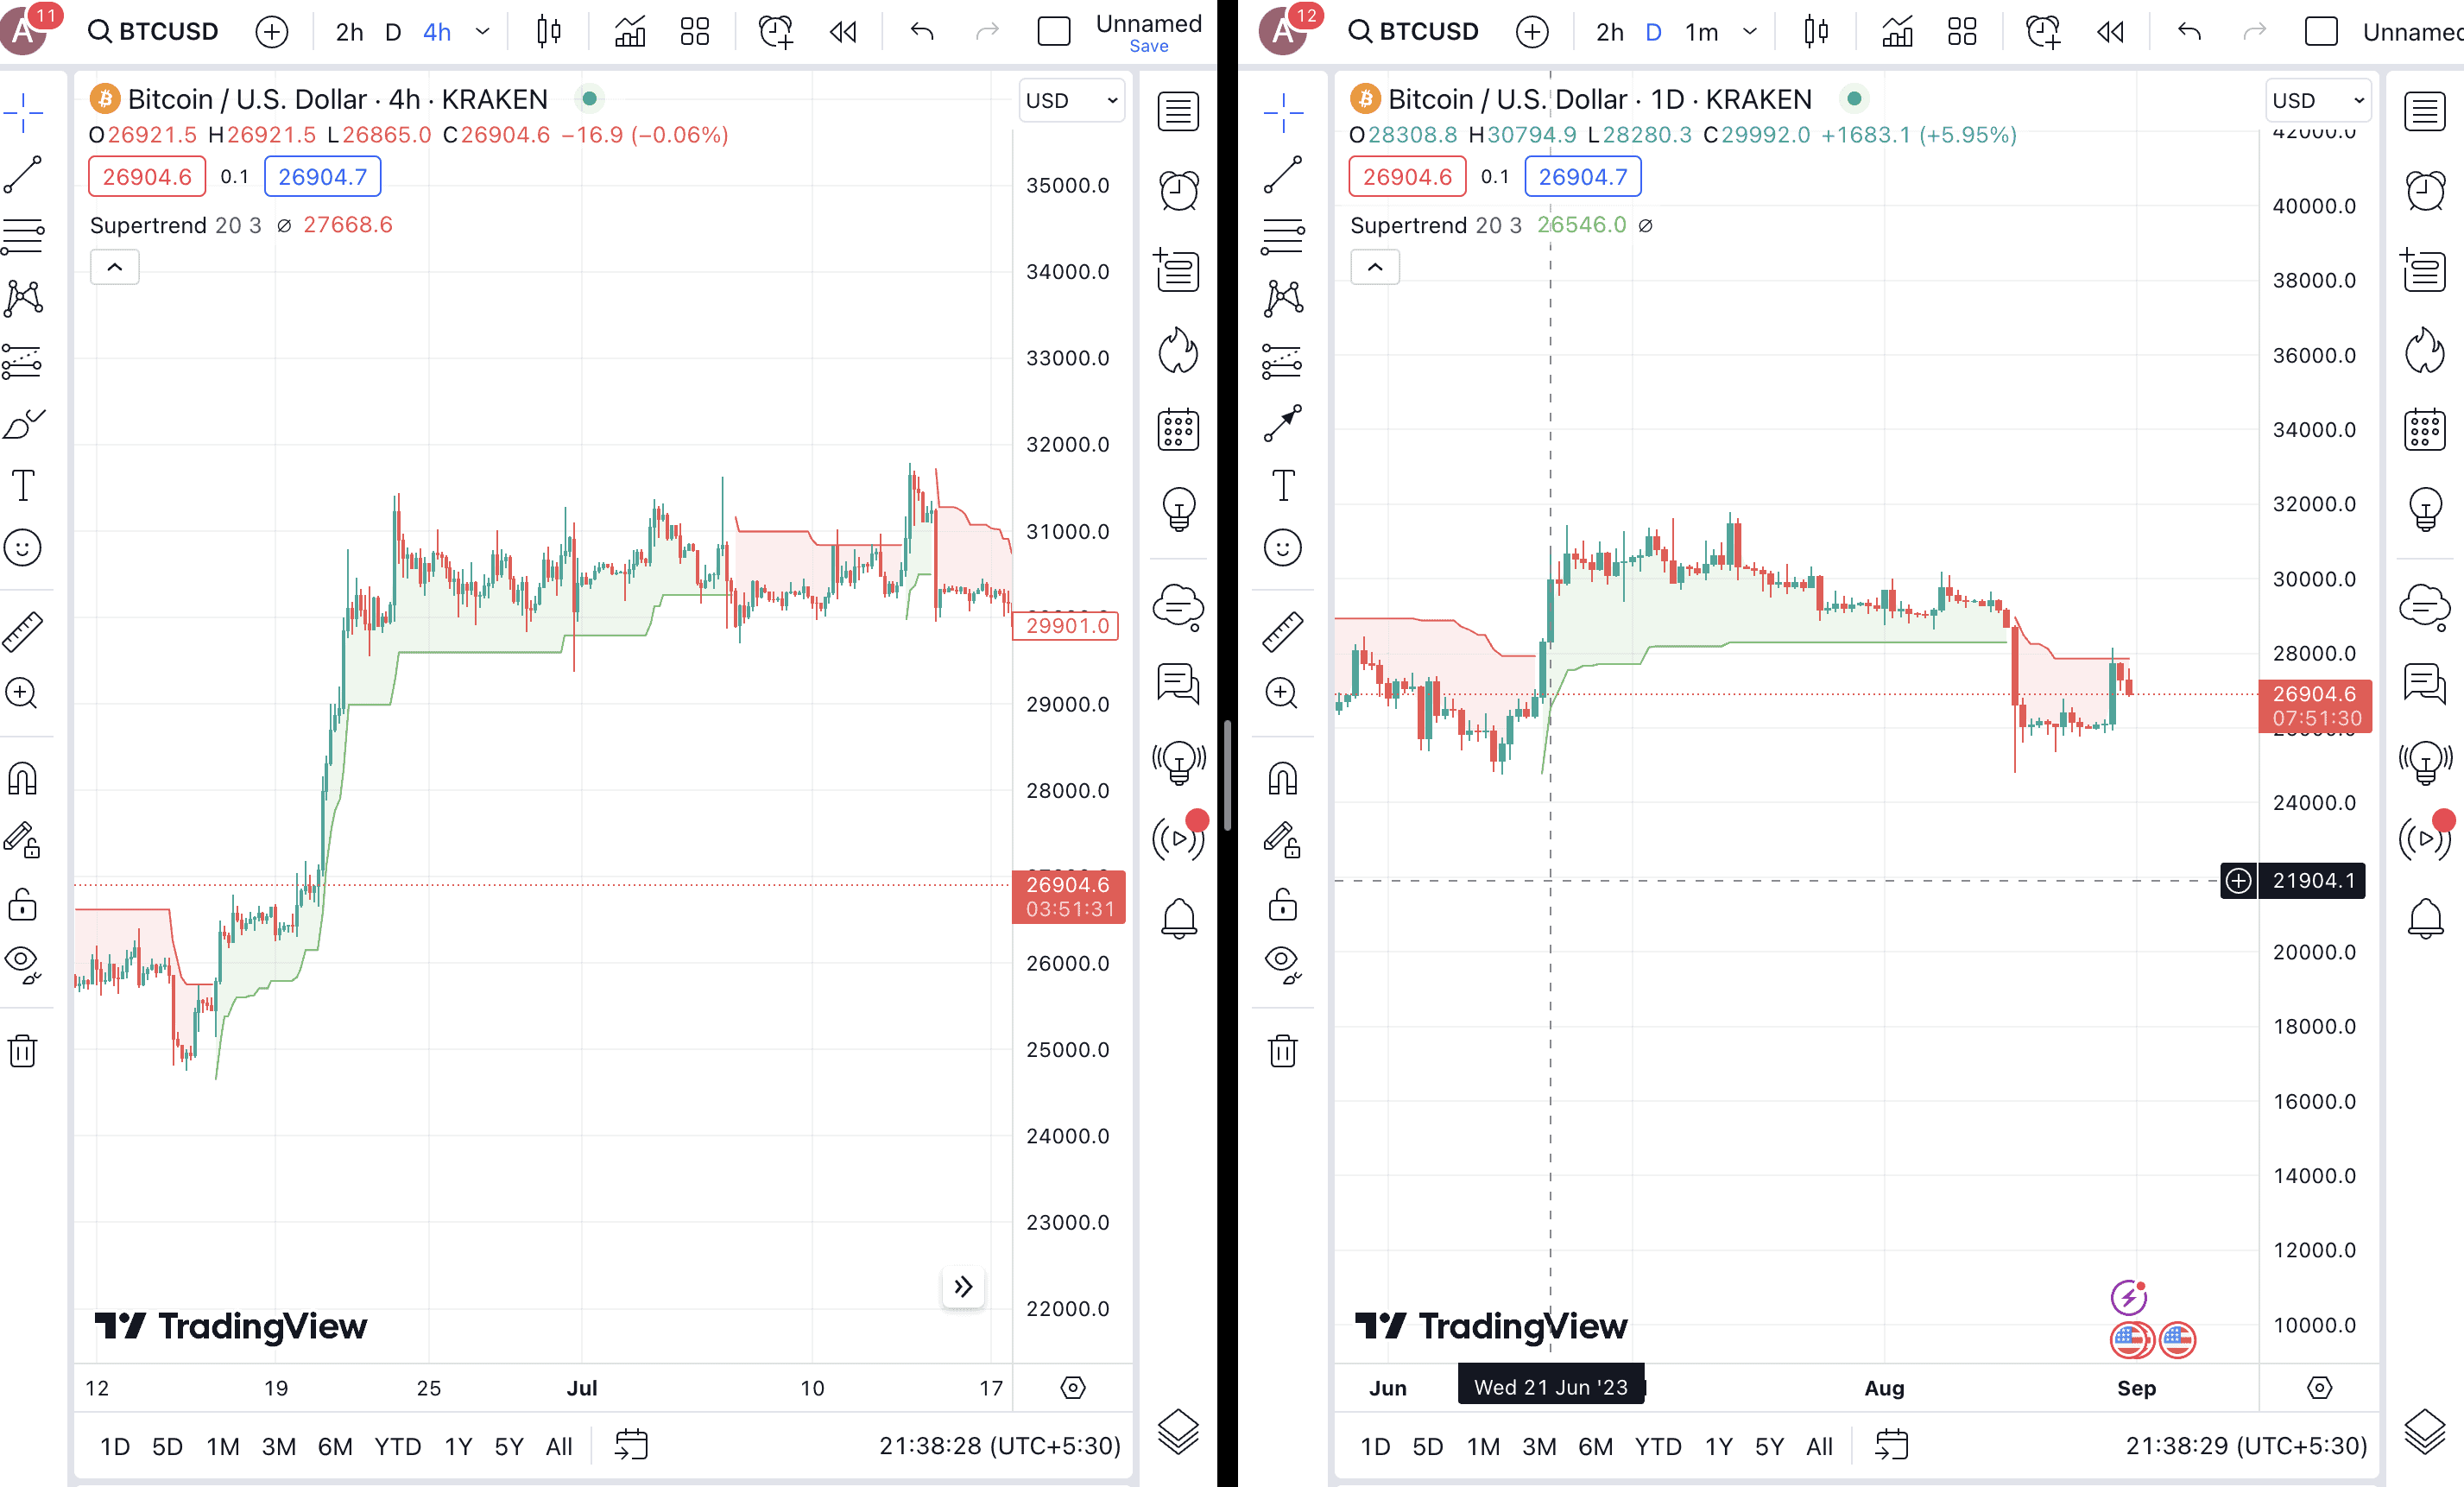
The working of the Supertrend Indicator is a lot like the Parabolic SAR. Instead of the dots, here we have red and green lines — colored representations of one extended line. When the price chart breaks the red line and rises, we can consider it a trend shift followed by the appearance of a green line or a bullish phase.
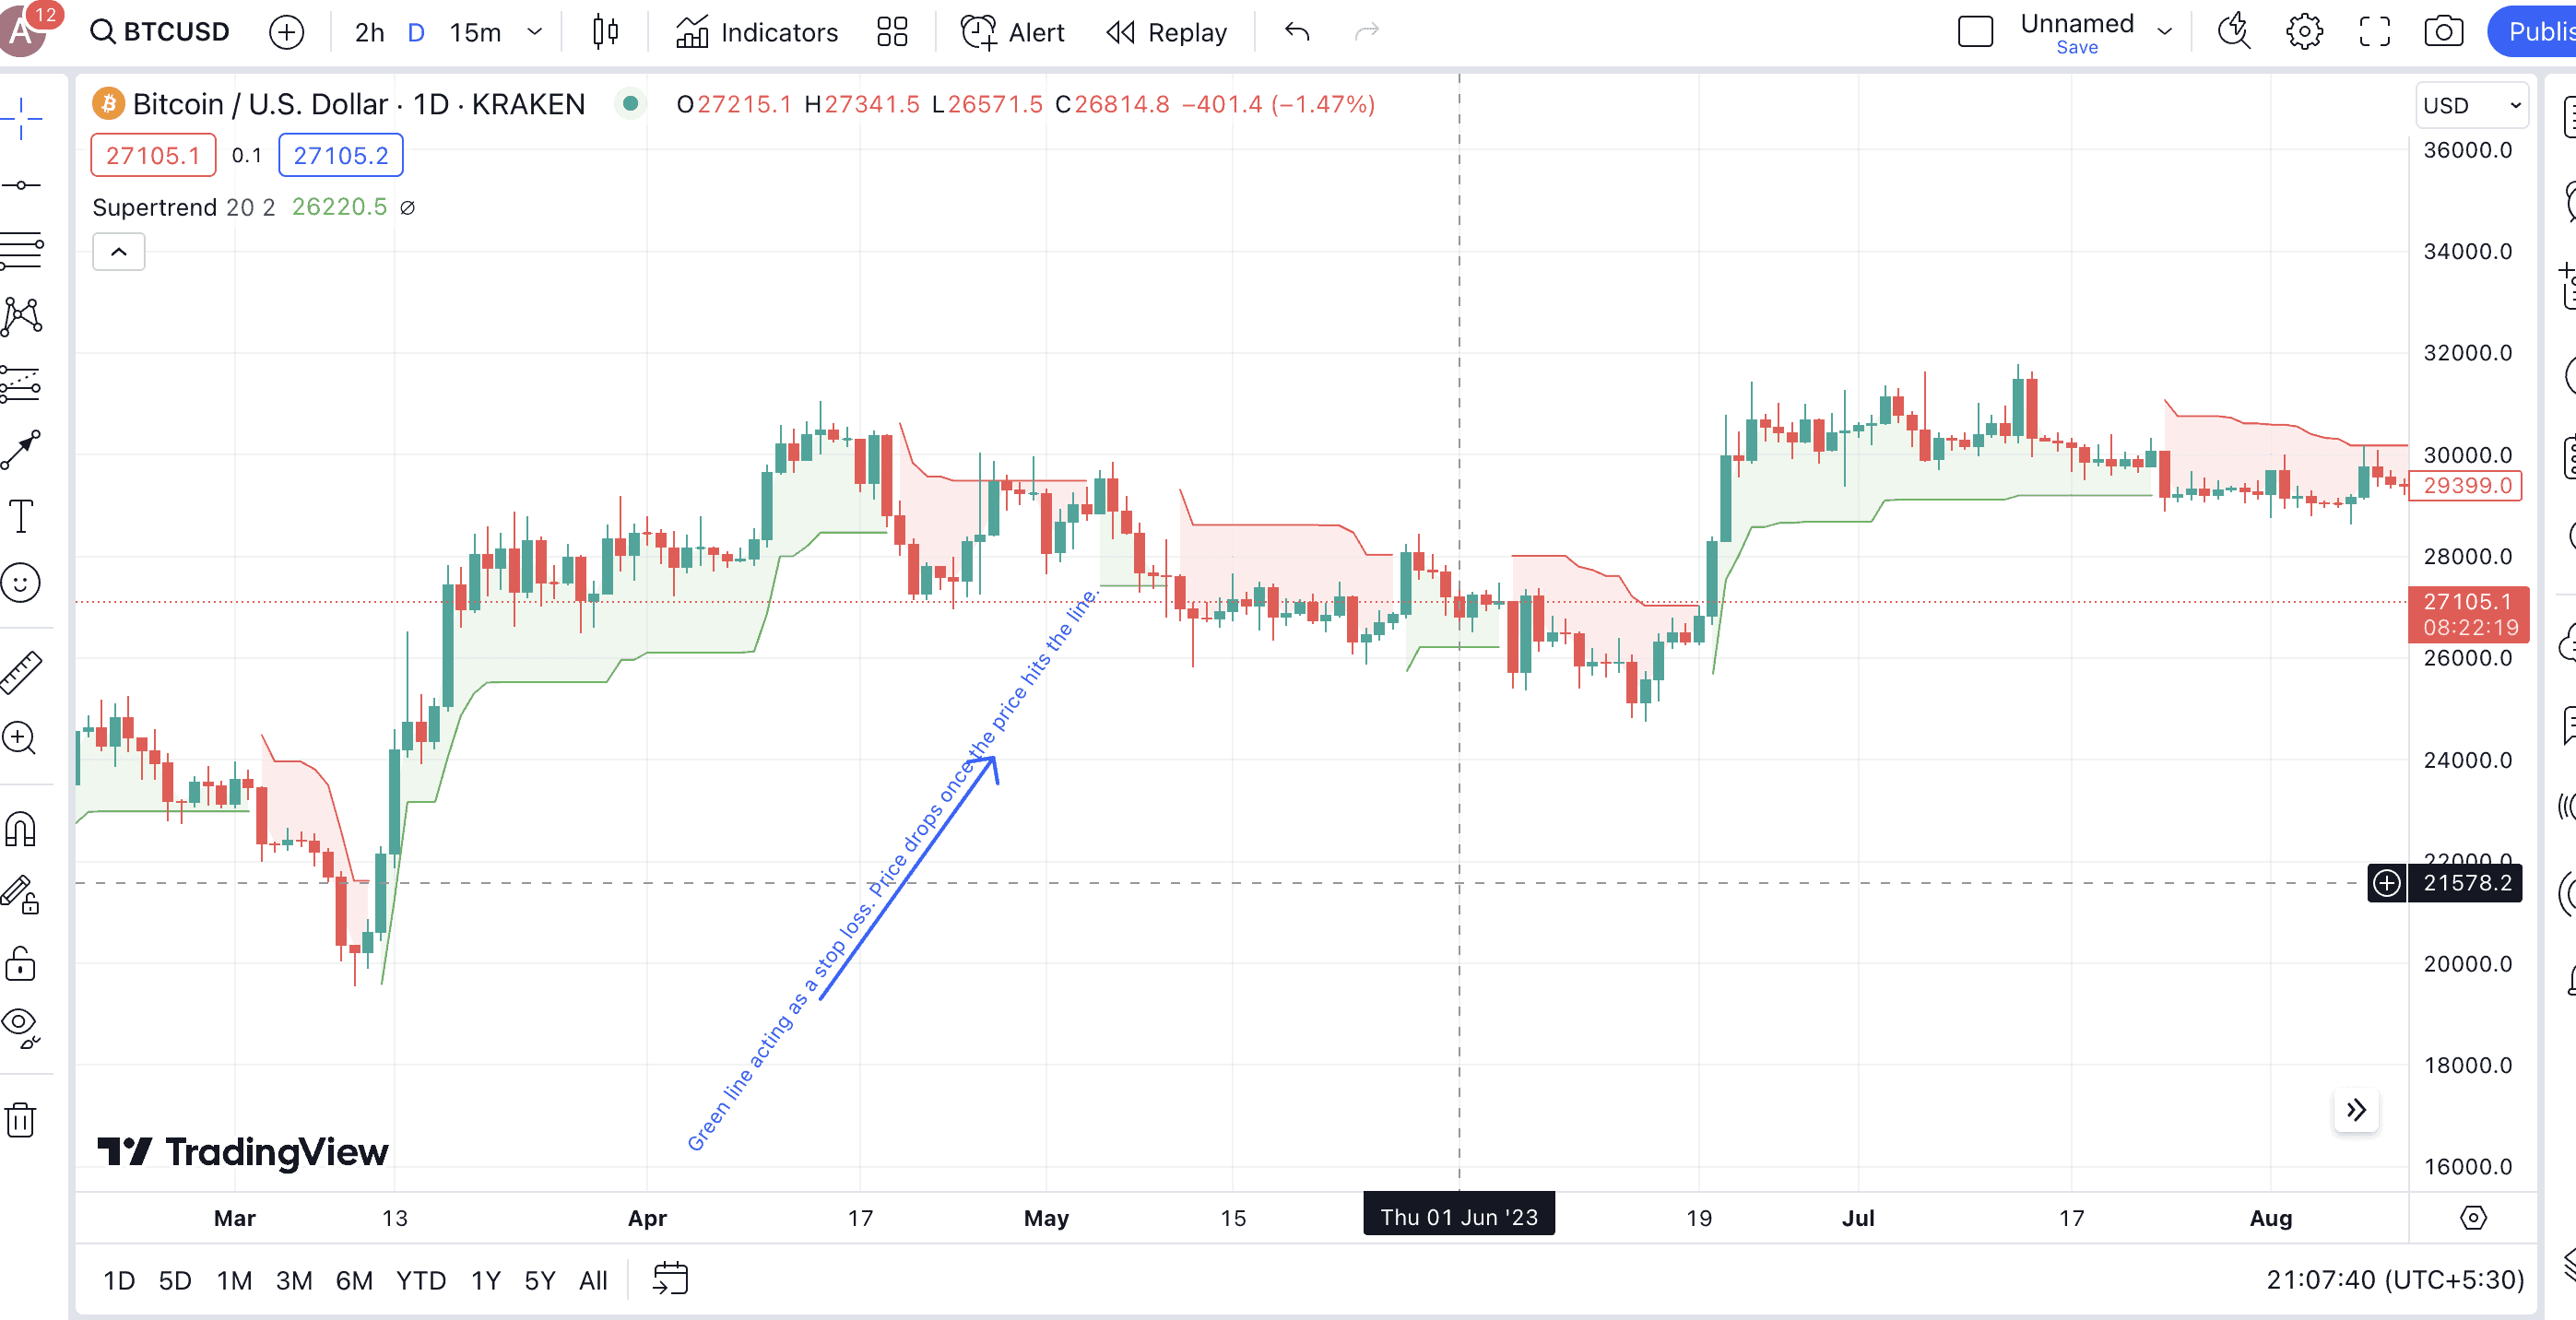
Once this happens, the green line acts as a dynamic support, breaching, which can be a sign to exit or even enter a short position. However, if the price rebounds on touching the green line, we can expect the trend to continue.
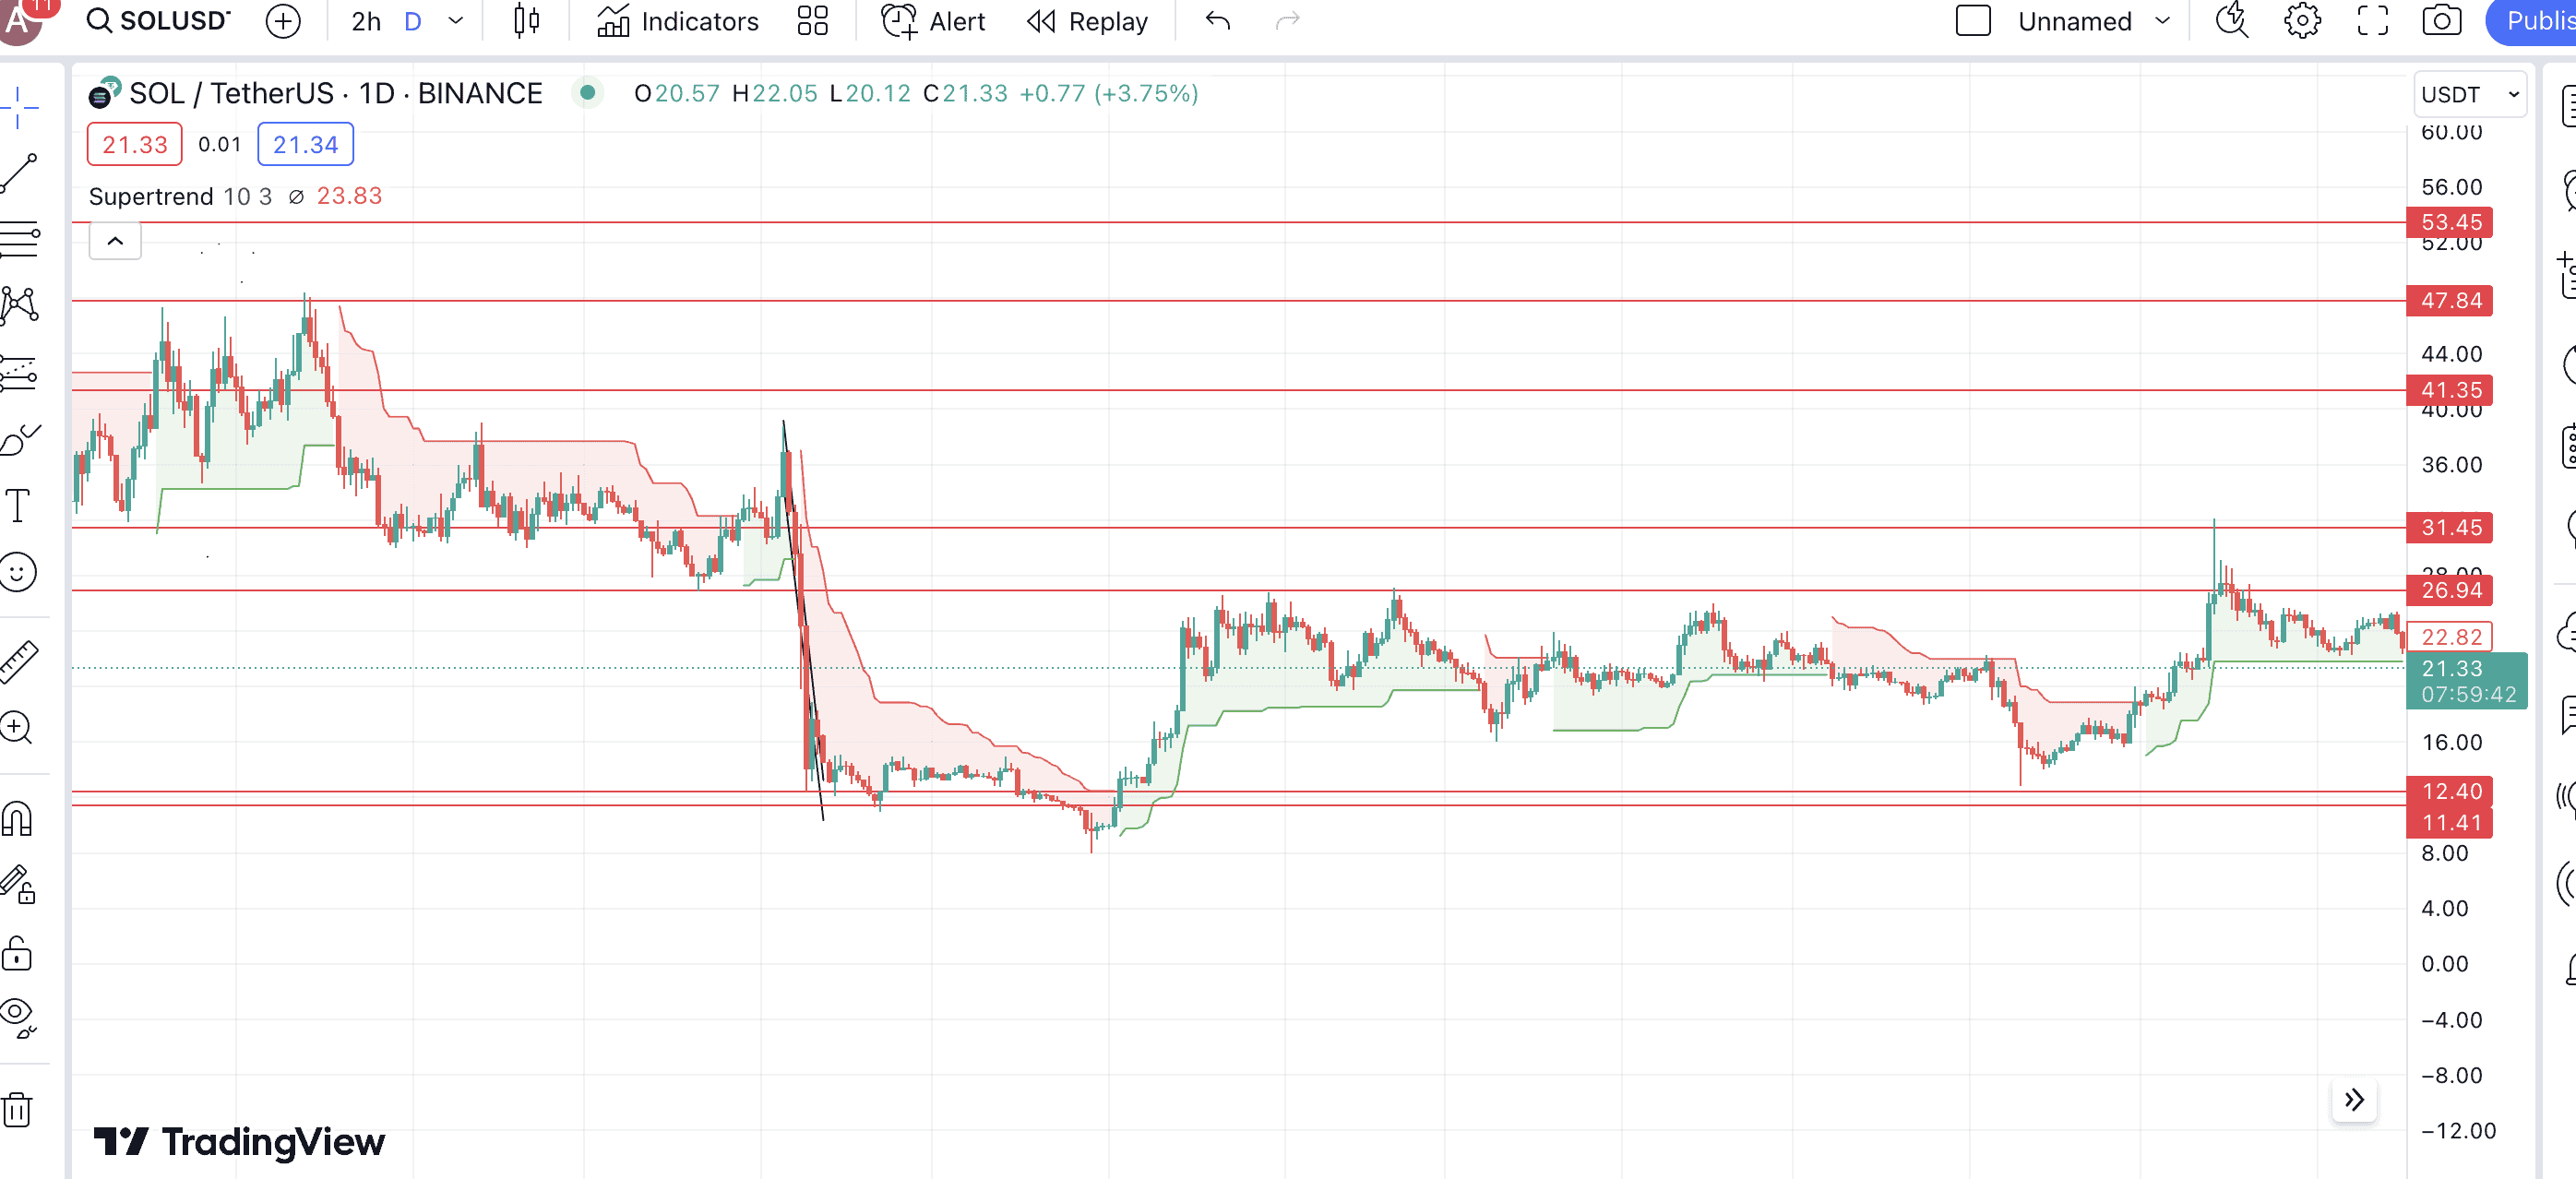
Another crypto, another representation of the Supertrend indicator:
The opposite of this holds, too. When the price breaks the green line and drops, we can consider a bearish trend shift. In that case, the red line appears, below which the price of the crypto trades. The red line then works as a dynamic resistance line, above which we can initiate fresh buys or exit a short position.
Another important thing to know about the Supertrend Indicator, in regards to crypto trading, is that it only takes the closing price of an asset into consideration. The concept of closing price captures the day-specific consensus rather well, helping with the best ATR value. This forms the base of the Supertrend Indicator and works in the background.
How relevant is the Supertrend Indicator to crypto trading?
The crypto market is known for its volatility, and with ATR in play, the Supertrend Indicator takes that into account. However, if you plan on using Supertrend as a standalone indicator to locate buy and sell signals, you can do so based on the color changes. While we have already touched on the basics, here is a more segmented take on interpreting the Supertrend Indicator for crypto trading.
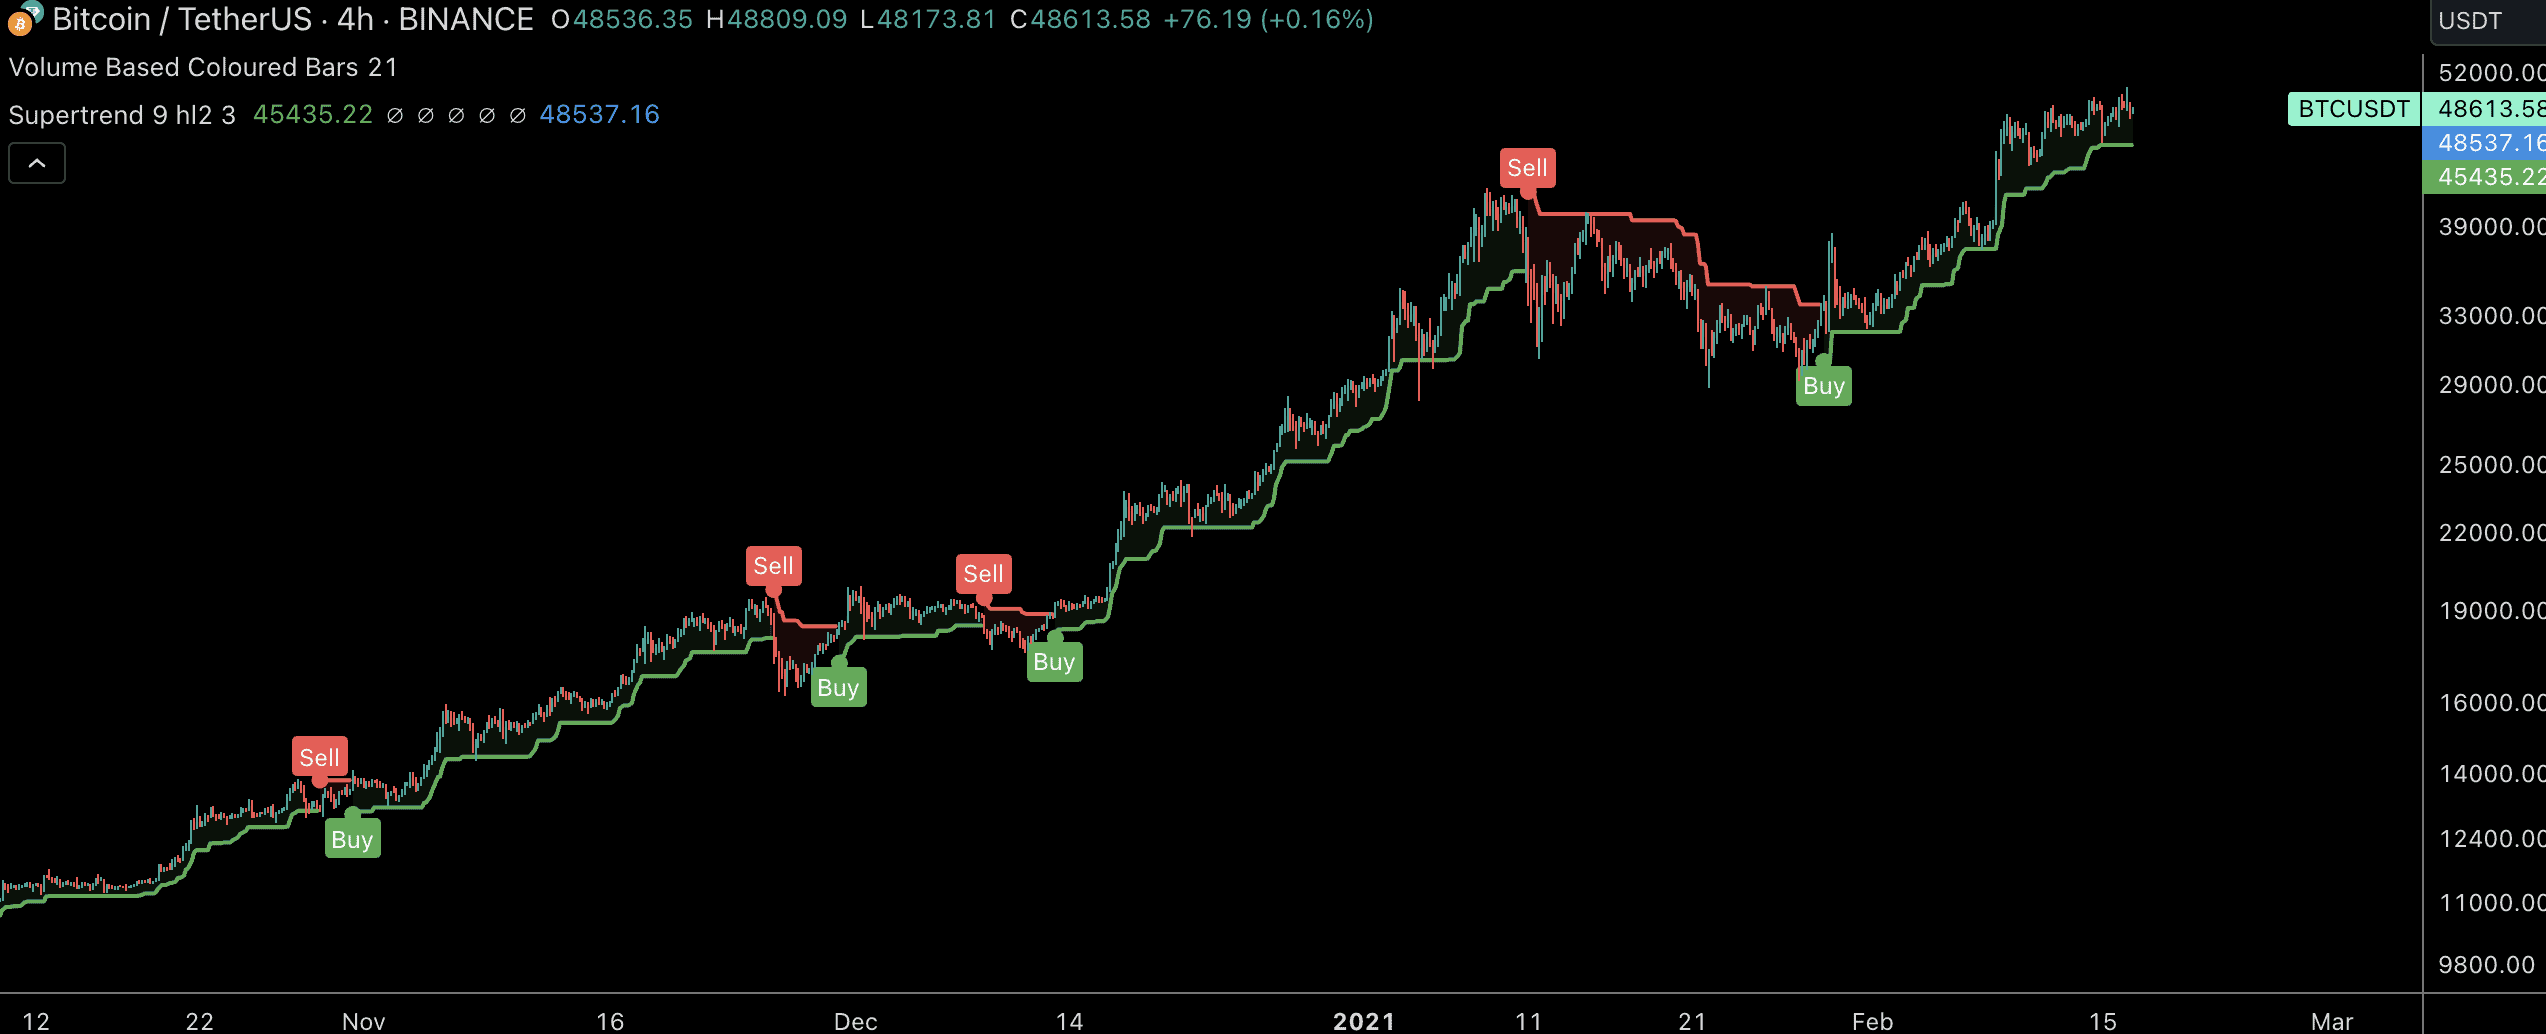
Identifying transitions for buy and sell signals
The idea is simple. If the Supertrend line transitions from green to red, it offers a strong sell signal. This move indicates a short-term or long-term trend shift from bullish to bearish. Traders who are already holding positions can exit when the price breaches the green and the red starts appearing.
Conversely, if the line transitions from red to green, there is a strong buy signal, demonstrating a bearish to bullish trend shift. Traders planning to buy can take positions.
Setting up stop losses using the Supertrend line
You can use the red or green line of the Supertrend indicator to set stop losses, either for a short or a long order. The indicator is an effective tool to locate stop loss levels, even helping initiate stop limit orders. If the asset is in an uptrend, you should place the stop loss order immediately below the green line. This would be for a long order.
The stop loss should be immediately higher than the red line for a short position. We should be working with trending markets to make the best use of the Supertrend indicator for crypto trading. Ranging markets moving sideways can return less dependable signals. And that is when you should pair additional indicators with the Supertrend.
The mathematics behind the Supertrend Indicator
You might wonder how the Supertrend Indicator is charted. Let us now track the mathematics behind it. As mentioned, the Supertrend Indicator for crypto trading comprises upper and lower lines. They are represented as follows, where the multiplier is the user-generated number.
- Upper Line = (High + Low) / 2 + (Multiplier × ATR)
- Lower Line = (High + Low) / 2 – (Multiplier × ATR)
Also, the high and low values correspond to the high and low values of the given period or the length for which the ATR is calculated.
Notably, the ATR only uses the closing price and signifies the volatility exhibited in a given timeframe. The formula for ATR is as follows:
[(Previous ATR x 13) + Current TR] / 14
Where 13 and 14 are the random periods — the timeframes within which the prices and volatility metrics are calculated.
A longer period followed by a longer ATR length is more suitable for long-term trading signals. Also, for long-term traders, you can choose a higher multiplier value for getting better trading signals.
Supertrend Indicator and the best crypto settings
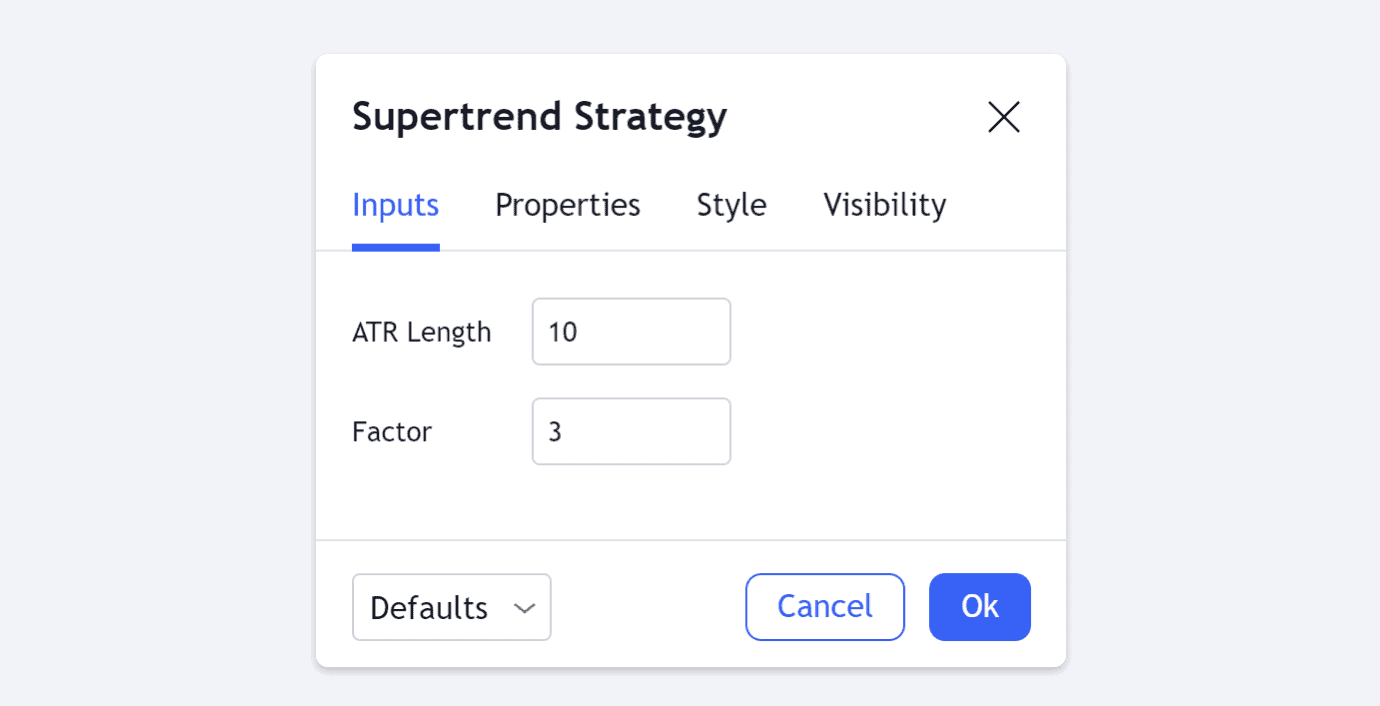
If you click on the “Settings” icon against the Supertrend Indicator, you will open the section where you can play around with the ATR length and the multiplier. While you get the Supertrend 10/3 as the default setting, you can change that depending on the type of trading signals you seek.
A higher ATR length hints at long-term trades, whereas a higher multiplier is meant to smooth out the volatility data to fit the same into a larger timeframe. It is the multiplier that determines the price sensitivity of the asset. For crypto, where smaller price surges are common, a smaller multiplier number can be handy at times.
Settings for long-term trades, including swing trading
As a long-term trader, you might find the 20-period (ATR length) and “two multiplier” setting the best. Having 20 as the ATR length lets you in on the closing price of the previous 20 periods. This could be 20 days for a day chart, 20 4-hour splits for a 4-hour chart, and so on and so forth.
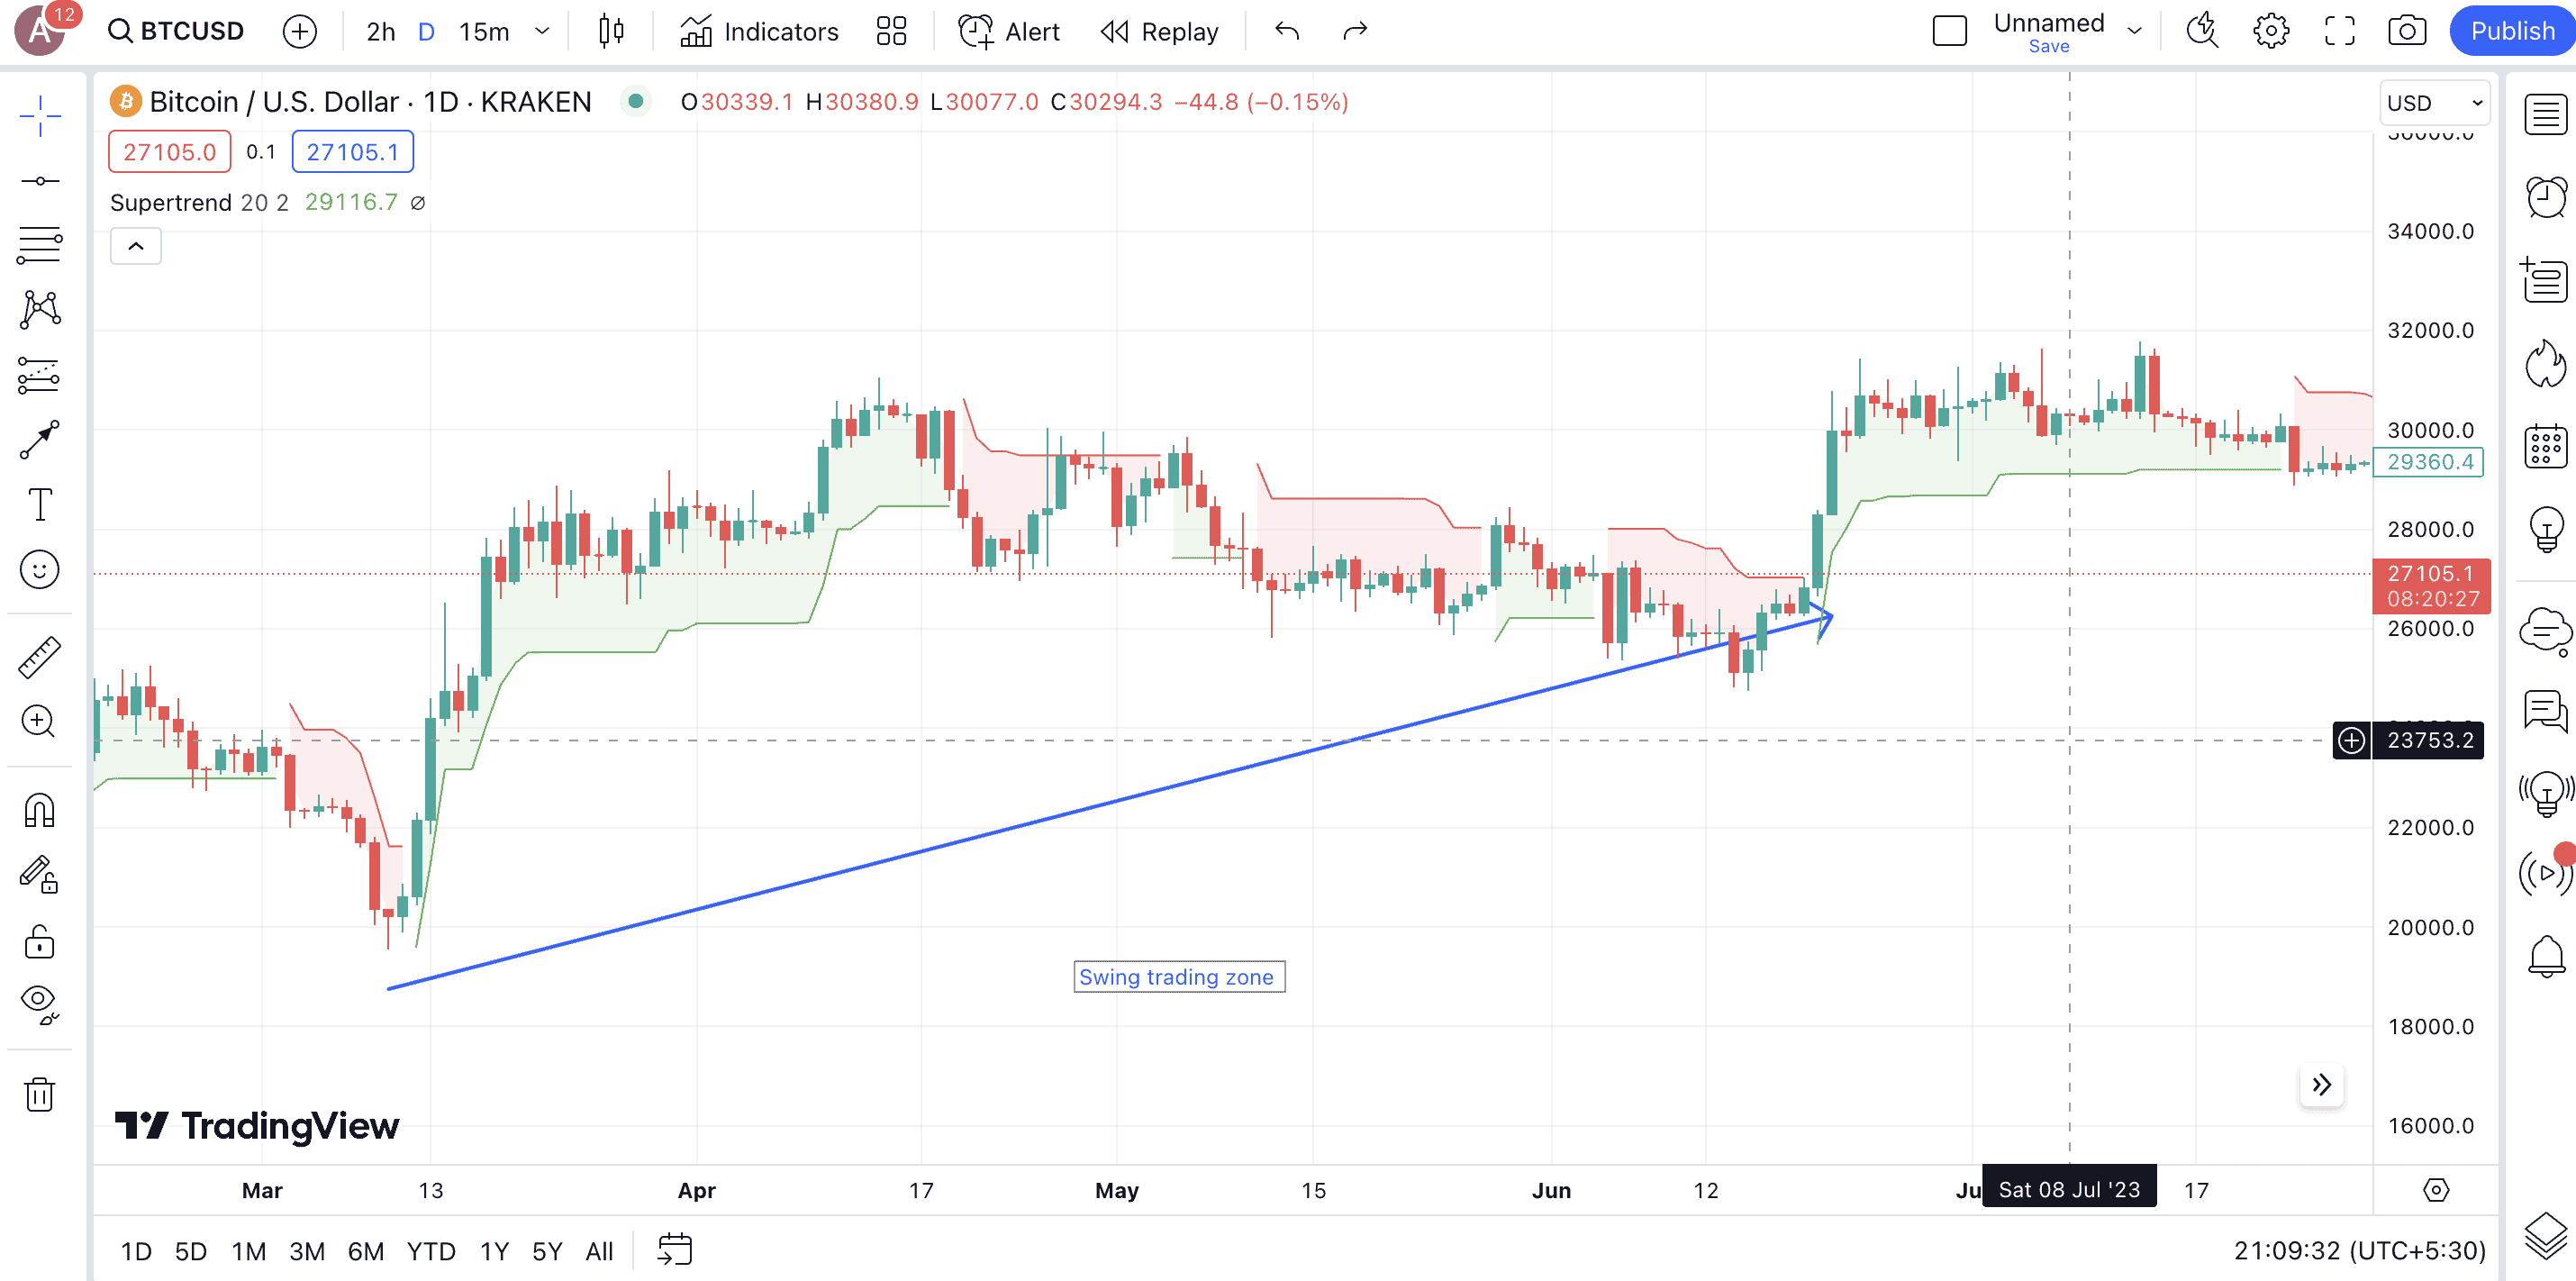
Also, the two multiplier setting lowers price sensitivity but not significantly, allowing traders to capture some small price changes in an ever-changing crypto market.
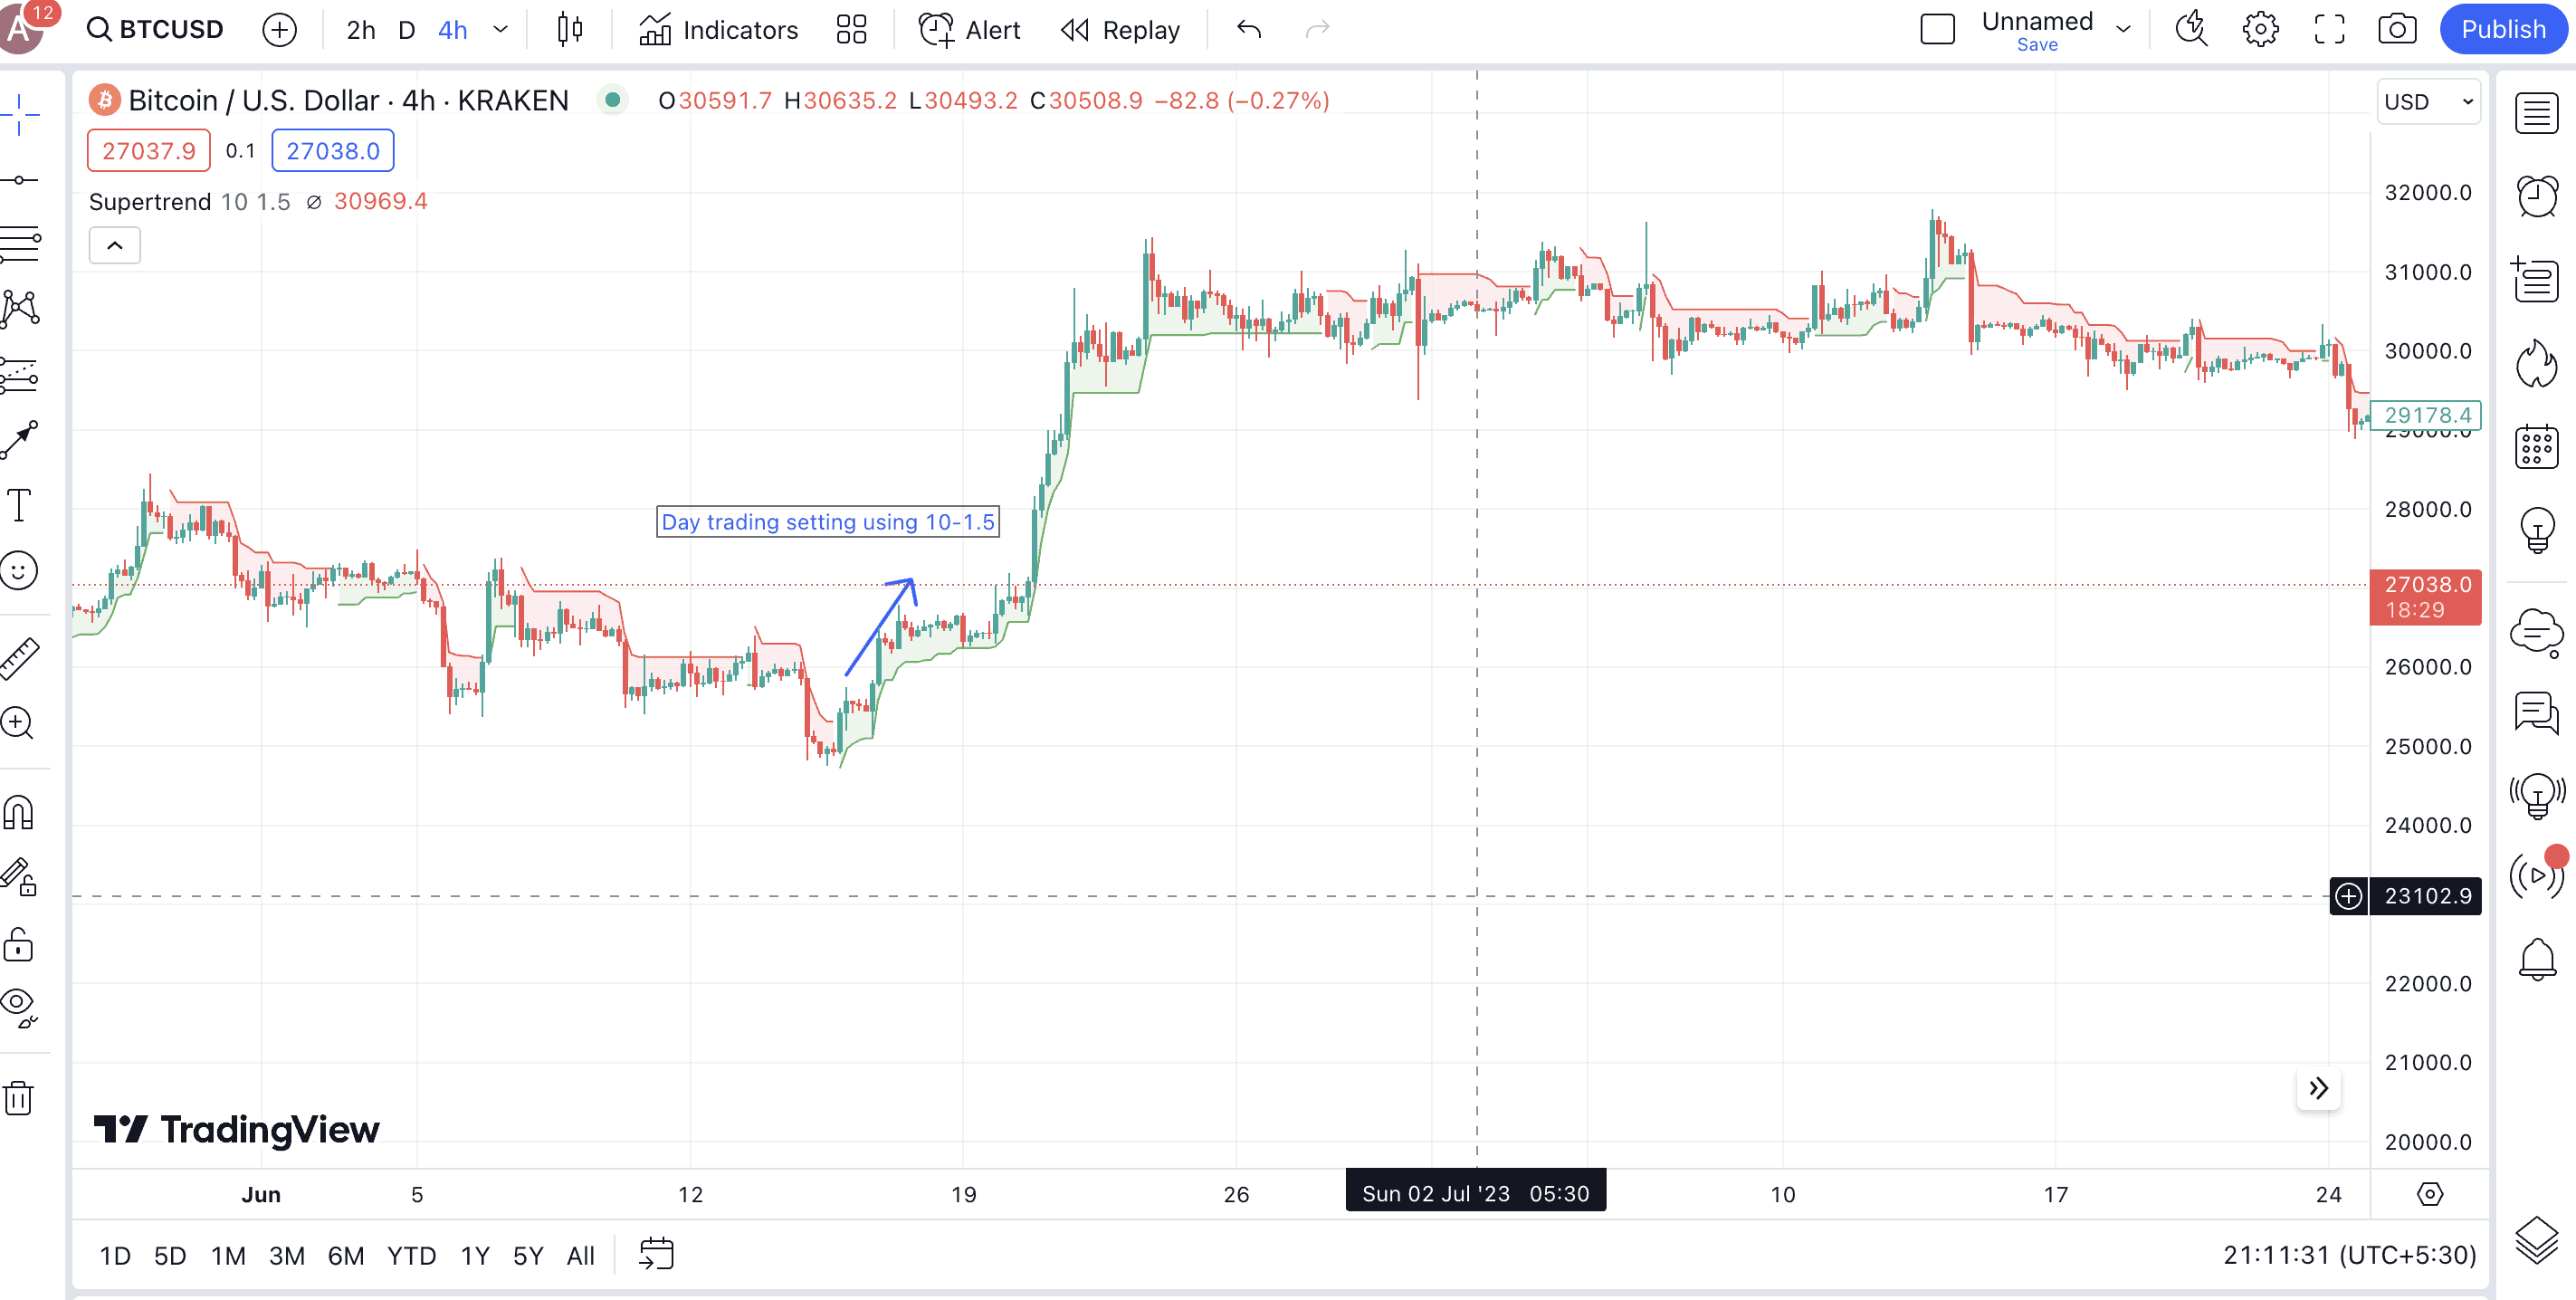
Settings for day trades
If you are into day trading, a ten period and a 1.5 multiplier seem like the fitting values. While the ten period primes the Supertrend Indicator for recent crypto price changes, the 1.5 multiplier increases the sensitivity to smaller price changes, allowing traders to capture every chance at a successful trade.
Settings for adaptive trades
In case you want Supertrend settings aligned with your diverse trading needs, the 14-2.5 input can be used. The 14-period ATR offers a moderate view, somewhere in between the long-term and short-term. The 2.5 multiplier is higher than the default value of two but lowers the market noise to a considerable extent.
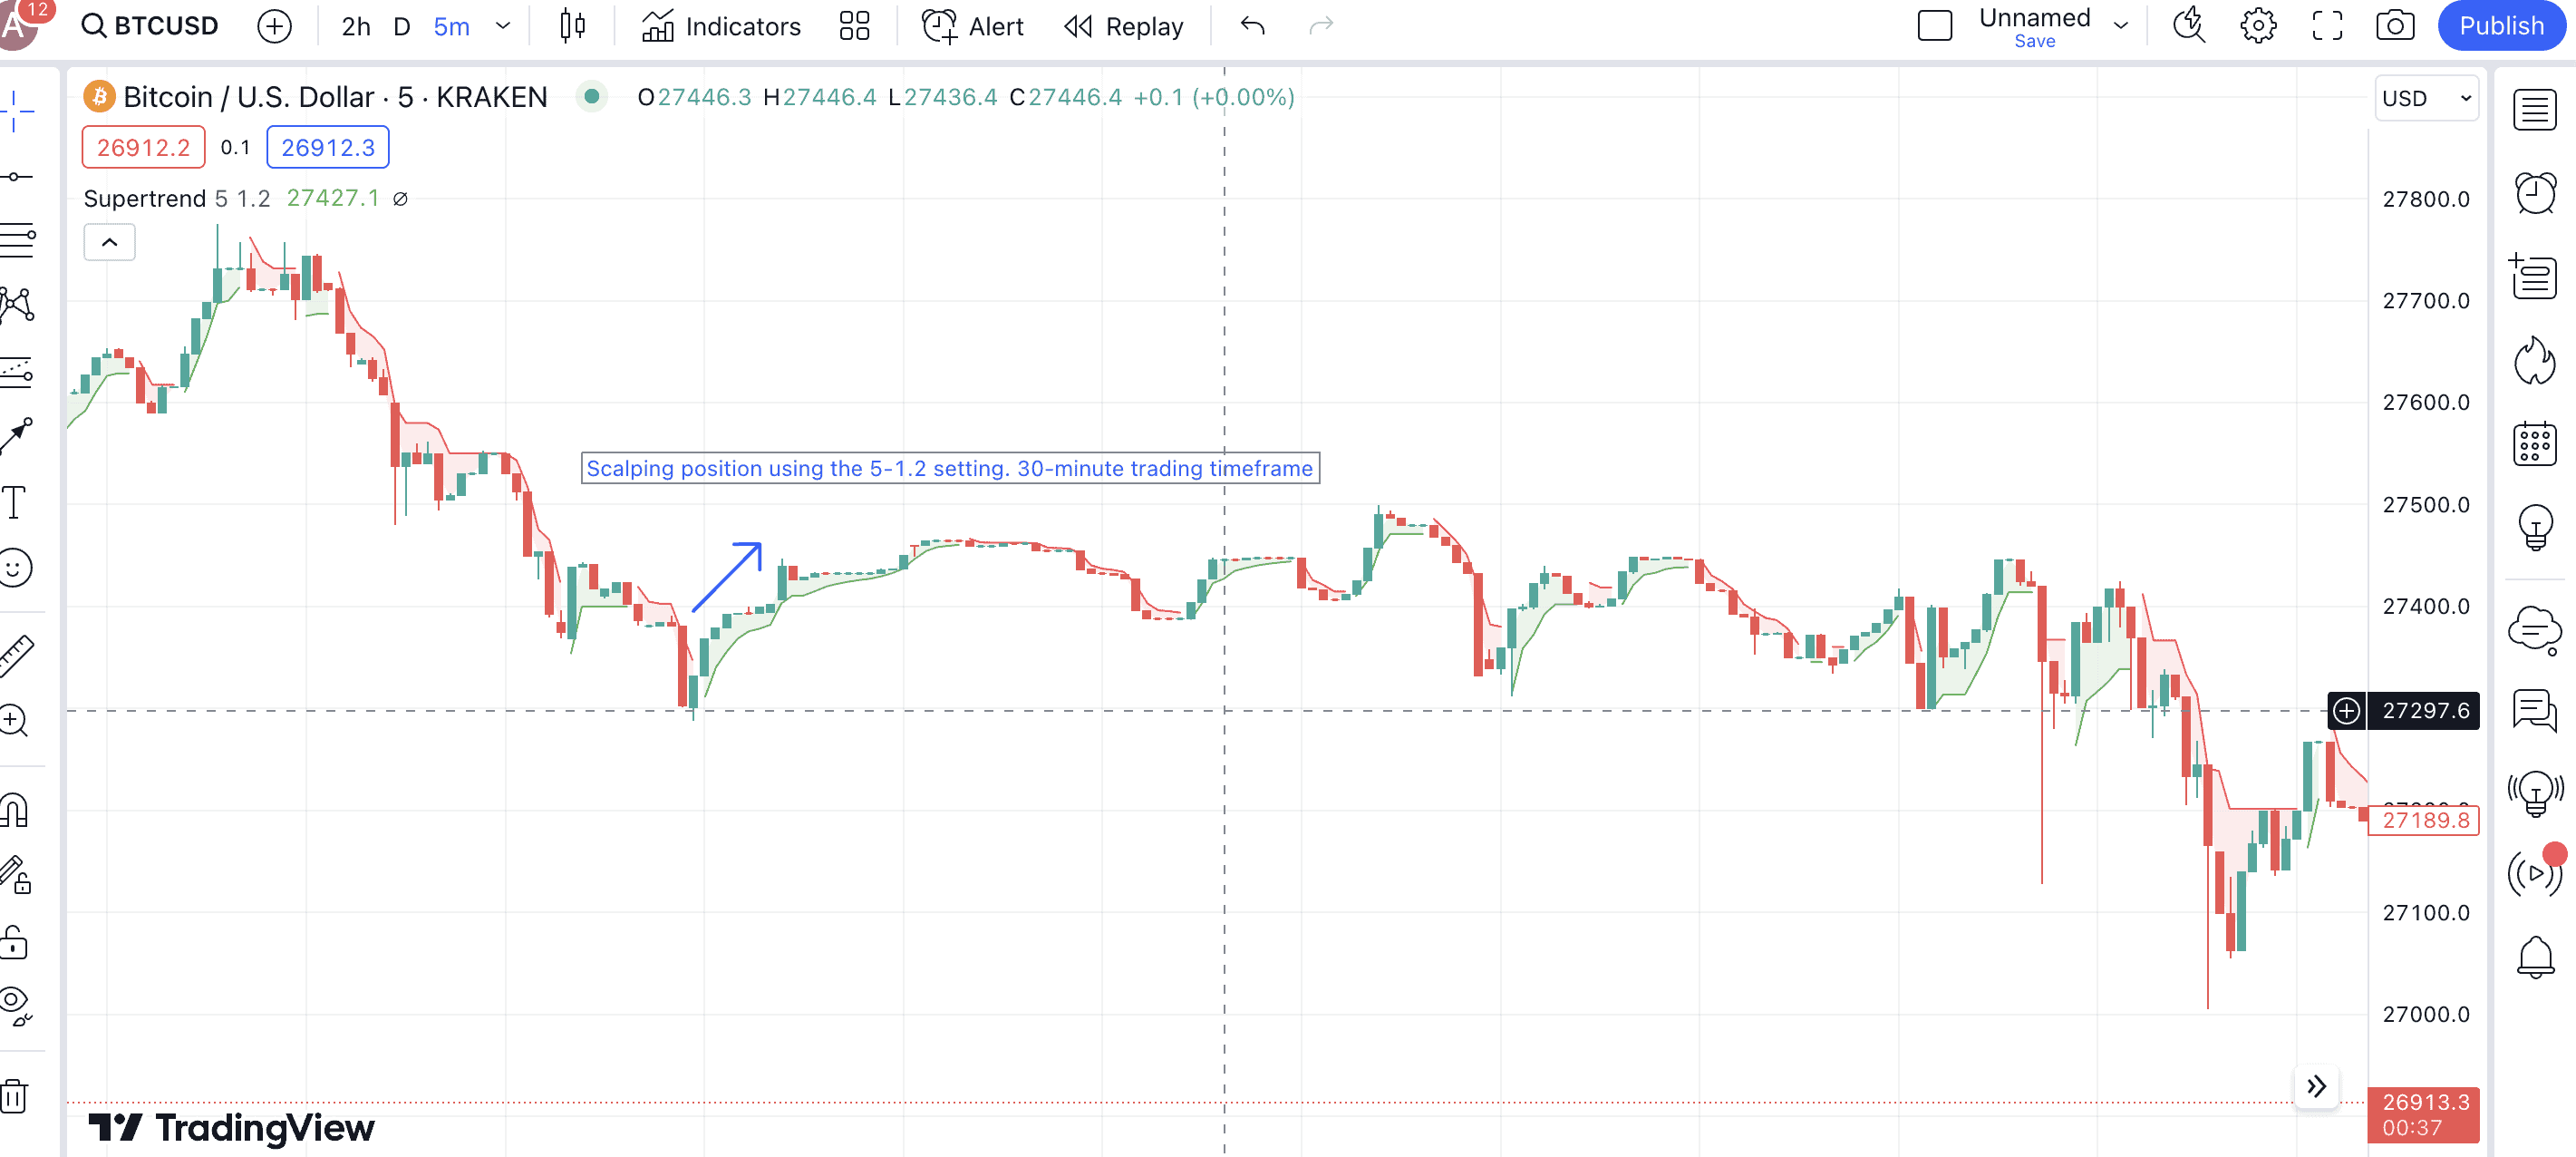
Settings for scalping and intraday
Scalping is all about trading the shortest of price surges and dips. This form of trading usually happens in the five to 15-minute timeframe. The best Supetrend Indicator setting to scalp trade crypto has to be the 5-1.2, where the 5-period ATR responds to the swiftest price changes, and the 1.2 multiplier makes the entire setup highly sensitive.
Settings for volatile pairs
Trading volatile crypto pairs with the Supertrend Indicator is possible. You simply need to set the ATR length at seven to capture the short-term trading signals while setting the multiplier to three. This would decrease sensitivity to very short spurts, making the entire setup short-term focussed but with an eye toward risk management.
Here is a tweet that sheds light on bitcoin’s volatility, showing the increasing certainty around BTC as an asset:
Each mentioned strategy uses the Supertrend Indicator as a solo technical analysis tool for crypto trading. Only relying on it can return false signals. Therefore, you are better off pairing it with other indicators or different variations of the Supertrend line itself.
Let’s finish up this section with a fun post about the indicator:
Best crypto day trading strategies using the Supertrend Indicator
If you want to use the Supertrend indicator to its fullest capabilities, precisely for crypto trading, you are better off improvising. And from improvising, we mean pairing other indicators or more of the same indicator with the Supertrend. Here is how these strategies can help you ride downtrends and uptrends and even make use of the sideways wave if needed.
Double Supertrend strategy
This trading strategy combines two Supetrend lines, each with different settings. If you plan on setting up an adaptive trade, a 20-3 and a 10-2 strategy might make sense. For scalping or even day trading, a 10-2 and 5-1.2 strategy looks better, especially if you want to capture the short-term price movements.
A better trading position would be when both the indicator lines are green, hinting at a strengthened bullish phase. But then, if the market is trending sideways, this strategy might also return false signals. We shall consider offsetting the false trading signals in some of the subsequent strategies.
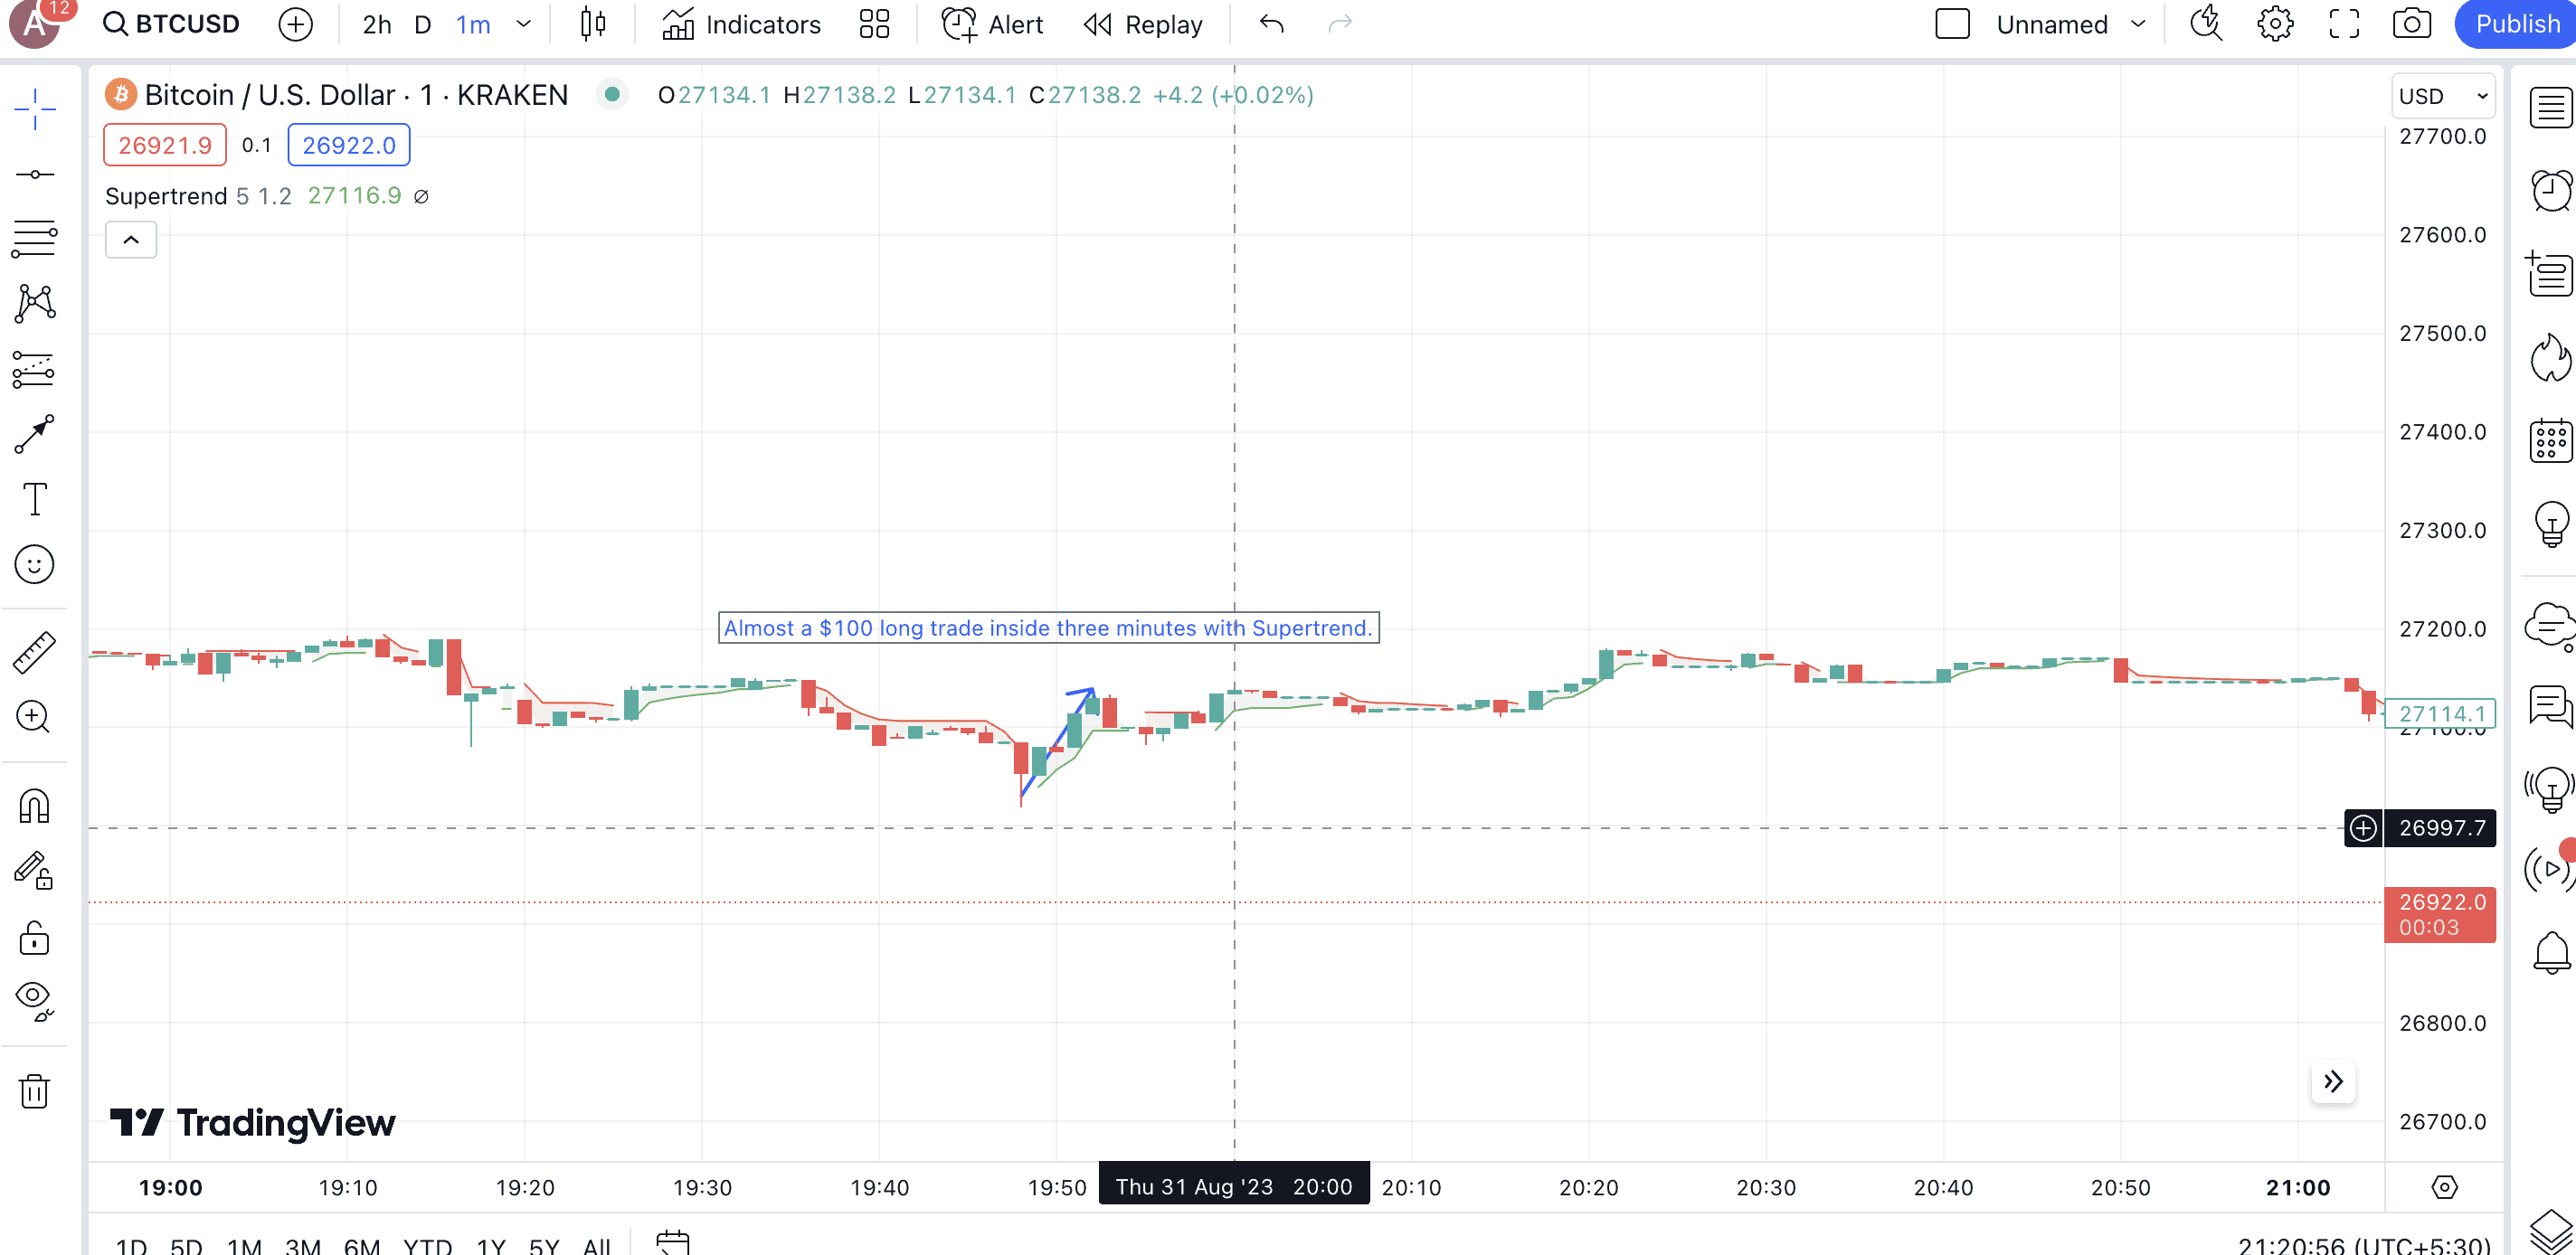
1-minute Supertrend strategy
The 1-minute Supertrend trading strategy is precisely meant for locating scalping trades. The idea here is to use the 5-period and the 1.2 multiplier setting but on a 1-minute timeframe. When the Supertrend flips from red to green in the 1-minute timeframe, you can quickly make a trade. The green line can also act as a trailing stop loss.
You can even add the VWAP indicator for additional confirmation. If the price for the 1-minute timeframe remains above the VWAP, especially when the Supertrend indicator turns red to green, you might want to enter the trade. Exiting the trade or taking a short position might make sense if the Supertrend line turns green to red and the price trades under the VWAP.
Triple Supertrend strategy
This strategy is similar to the double supertrend but involves three supertrend lines instead of two. Your ideal choice of settings could be 10-2, 20-3, and 30-4 — covering both long-term and short-term processes in the process. The third Supertrend line serves as a confirmation and helps filter out other falsies associated with a double Supertrend strategy.
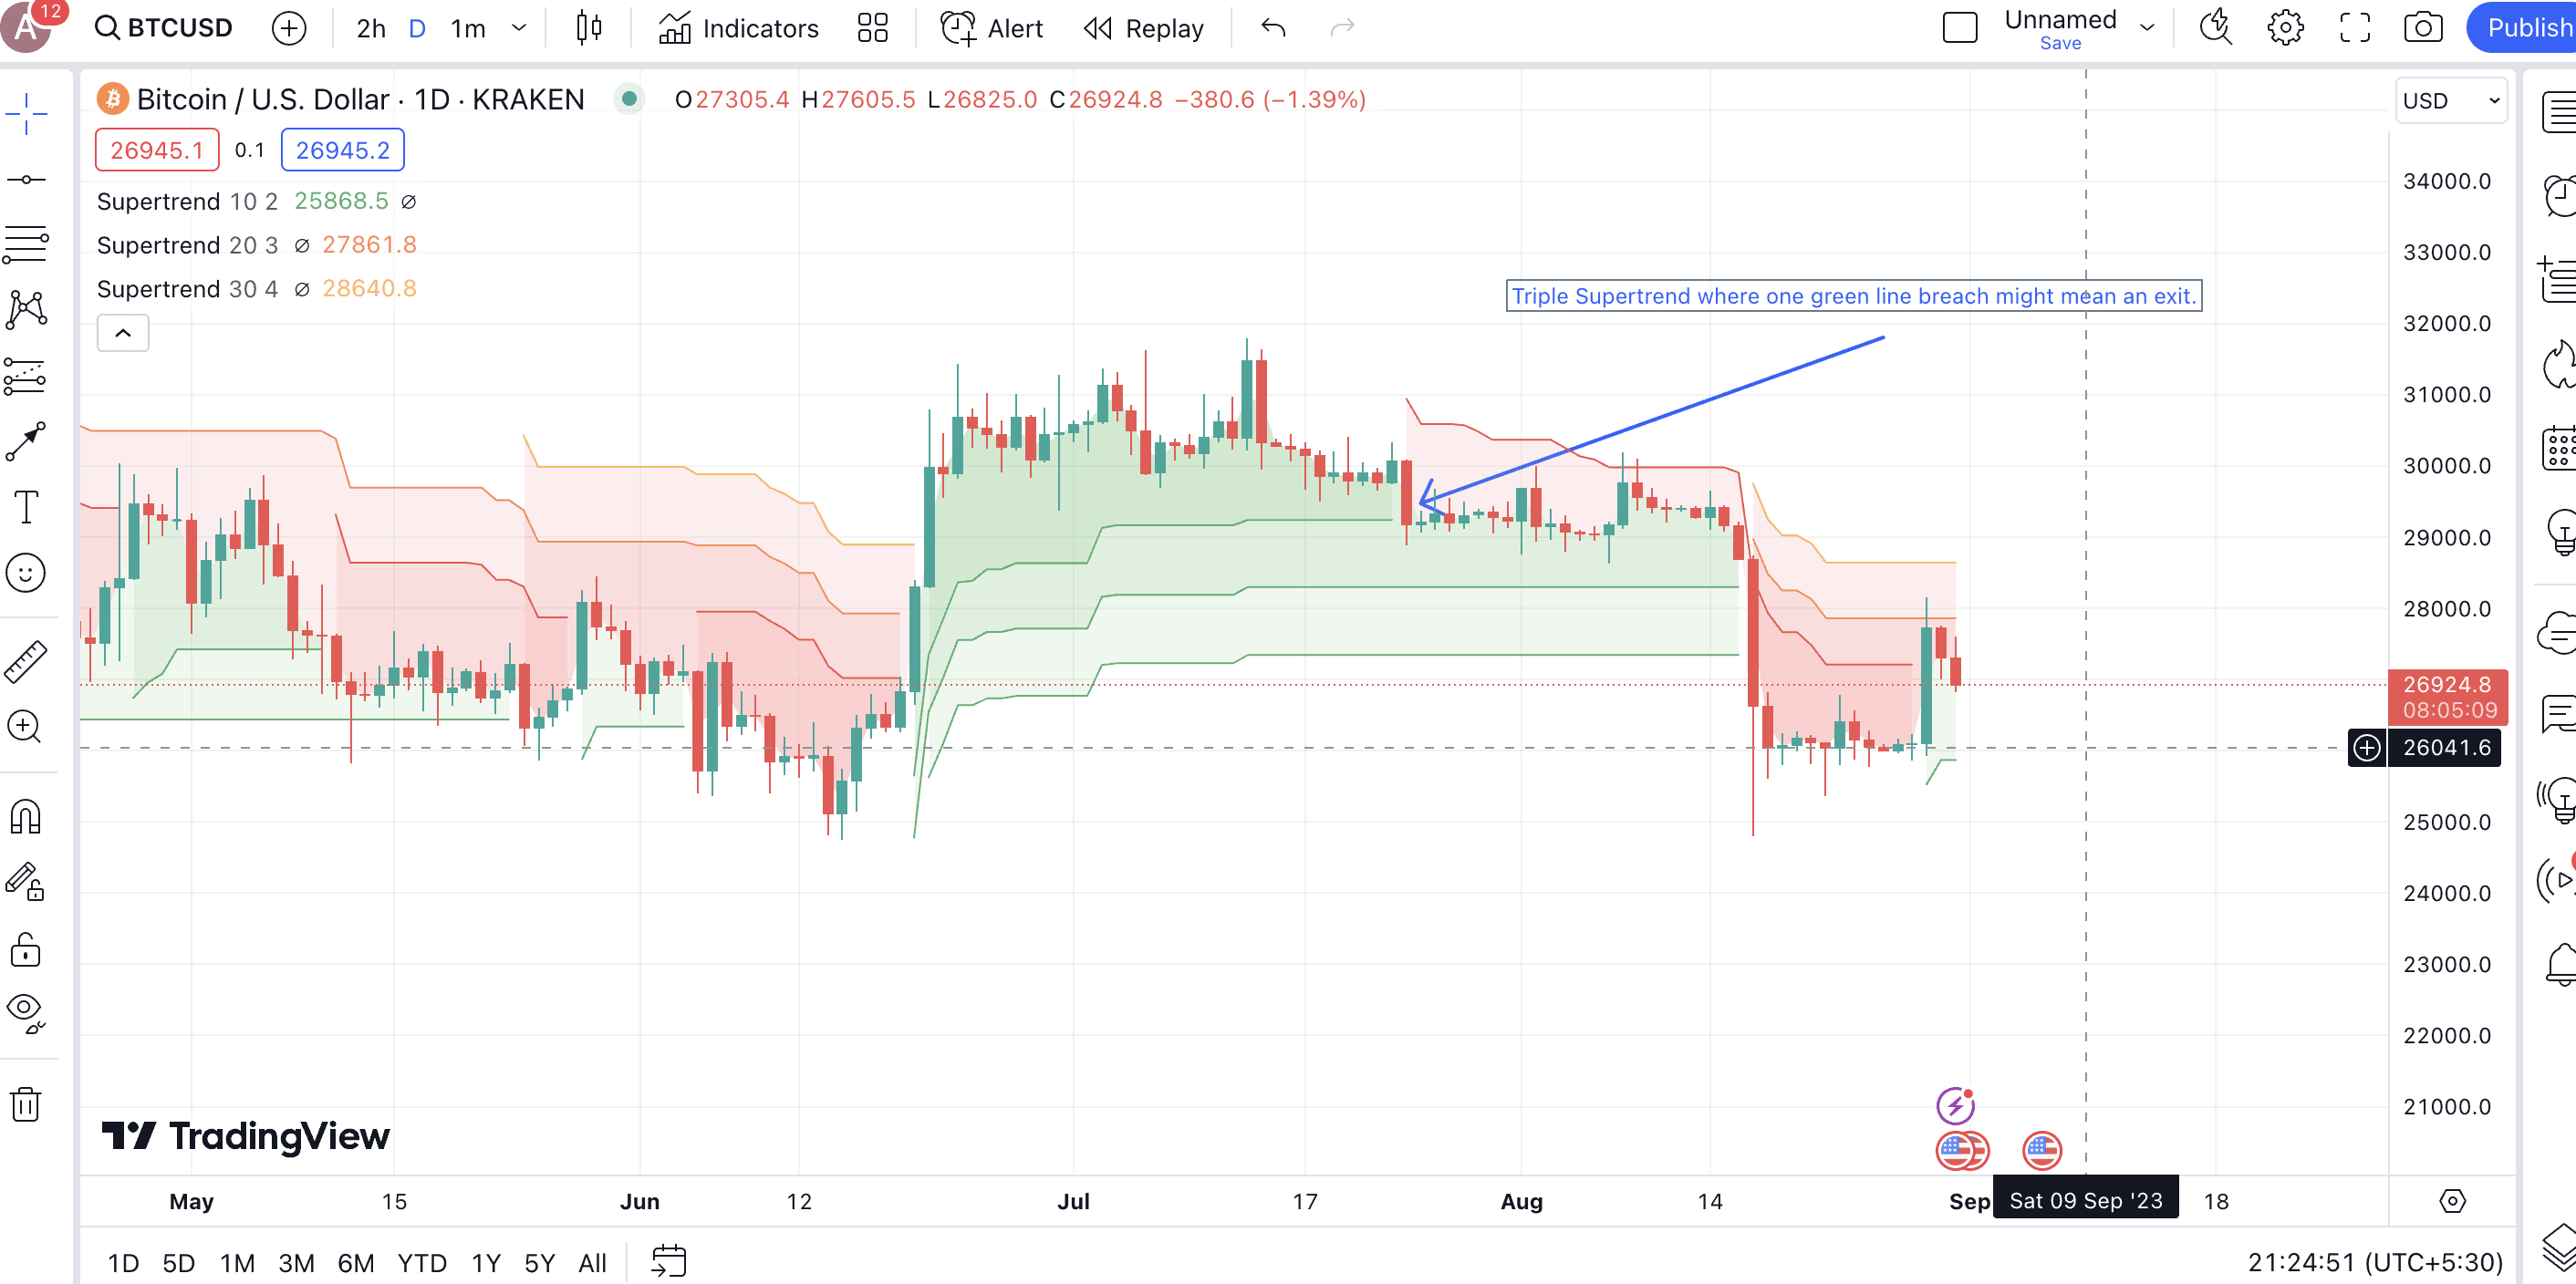
For an exit, you can consider the point when any of the three lines turns red from green.
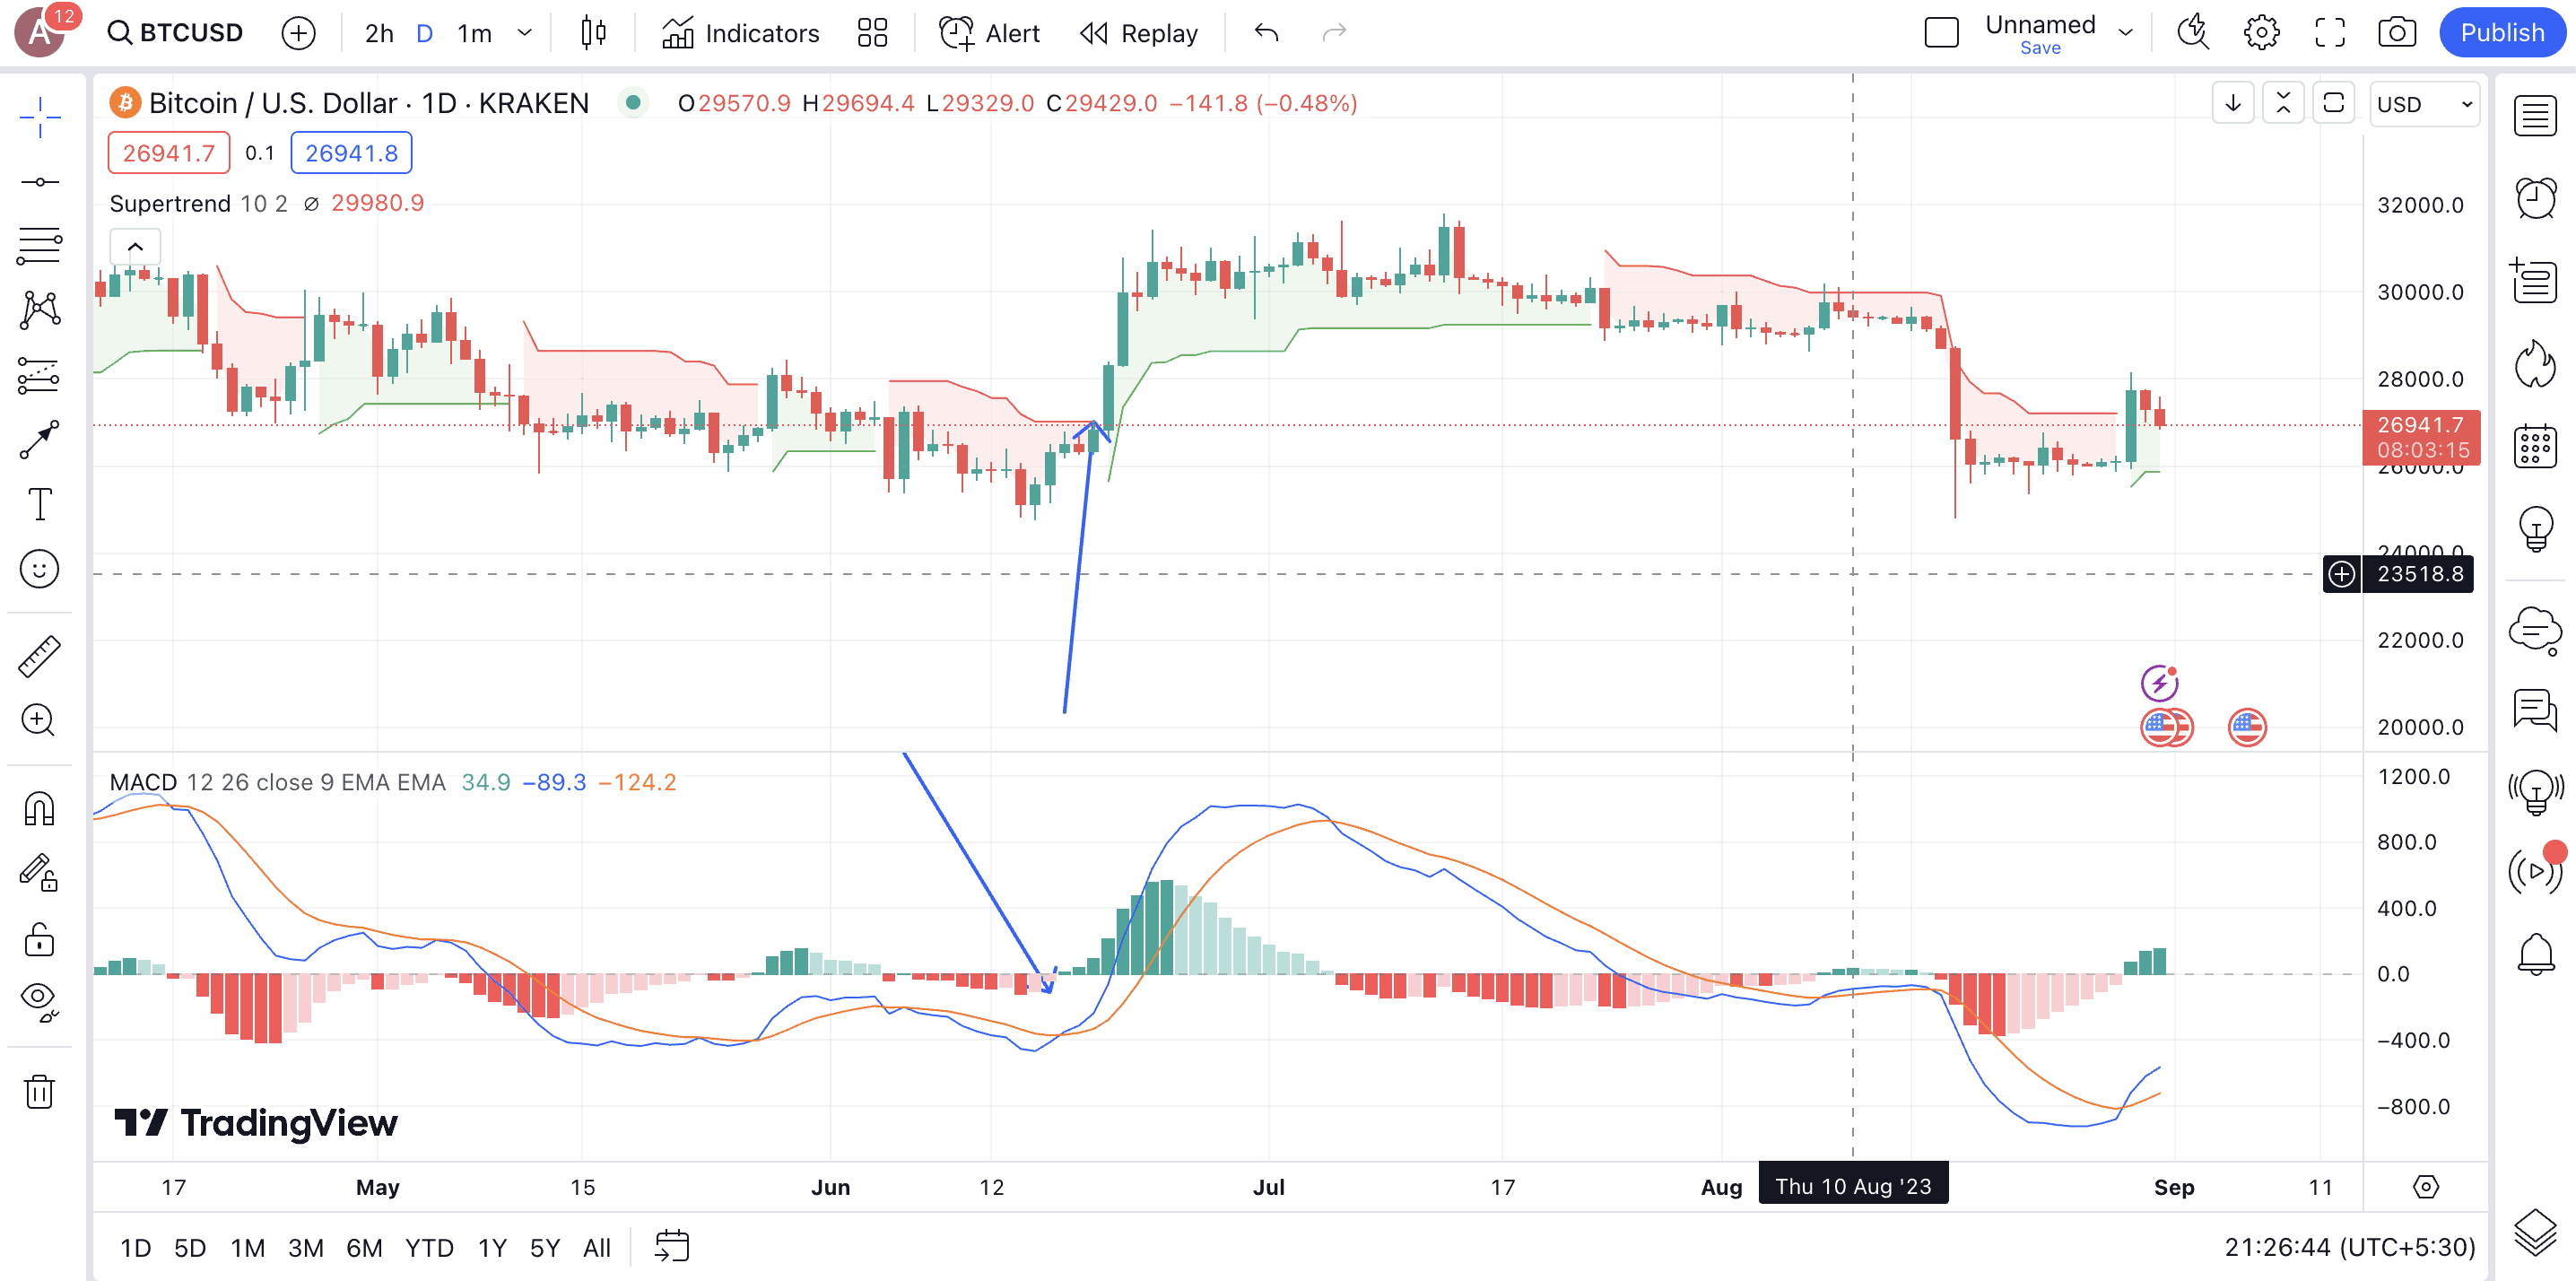
MACD Supertrend strategy
It is possible to pair another trend-following indicator with the Supertrend lines. A good way to look at this is to check for the MACD line crossing above the signal line whenever the Supertrend line turns green. This strategy is best used when dealing with 15-minute to even 4-hour timeframes. Notably, higher timeframes return more accurate results regardless of your buy or sell preferences.
Supertrend + EMA strategy
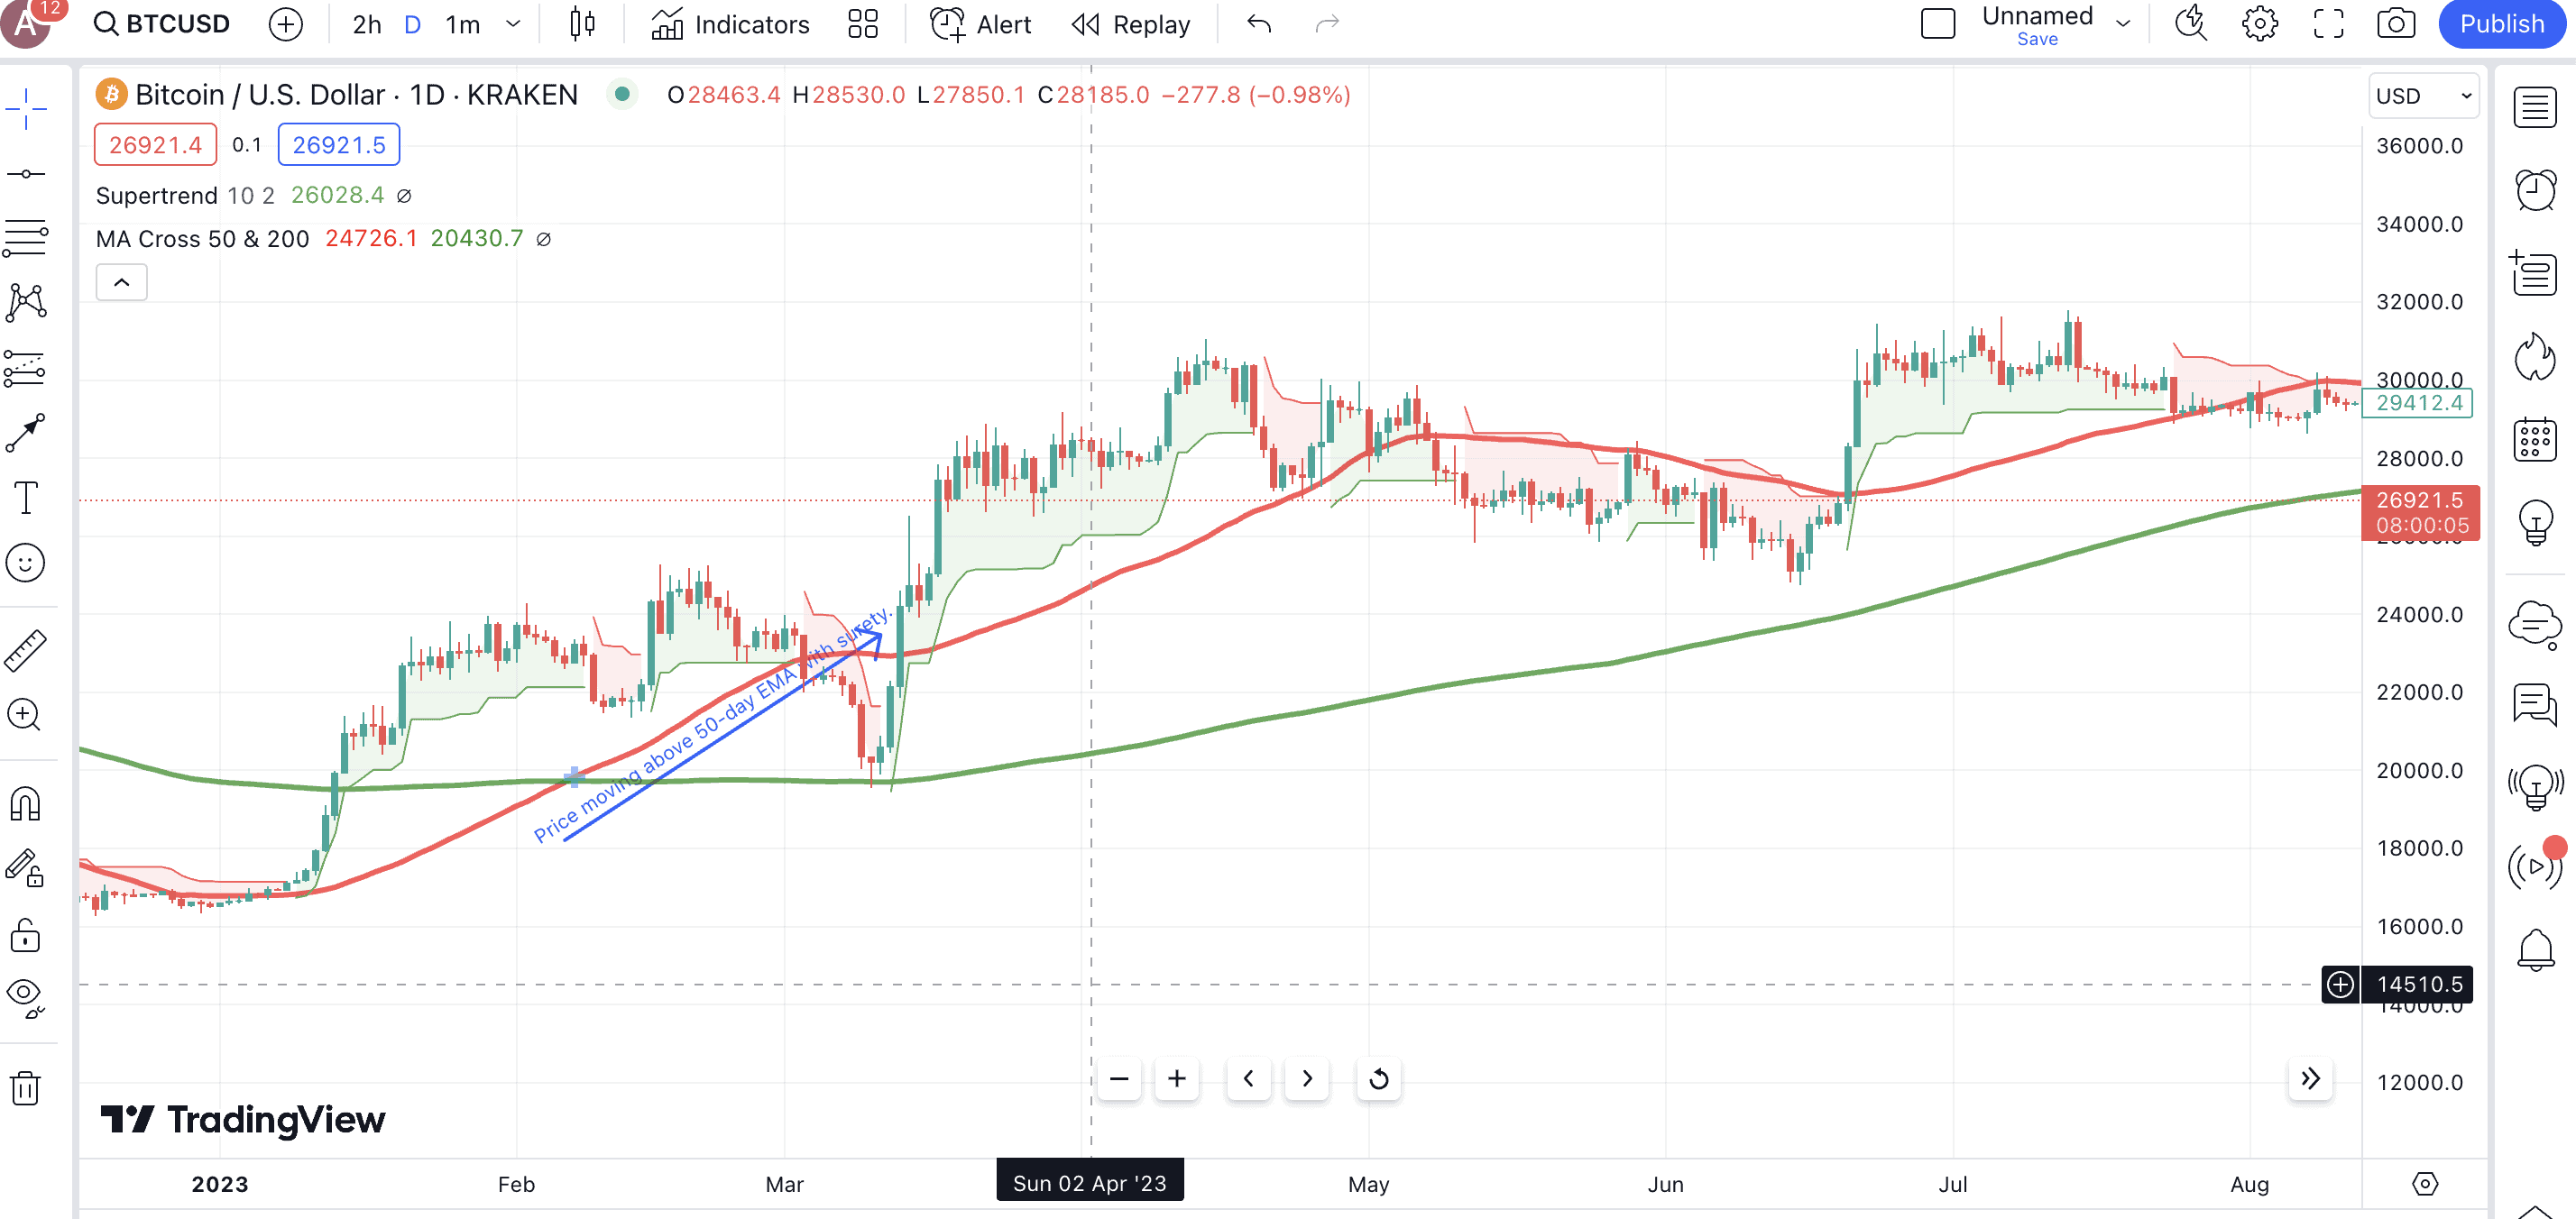
Exponential moving averages (EMAs) can indicate trends well and are great for confirming trend directions. A good way to pair them with the Supertrend Indicator for crypto trading is to place the 50-period EMA on the price chart and wait for the price to move above the same. Once that happens and the Supertrend line turns green, you might consider entering a long position.
Another way of looking at it is to track golden crossover-like events, where the shorter time frame EMA crosses above the longer time frame EMA, offering a bullish signal. If the Supertrend Indicator changes to green at this time, you can consider this a buying opportunity. The reverse of this applies even for events like death crossover or when the price falls below the 50-period EMA line, all while the Supertrend turns red.
Here is a thread that captures this winning strategy rather well:
This shows that the Supertrend indicator can give out reliable trading signals if you want to buy or sell crypto. Only the interpretation changes. The concept remains the same.
Bollinger-backed Supertrend strategy
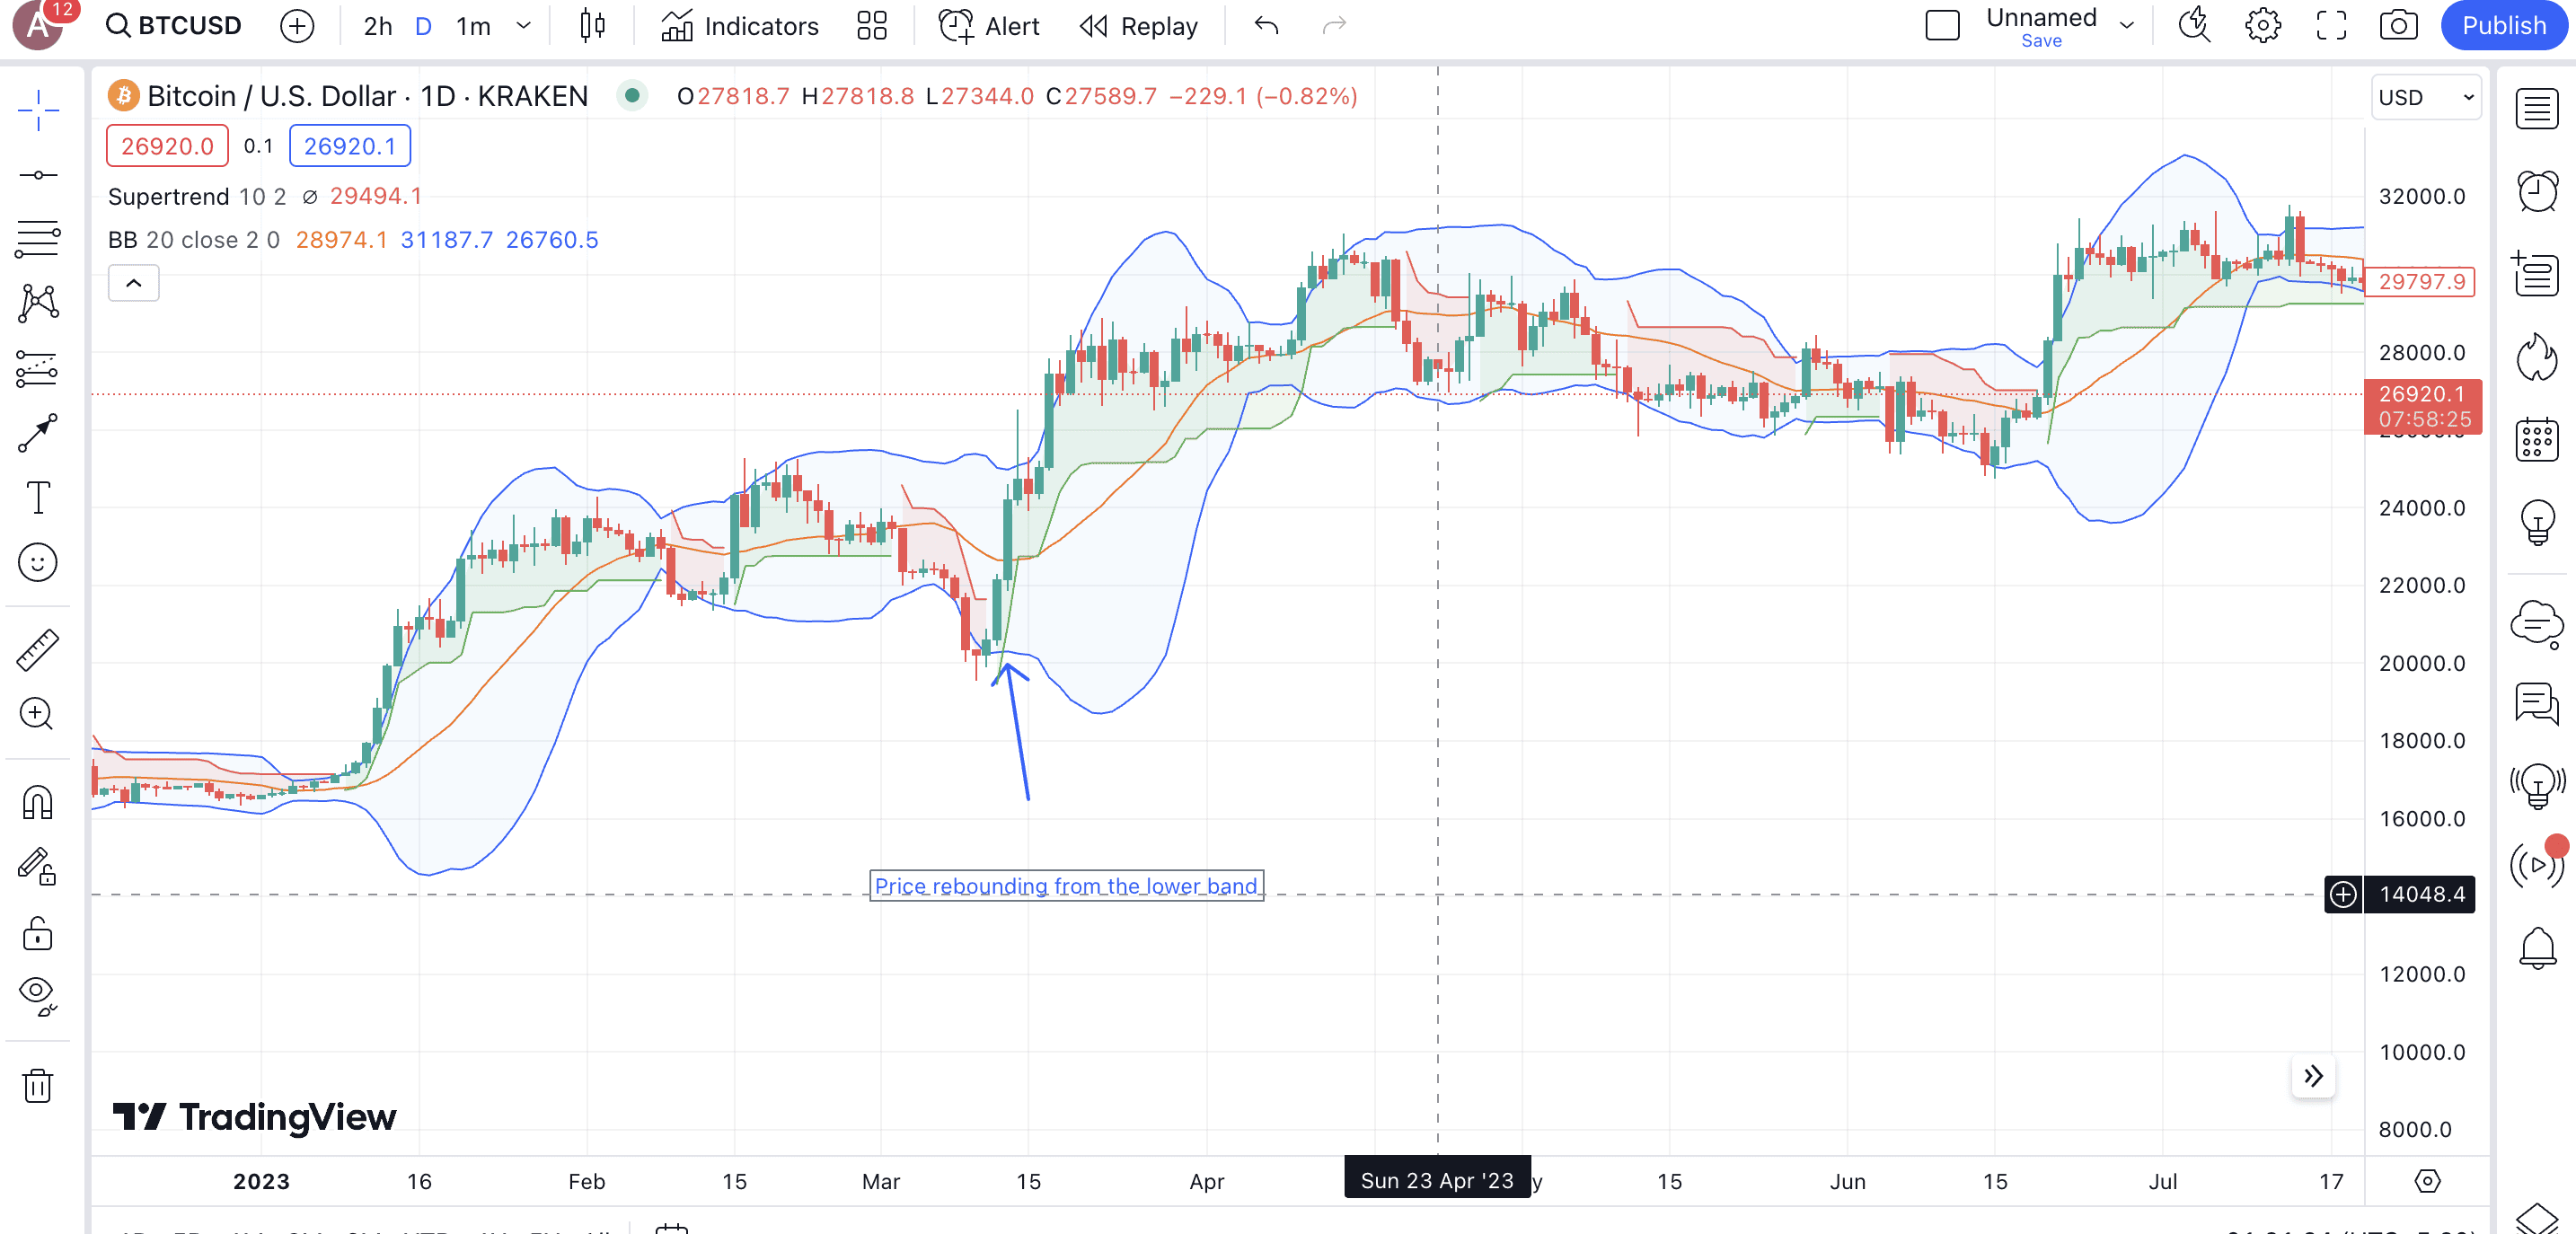
Bollinger Bands (BB) is a reliable volatility indicator. As the Supertrend indicator takes volatility into consideration, it is expected to work really well with BB. To get started, check if the price reaches the lower leg of the Bollinger Bands — the oversold segment — and the Supertrend Indicator turns green; it might hint at a buying opportunity.
In the case of Bollinger squeezes, the Supertrend line’s color tells you the breakout’s direction. If the line turns green, you can expect a price surge; if the line turns red, you can expect a sizable correction corresponding to a falling knife pattern. Also, to make use of Bollinger Bands, you might want to consider the 30-minute to 1-day timeframes.
Volume-driven Supertrend strategy
Trading volume can be a great ally when it comes to confirming any strategy. If you want to use the Supertrend Indicator for crypto trading, apart from looking at the red-to-green line color shift, you might also want to look at a surge in trading volumes. Notably, the volume-driven strategy works better on longer timeframes so that we can filter out the manipulative surges in trading activity.
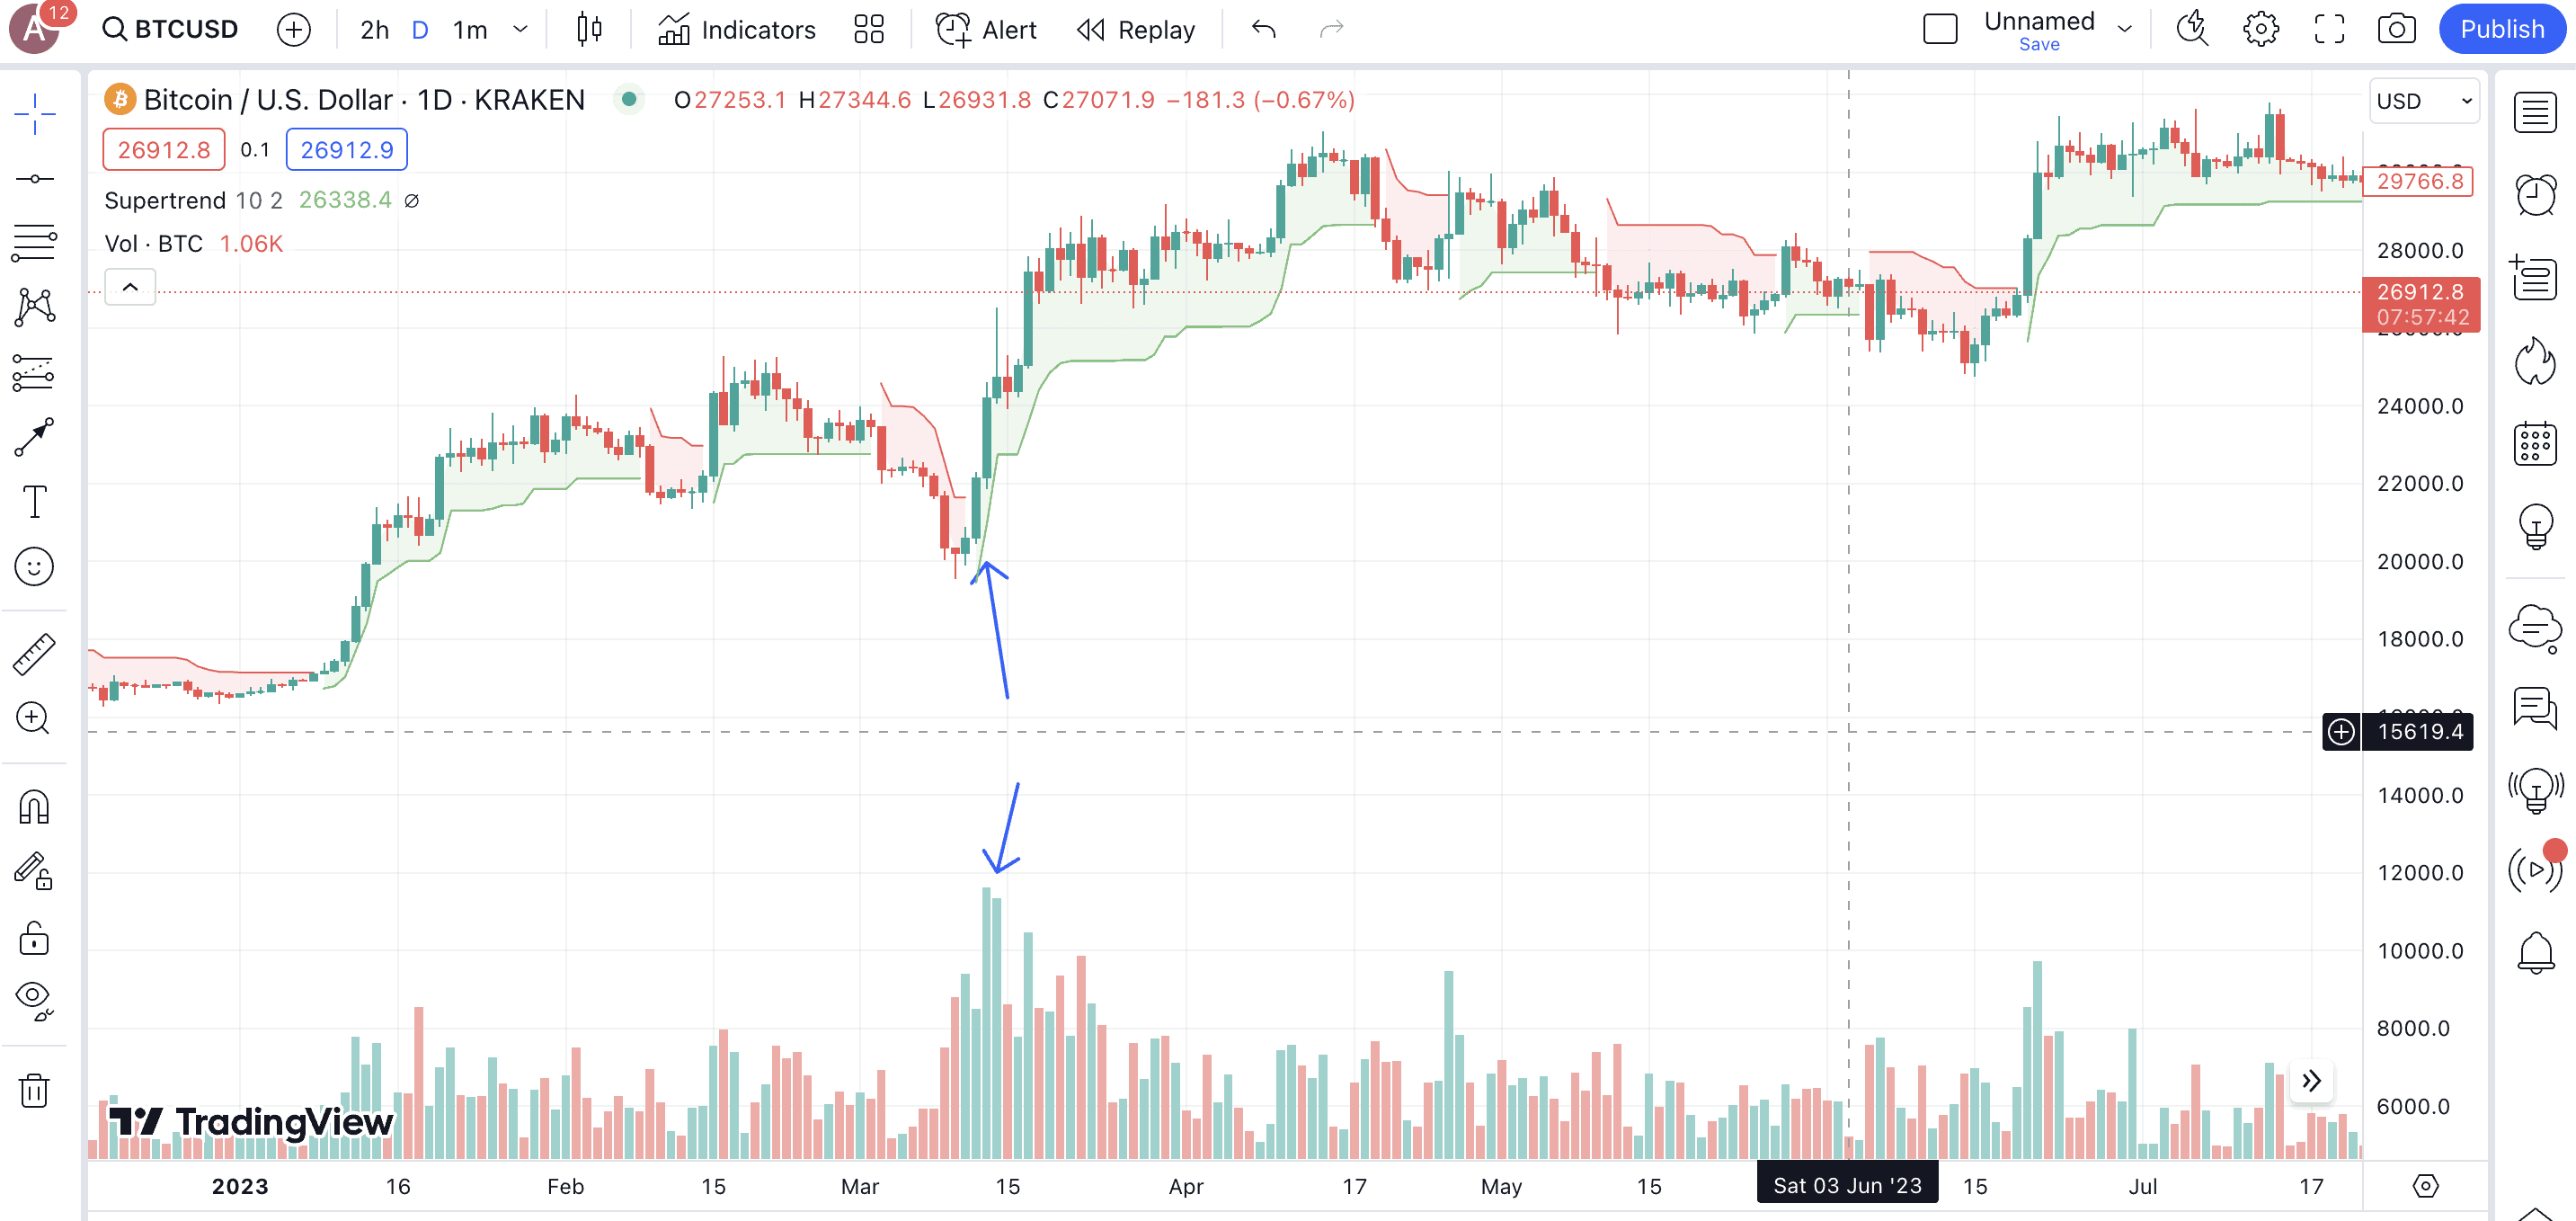
A higher volume often indicates accumulation, provided it aligns with the green Supertrend line.
Breakout strategy
If you are good with crypto trading patterns like the Flag and Pole, triangles, and more, you can use the Supertrend indicator well. To go long, check for any time a pattern breakout happens while the Supertrend line changes from red to green.
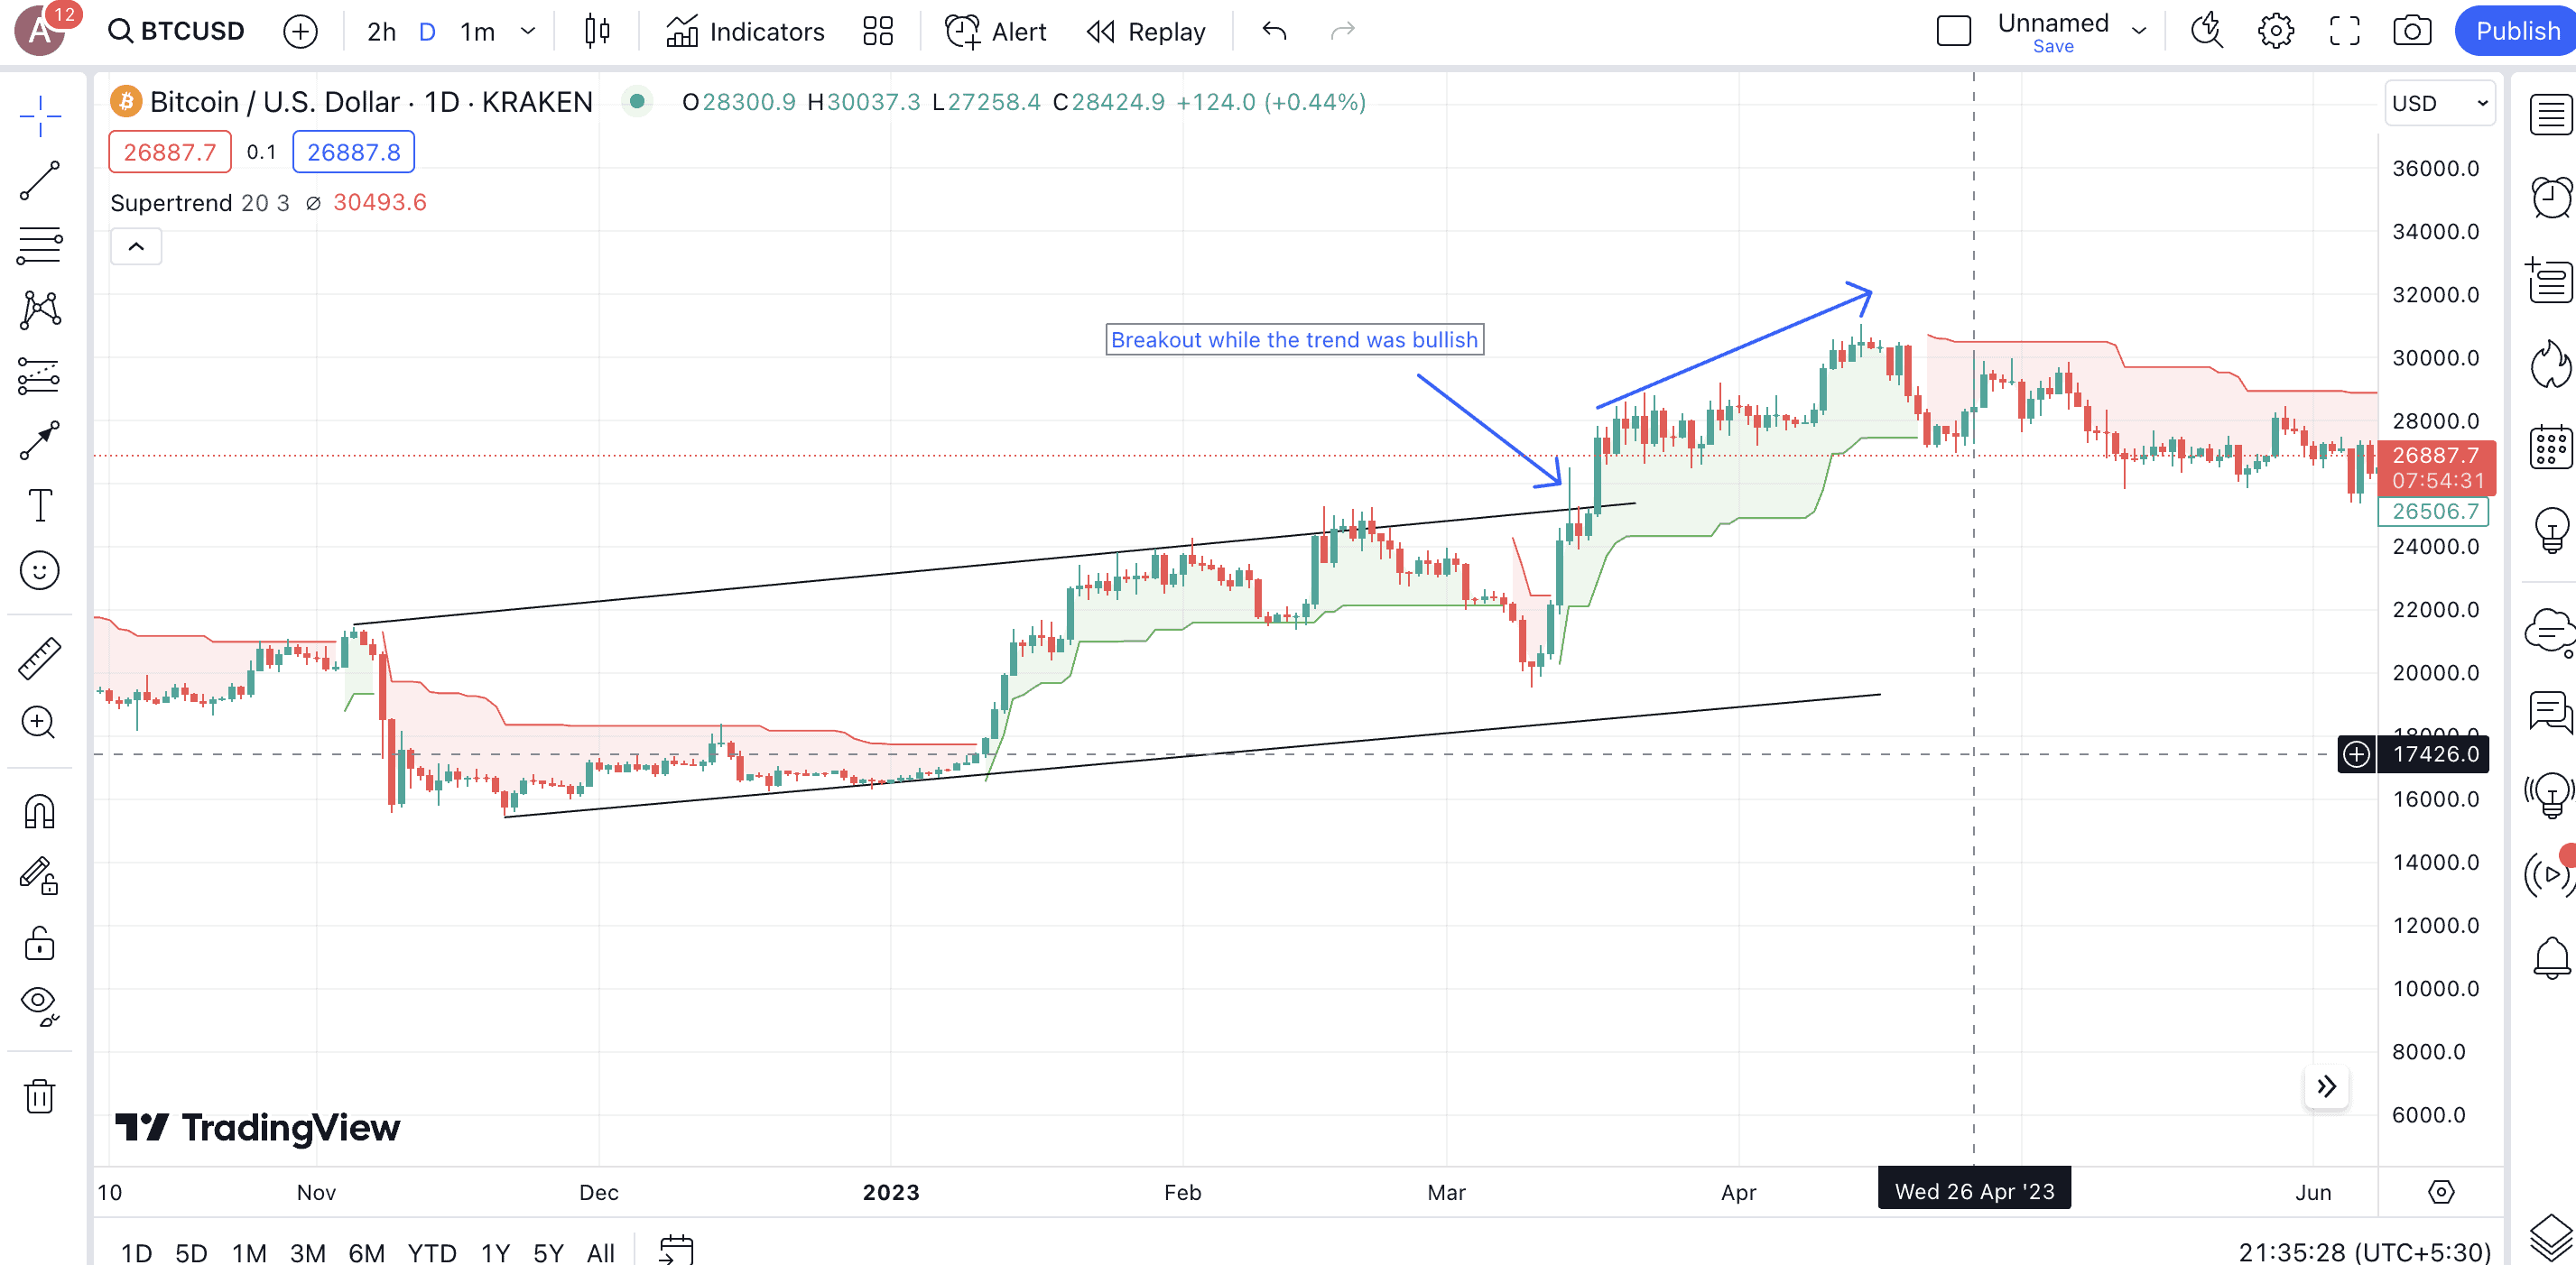
The inverse of this also works. Additionally, the concept of locating a breakout works even with standard support and resistance lines.
Head and shoulders is such a ridiculous trading pattern. Most tend to not work out, but it does not keep people from continuing to point them out.
Remember in early summer everyone was screaming H&S!!!
Head and shoulders should be left to the shampoo companies.
Benjamin Cowen, CEO and founder of ITC Crypto: Twitter
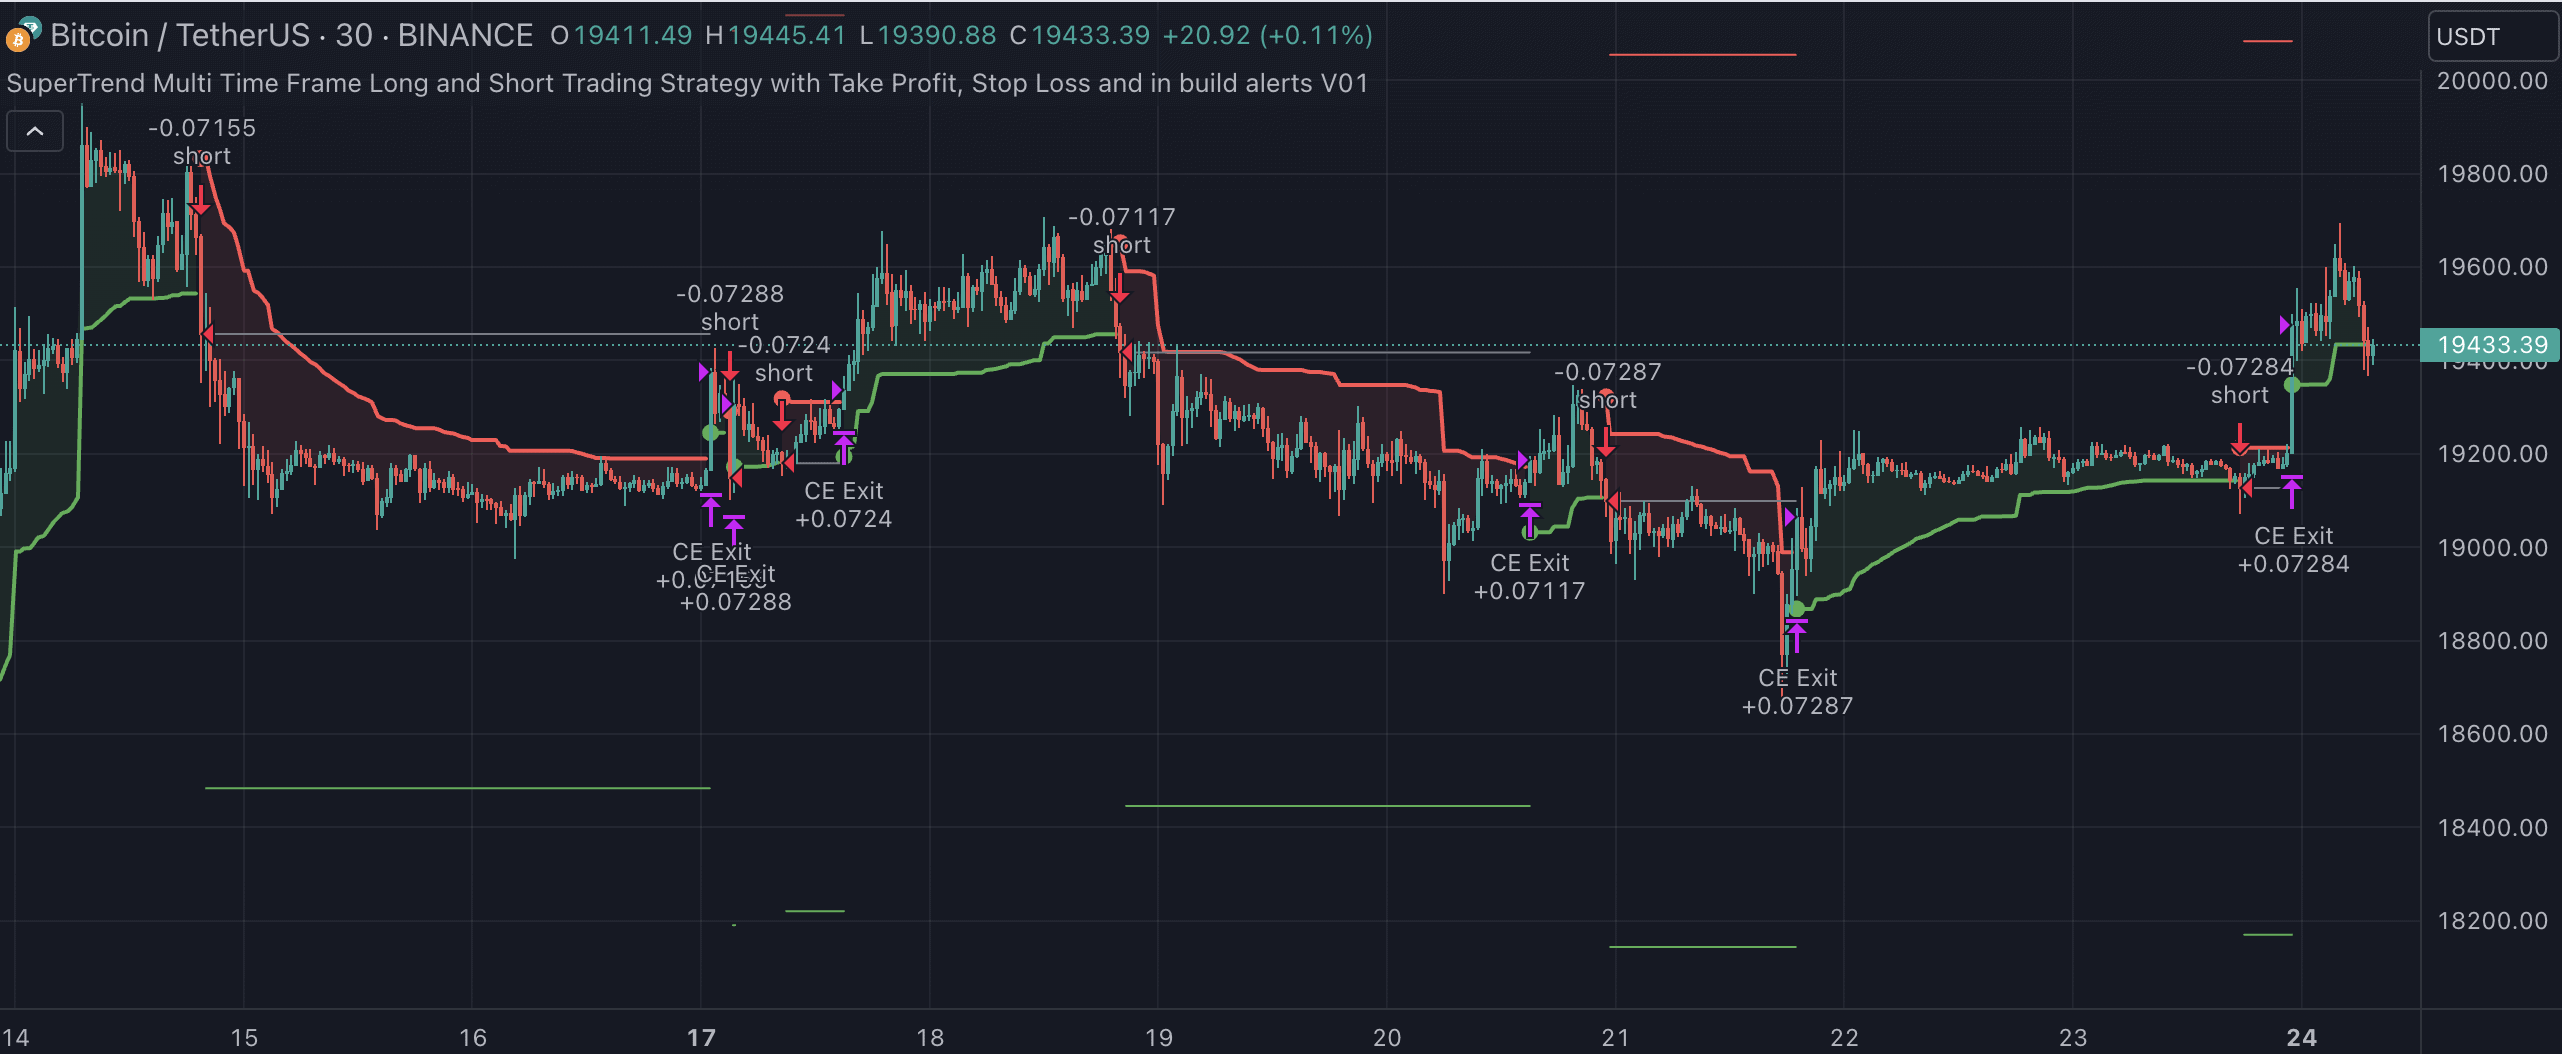
Multi time-frame strategy
This strategy requires you to work with multiple timeframes. Using this makes sense if you are risk-averse. To use this, you would need to work separately with multiple charts with multiple timeframes. You can use the same Supertrend setting for each timeframe and see if there is an alignment. For instance, if you plan to swing trade bitcoin, you can use a day and 4-hour charts to look for strong positive momentum.
Entering a trade makes sense if both 4-hour and day charts return strong bullish trading signals.
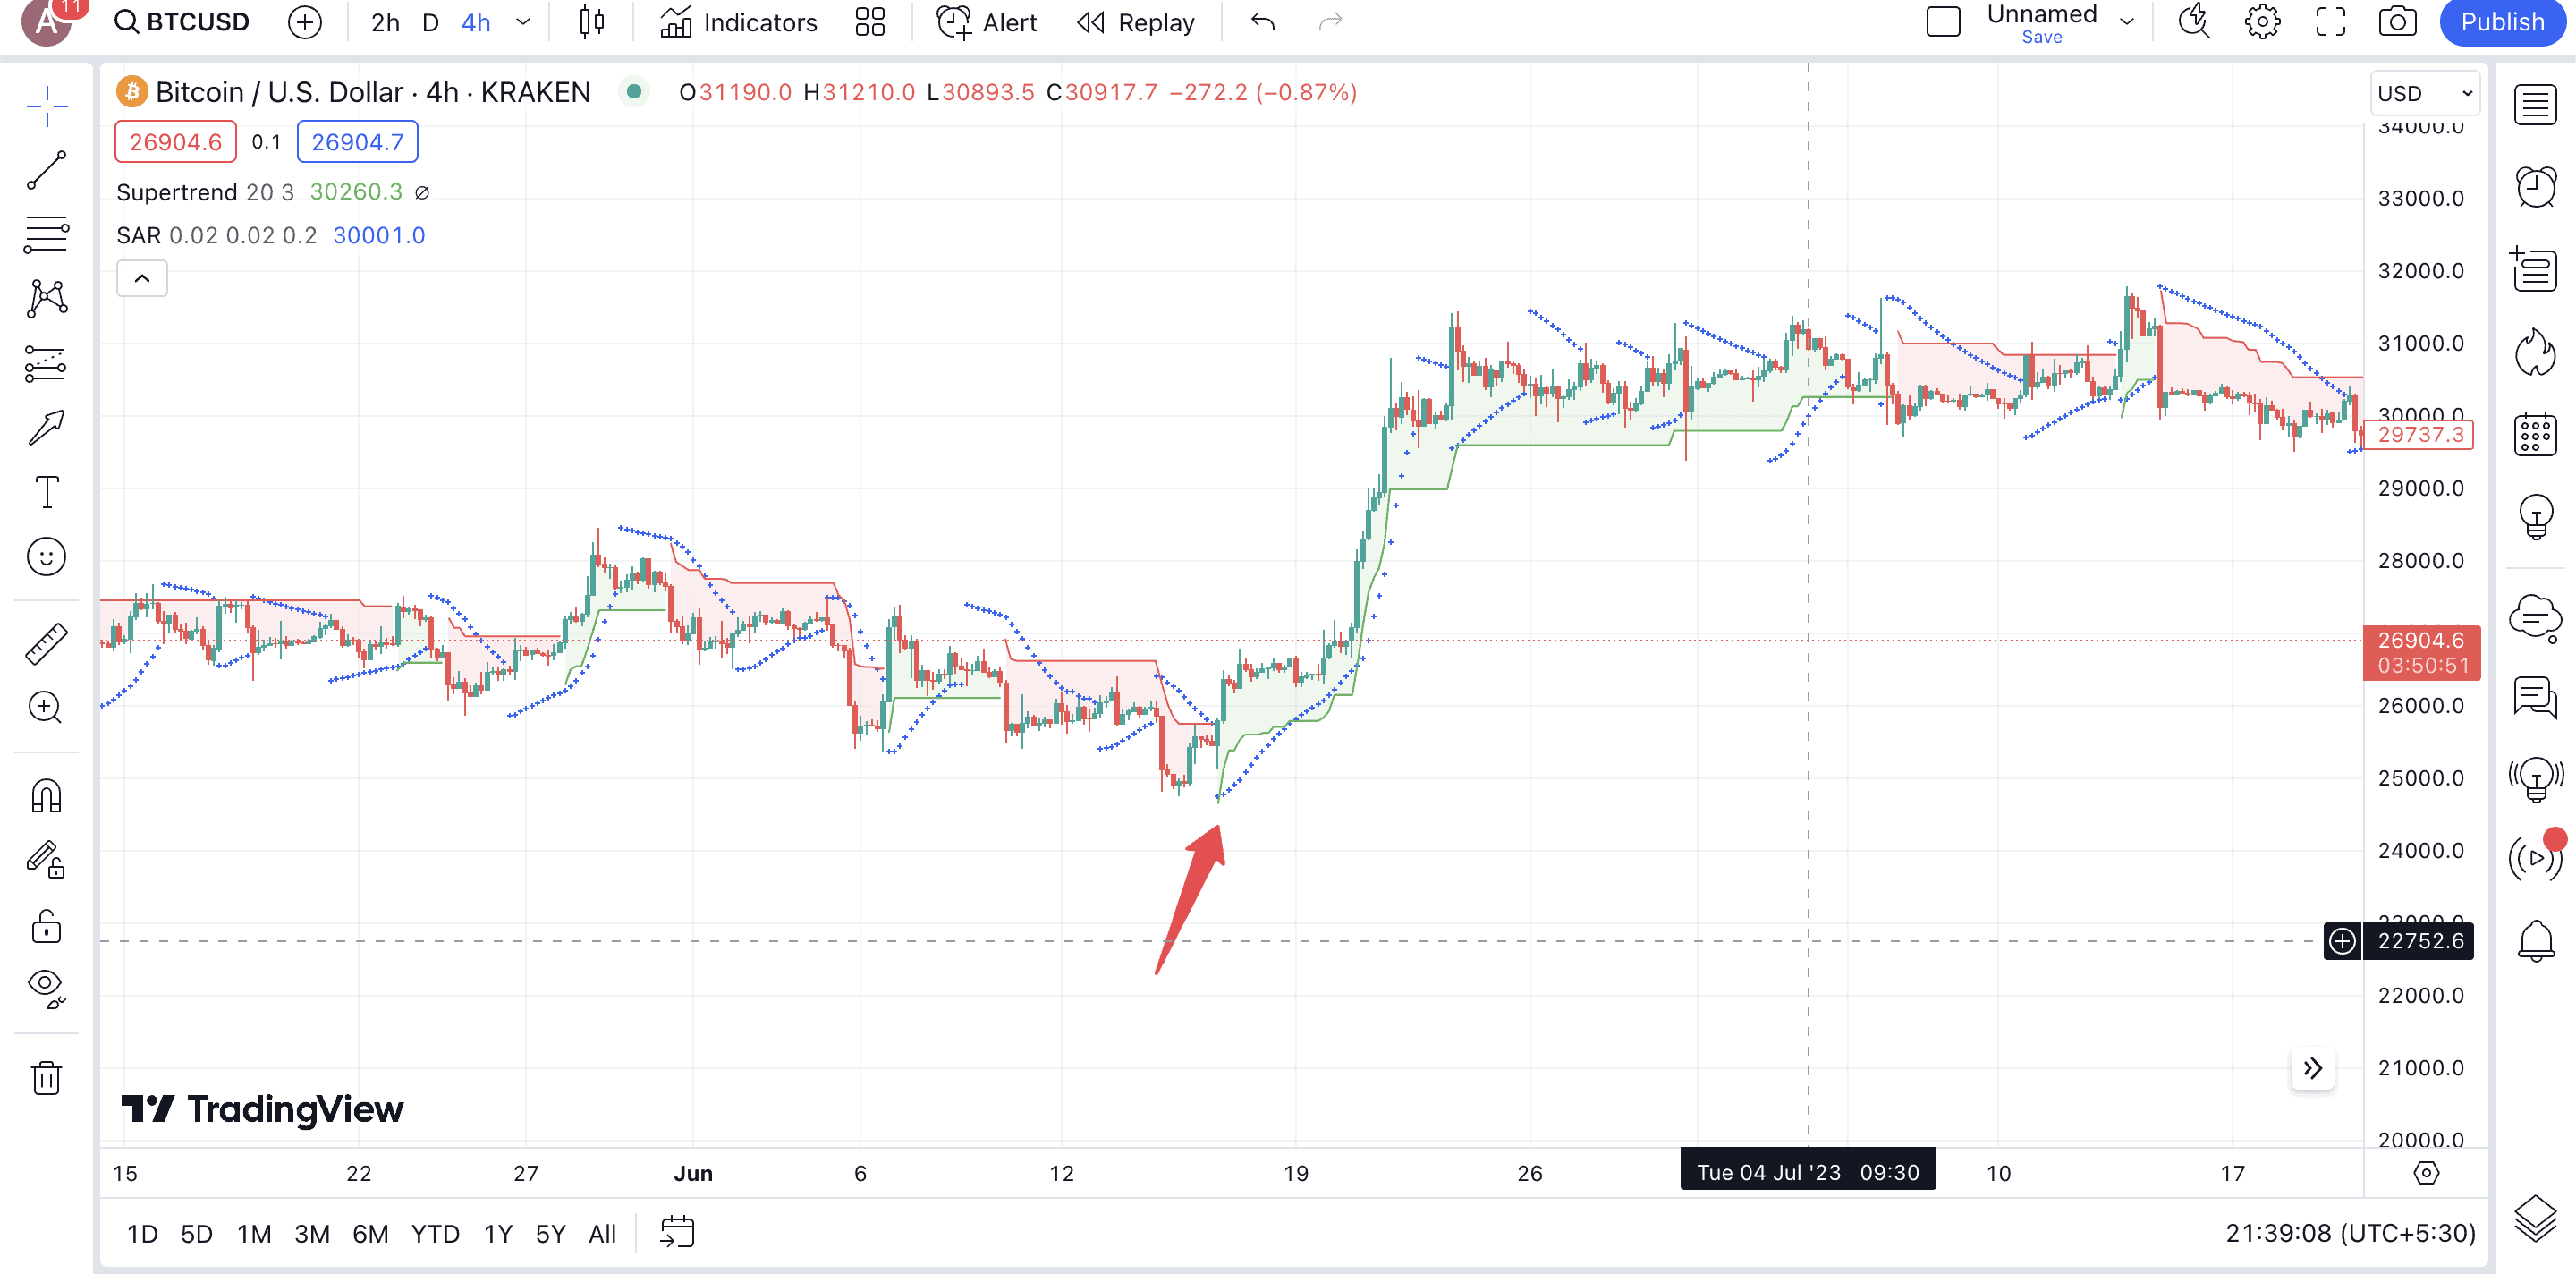
Supertrend and Parabolic SAR
The Parabolic SAR indicator comprises dots with a bullish set of points located under the price action for a bullish trend. Couple this with a green Supertrend line, and you might just be looking at a decent buying opportunity. To make the most of Parabolic SAR and Supertrend indicators for crypto trading, you are better off using them on 30-minute to 4-hour charts.
In addition to these strategies, the Supertrend Indicator also works well with Fibonacci retracement levels, where the best trading zone might show up after the Fib level retracements followed by a green Supertrend line. Also, for any of the strategies mentioned above, we can pair the Relative Strength Index (RSI) as an additional line of confirmation.
How do you use SuperTrend as a stop loss?
We discussed earlier how the Supertrend line can be used as a stop loss level for long and short trades. For a long trade, you can place a static stop loss immediately below the green line, and for a short trade, the same can surface immediately above the red line. However, that isn’t all you can do with this indicator.
When the price moves in a particular direction — upwards for a long trade — the Supertrend line keeps moving with it. Therefore, you can adjust your stop loss accordingly by using the moving Supertrend line as a trailing stop loss instrument. This approach allows you to lock in quick profits and safeguards you against potential reversals.
Here is a quick thread on the importance of risk management, among other things:
The Supertrend Indicator allows you to play around with the period and multiplier with a lower number, leading to tighter stop-loss levels. Therefore, playing around with the settings to balance sensitivity is also possible if you are trading only for quick profits or have a lower risk tolerance.
The ability to set up flexible stop loss levels makes it useful for grid trading, locating and trading arbitrage opportunities, and more.
Is the Supertrend indicator suitable for different crypto trading styles?
Even though the Supertrend indicator is useful for day trading, it can also work for intraday trades, scalping, or even longish swing trades. Changing the settings is a good way to go about the same. Another applaudable aspect of the Supertrend Indicator is its ability to support the following trading traits, making it an all-purpose indicator of sorts:
- Position sizing based on risk tolerance
- Ability to work with multiple indicators
- Supports backtesting
- Easy to understand sans complex settings
Is the Supertrend indicator profitable?
The profitability of the Supertrend Indicator regarding crypto trading depends on which additional indicators and technical analysis you use it with. Even though it is easy to read and meant for shorter timeframes, like any other indicator, even the Supertrend is fallible. Trading signals projected should be tested multiple times and taken with a grain of salt. Also, like any other trend-following indicator, the Supertrend works best in trending markets.


