


Technical Analysis and Fundamental Analysis are both terms that come up frequently in the world of cryptocurrency investing and trading. Technical Analysis (TA), however, is more the tool-set of day and swing traders, who look to increase profits with every move of the market. Still, the rules that govern TA can be a bit confusing at first, so we’ve compiled a helpful beginner’s guide to try and make sense of charts, trends, reversals, indicators and more.
While there’s way too much to cover for just one article, here we will lay out some of the most common and generally useful tools that are used by Technical Analysts in both cryptocurrency as well as traditional markets. In fact, because TA is really more of a measure of the psychology behind the system, it can pretty much be applied to anything that has sufficient historical market data. This data is generally represented by a chart, and this makes a great place to start digging in.
The Chart
Most people reading this have at least seen a market chart before, but it can be important to familiarize yourself with the most important aspects. Not all charts will look the same, but some elements that should always be present include (1) the asset symbol and time frame, (2) a tab for indicators, (3) price and date axes, and (4) a toolbar.
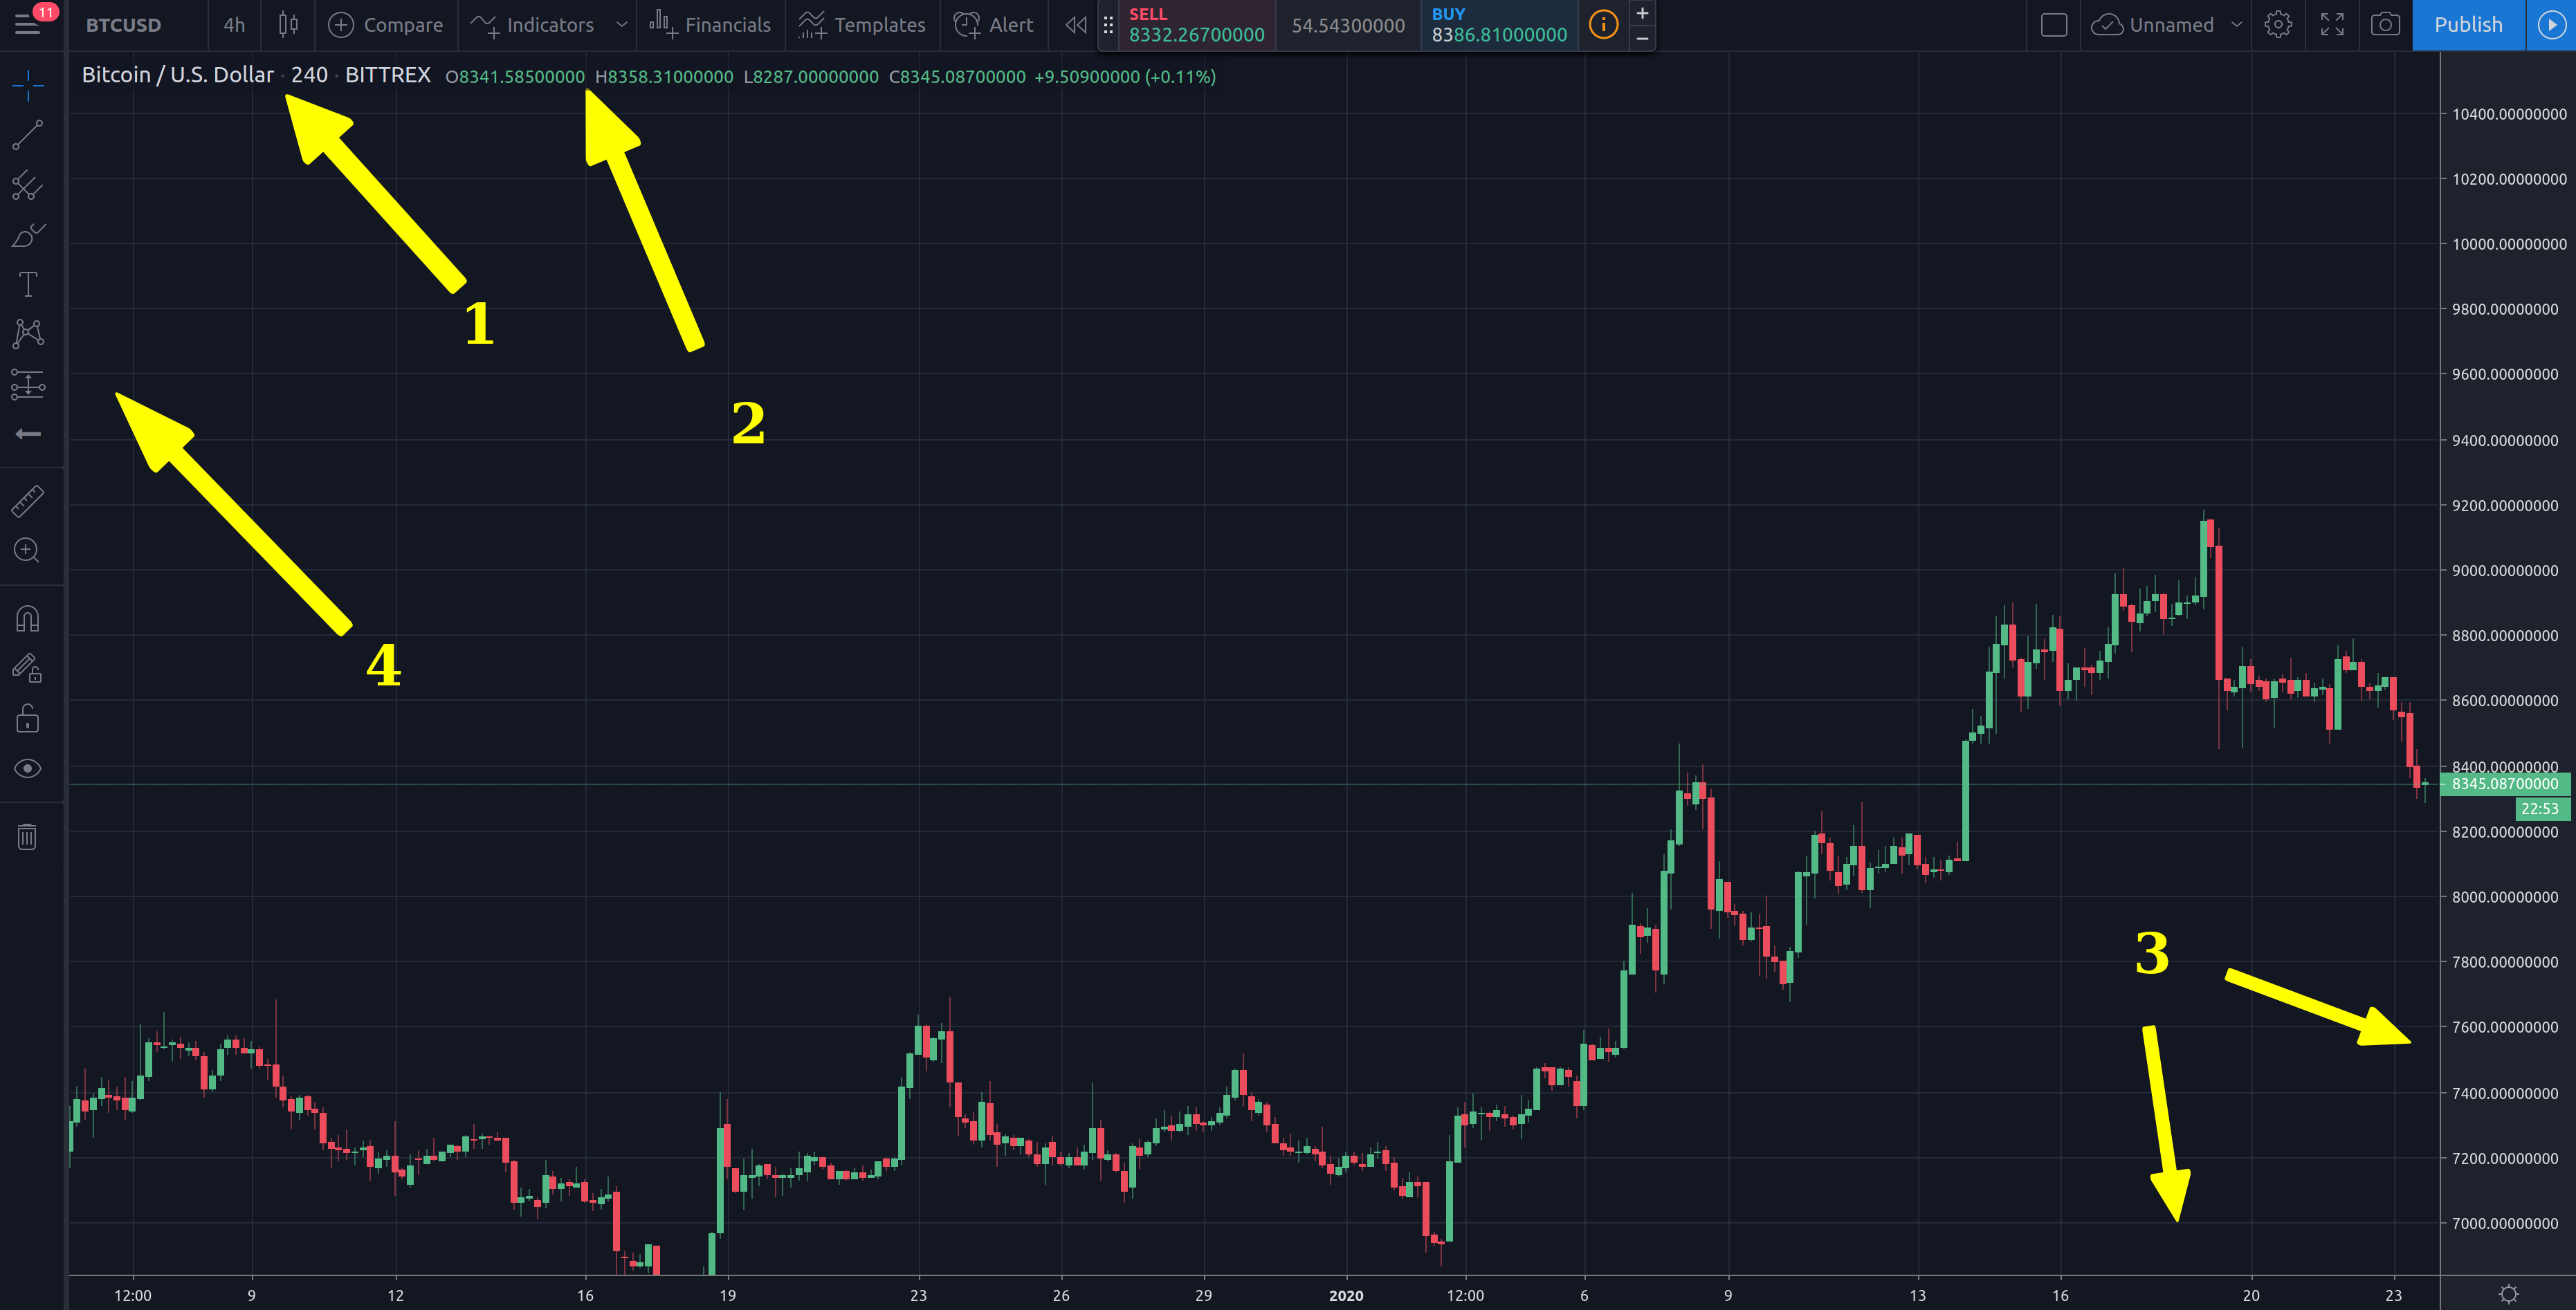
While these elements should be pretty straightforward, it is important for you to know where they are and how they work. The asset symbol is simply the shorthand for whatever market is being represented, so BTC for Bitcoin, ETH for Ethereum, GOOG for Alphabet Inc. stock, and so on. The time frame is what unit of time the chart is broken into. For example, 1 Day would mean each bar represents a single day, and by changing timescales a trader can get higher or lower resolution on price action, which can reveal different patterns.
Next we have the indicators tab, which we will go more deeply into below, but indicators are basically algorithms which display market data in different ways to try and find more information on trends. On the right and bottom (usually) you should find the price and date axes, respectively, which should be self explanatory. Last there should be some form of toolbar. The toolbar basically has a variety of line, drawing, labeling and overlay tools that can help traders clearly mark/measure trends. This not only helps an individual keep their analysis straight but can be essential in sharing charts with others, to make it easy to communicate what you are observing in the price action.
While these are some of the basic elements, most charts will have a host of settings and other features which you should familiarize yourself with to get the most out of your chosen platform. All of this is of course irrelevant if we don’t clarify what it is these tools are trying to help us find, and the answer is trends.
Trends
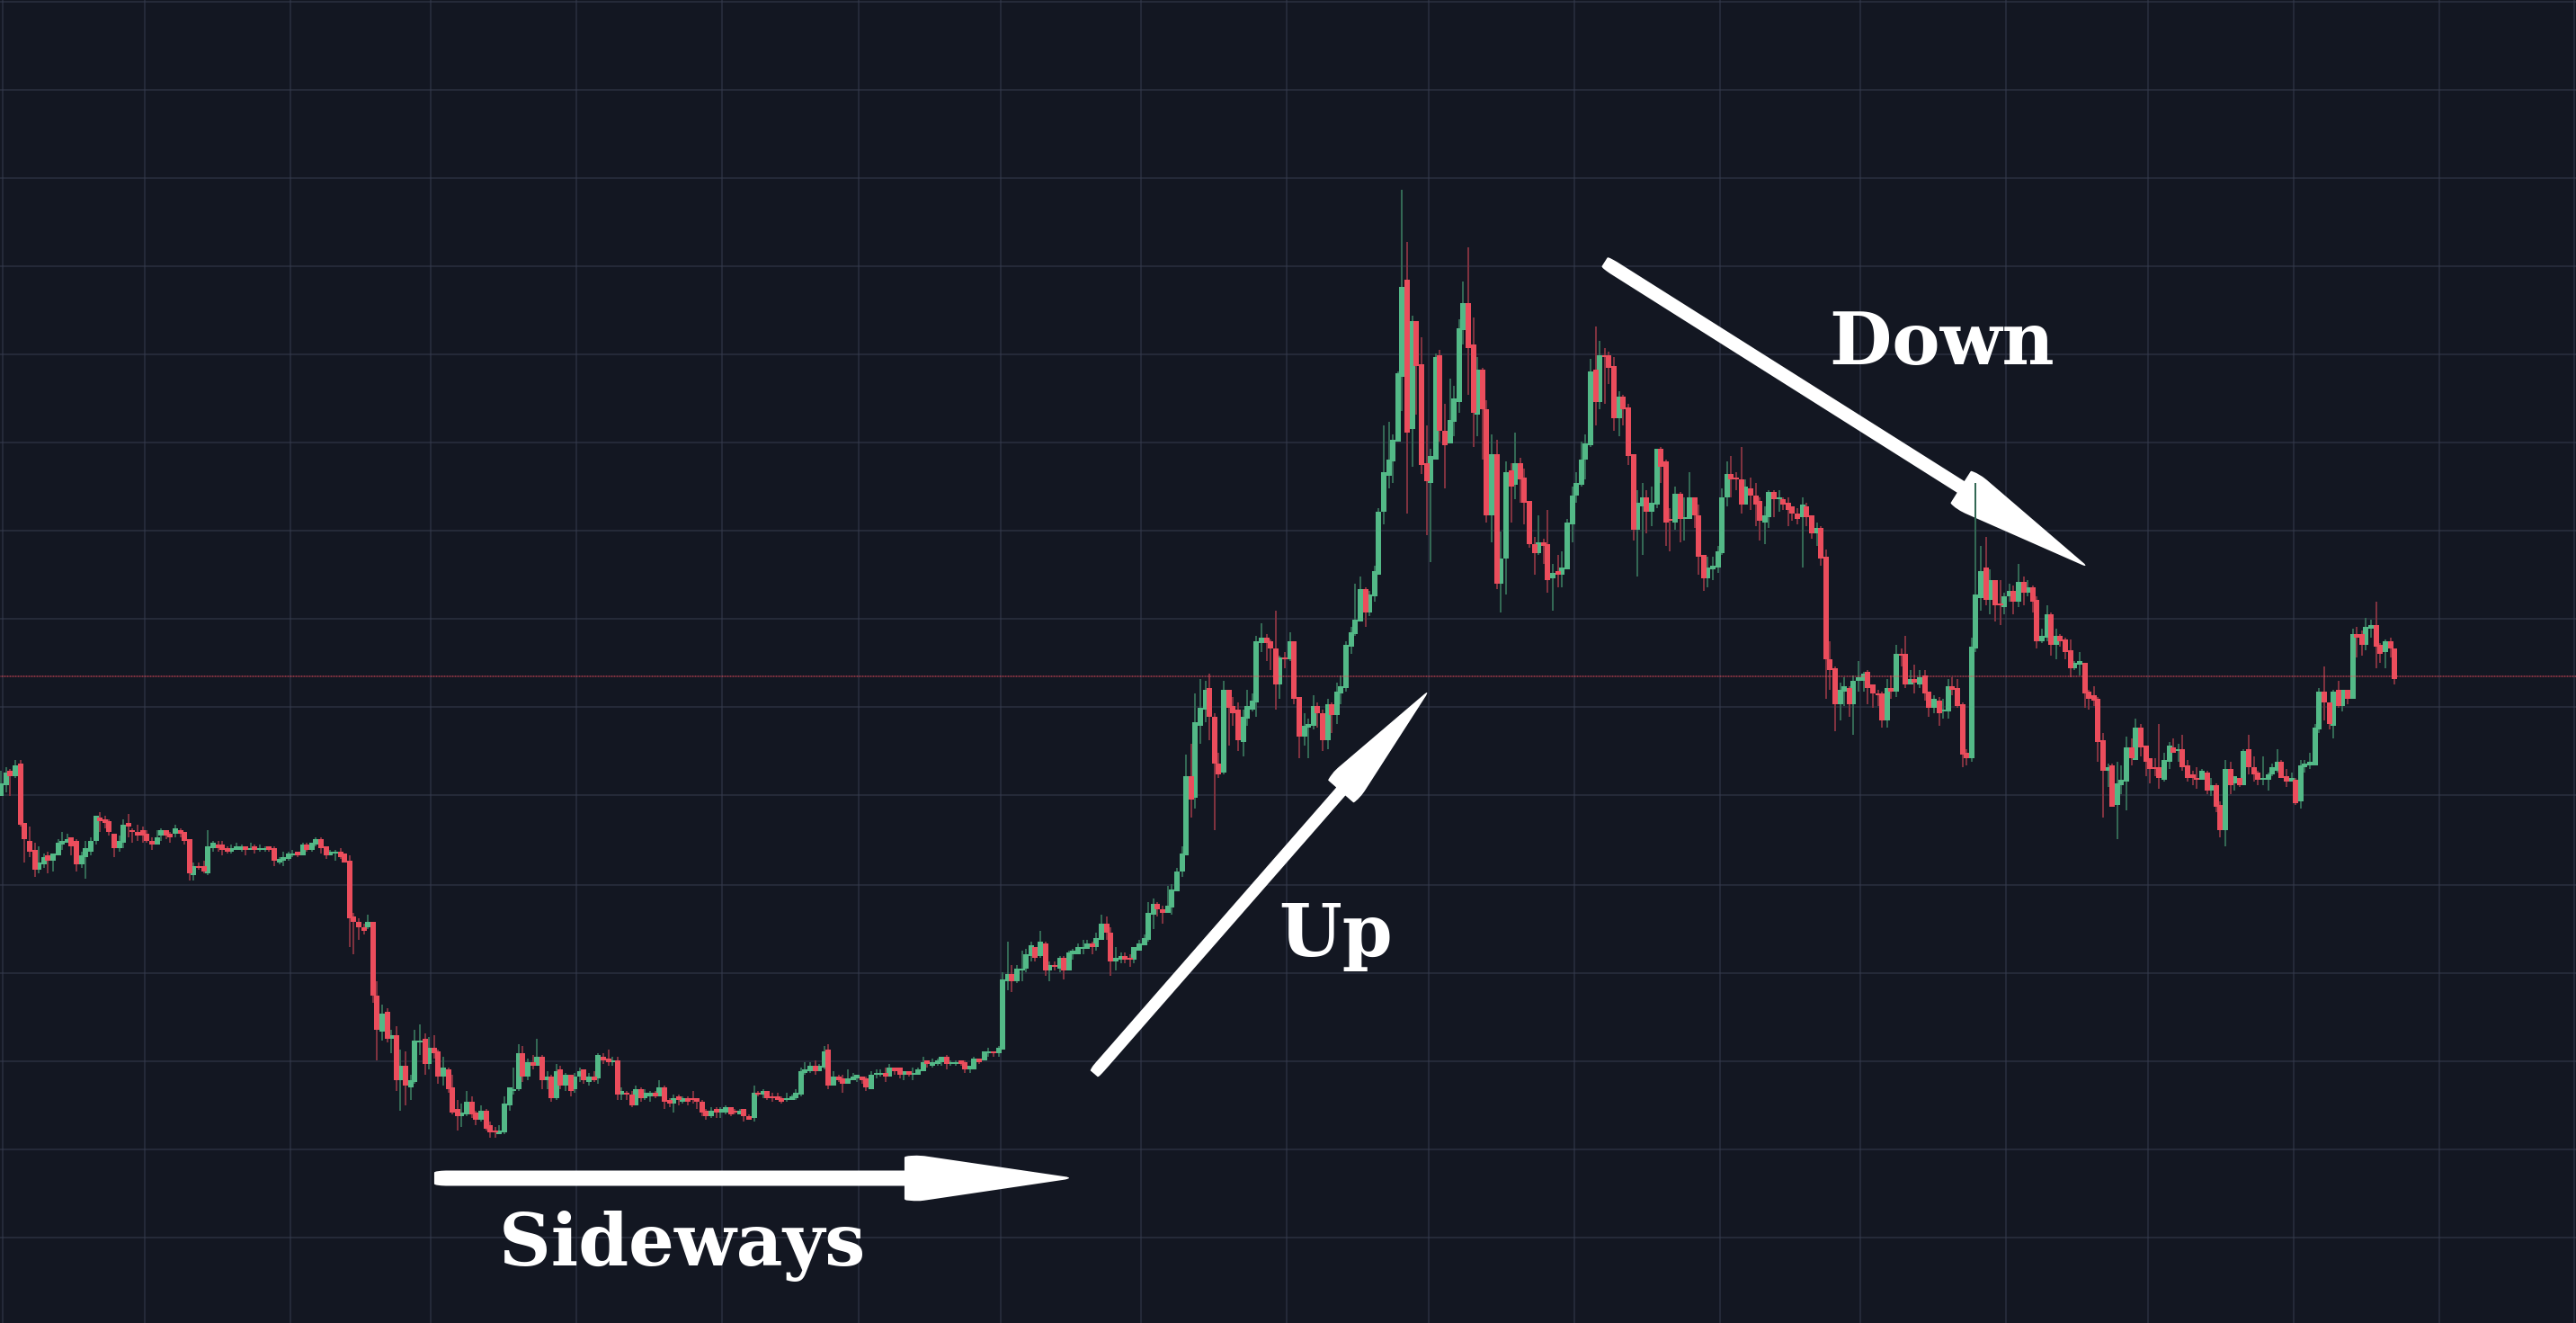
Spotting trends is the main point of TA, both realizing when they are happening and trying to look for signs when they will change. Trends can last anywhere from minutes to years and often switching to multiple time frames is important for getting a good feel for what is really happening in the market. In essence there are really only three types of trends: Up, Down and Sideways. The names should make it pretty obvious how the price action should be moving for each, but again it can be the time frames that trip people up.
It is often said that if you don’t like the Bitcoin chart, just zoom out. This is because if you look on a long enough time frame, Bitcoin has only ever been in a rising trend. Zoom in to the last 2 years however, and you may not think it looks like such a hot asset. It is important to know what trends are forming not just on the hourly and daily time frames, but the weekly and monthly as well. Remember that no trend goes on forever, hence another important saying in TA, “a trend is a trend, until it’s not.” Being able to spot a change in trend is pretty much what Technical Analysts are hoping for. To that end there is no absolute indication that something is about to change, you’re only ever really playing the odds. Think of it like weather forecasting, it’s more in terms of the chance that something will happen than absolute predictions.
Reversal Patterns
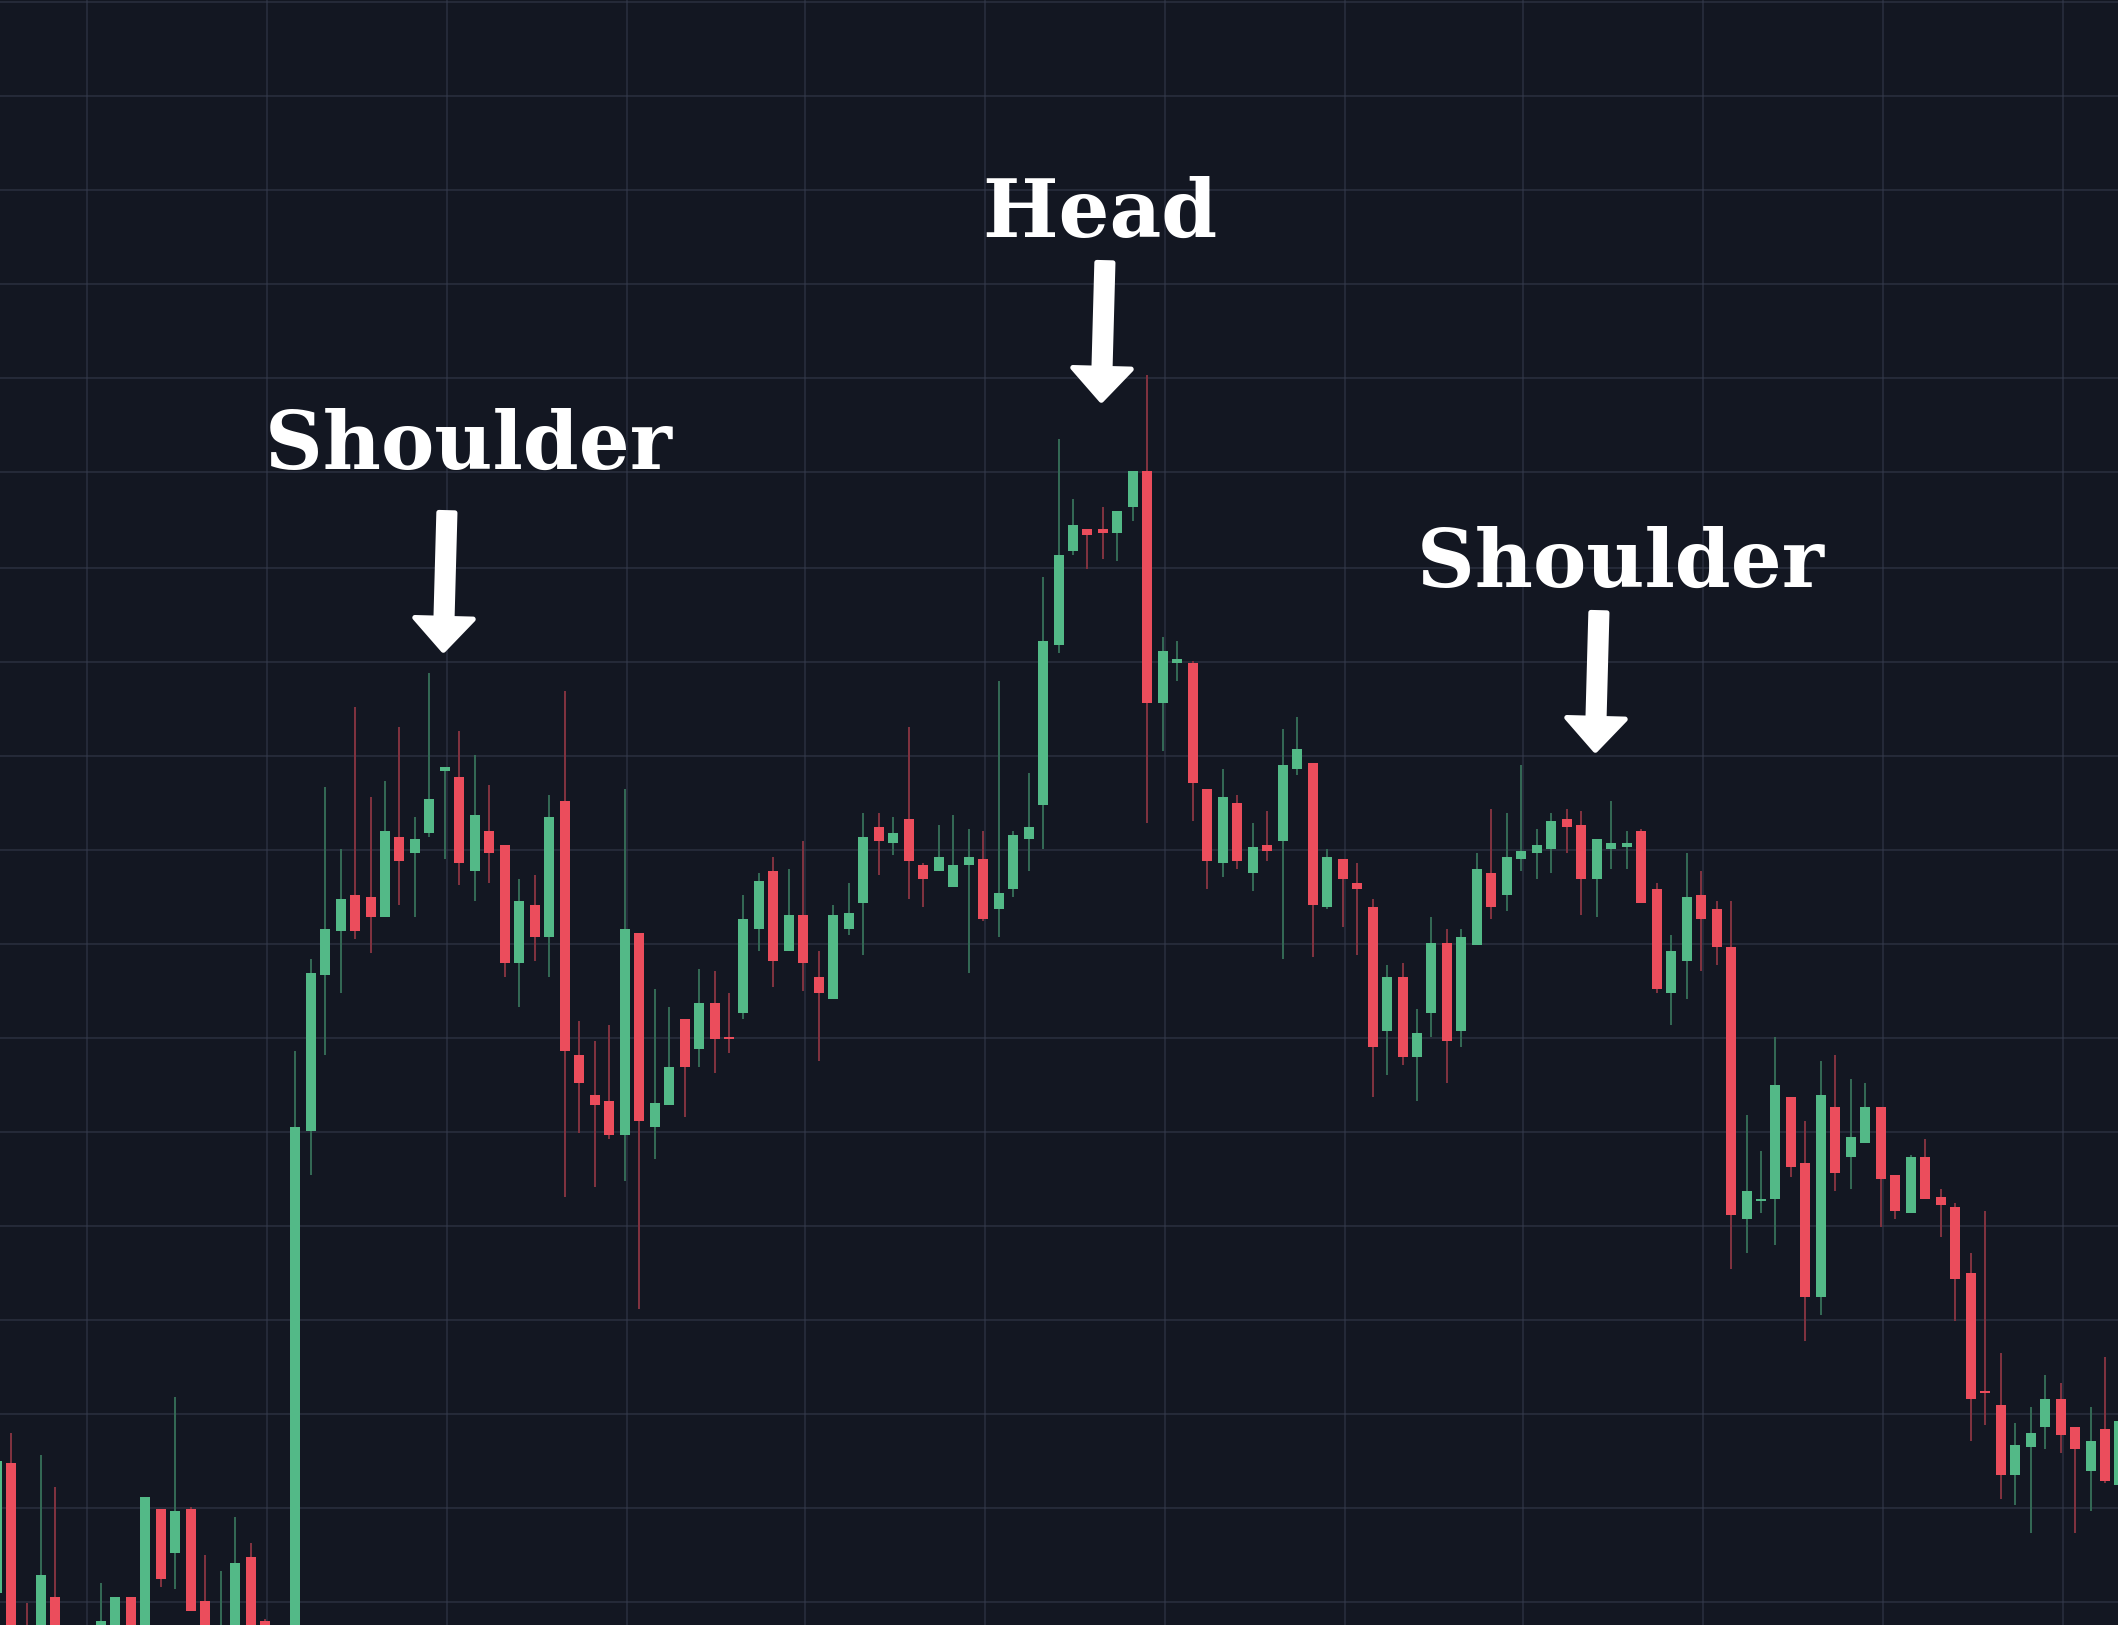
Being able to see when a trend is about to change can be key for traders, so they look to patterns that often precede a shift in market momentum. One common pattern that many analysts watch for is called a “head and shoulders” pattern. This can happen after either an ascending or descending trend, and frequently signals the end of the price movement in that direction. The name comes from the fact that this pattern consists of three tests into a price level, with usually the first and third attempts being more modest than the second, forming a shape reminiscent of the title. Not all examples look particularly “neat,” but the following image is roughly what you would see forming. Note again that this pattern could form upside down after a downtrend, hinting the price may be about to rise.
There are many more reversal patterns, and not all users agree on the most consistent, but this isn’t the only way to get insight into the market. Another major tool set traders turn to are indicators.
Indicators Explored
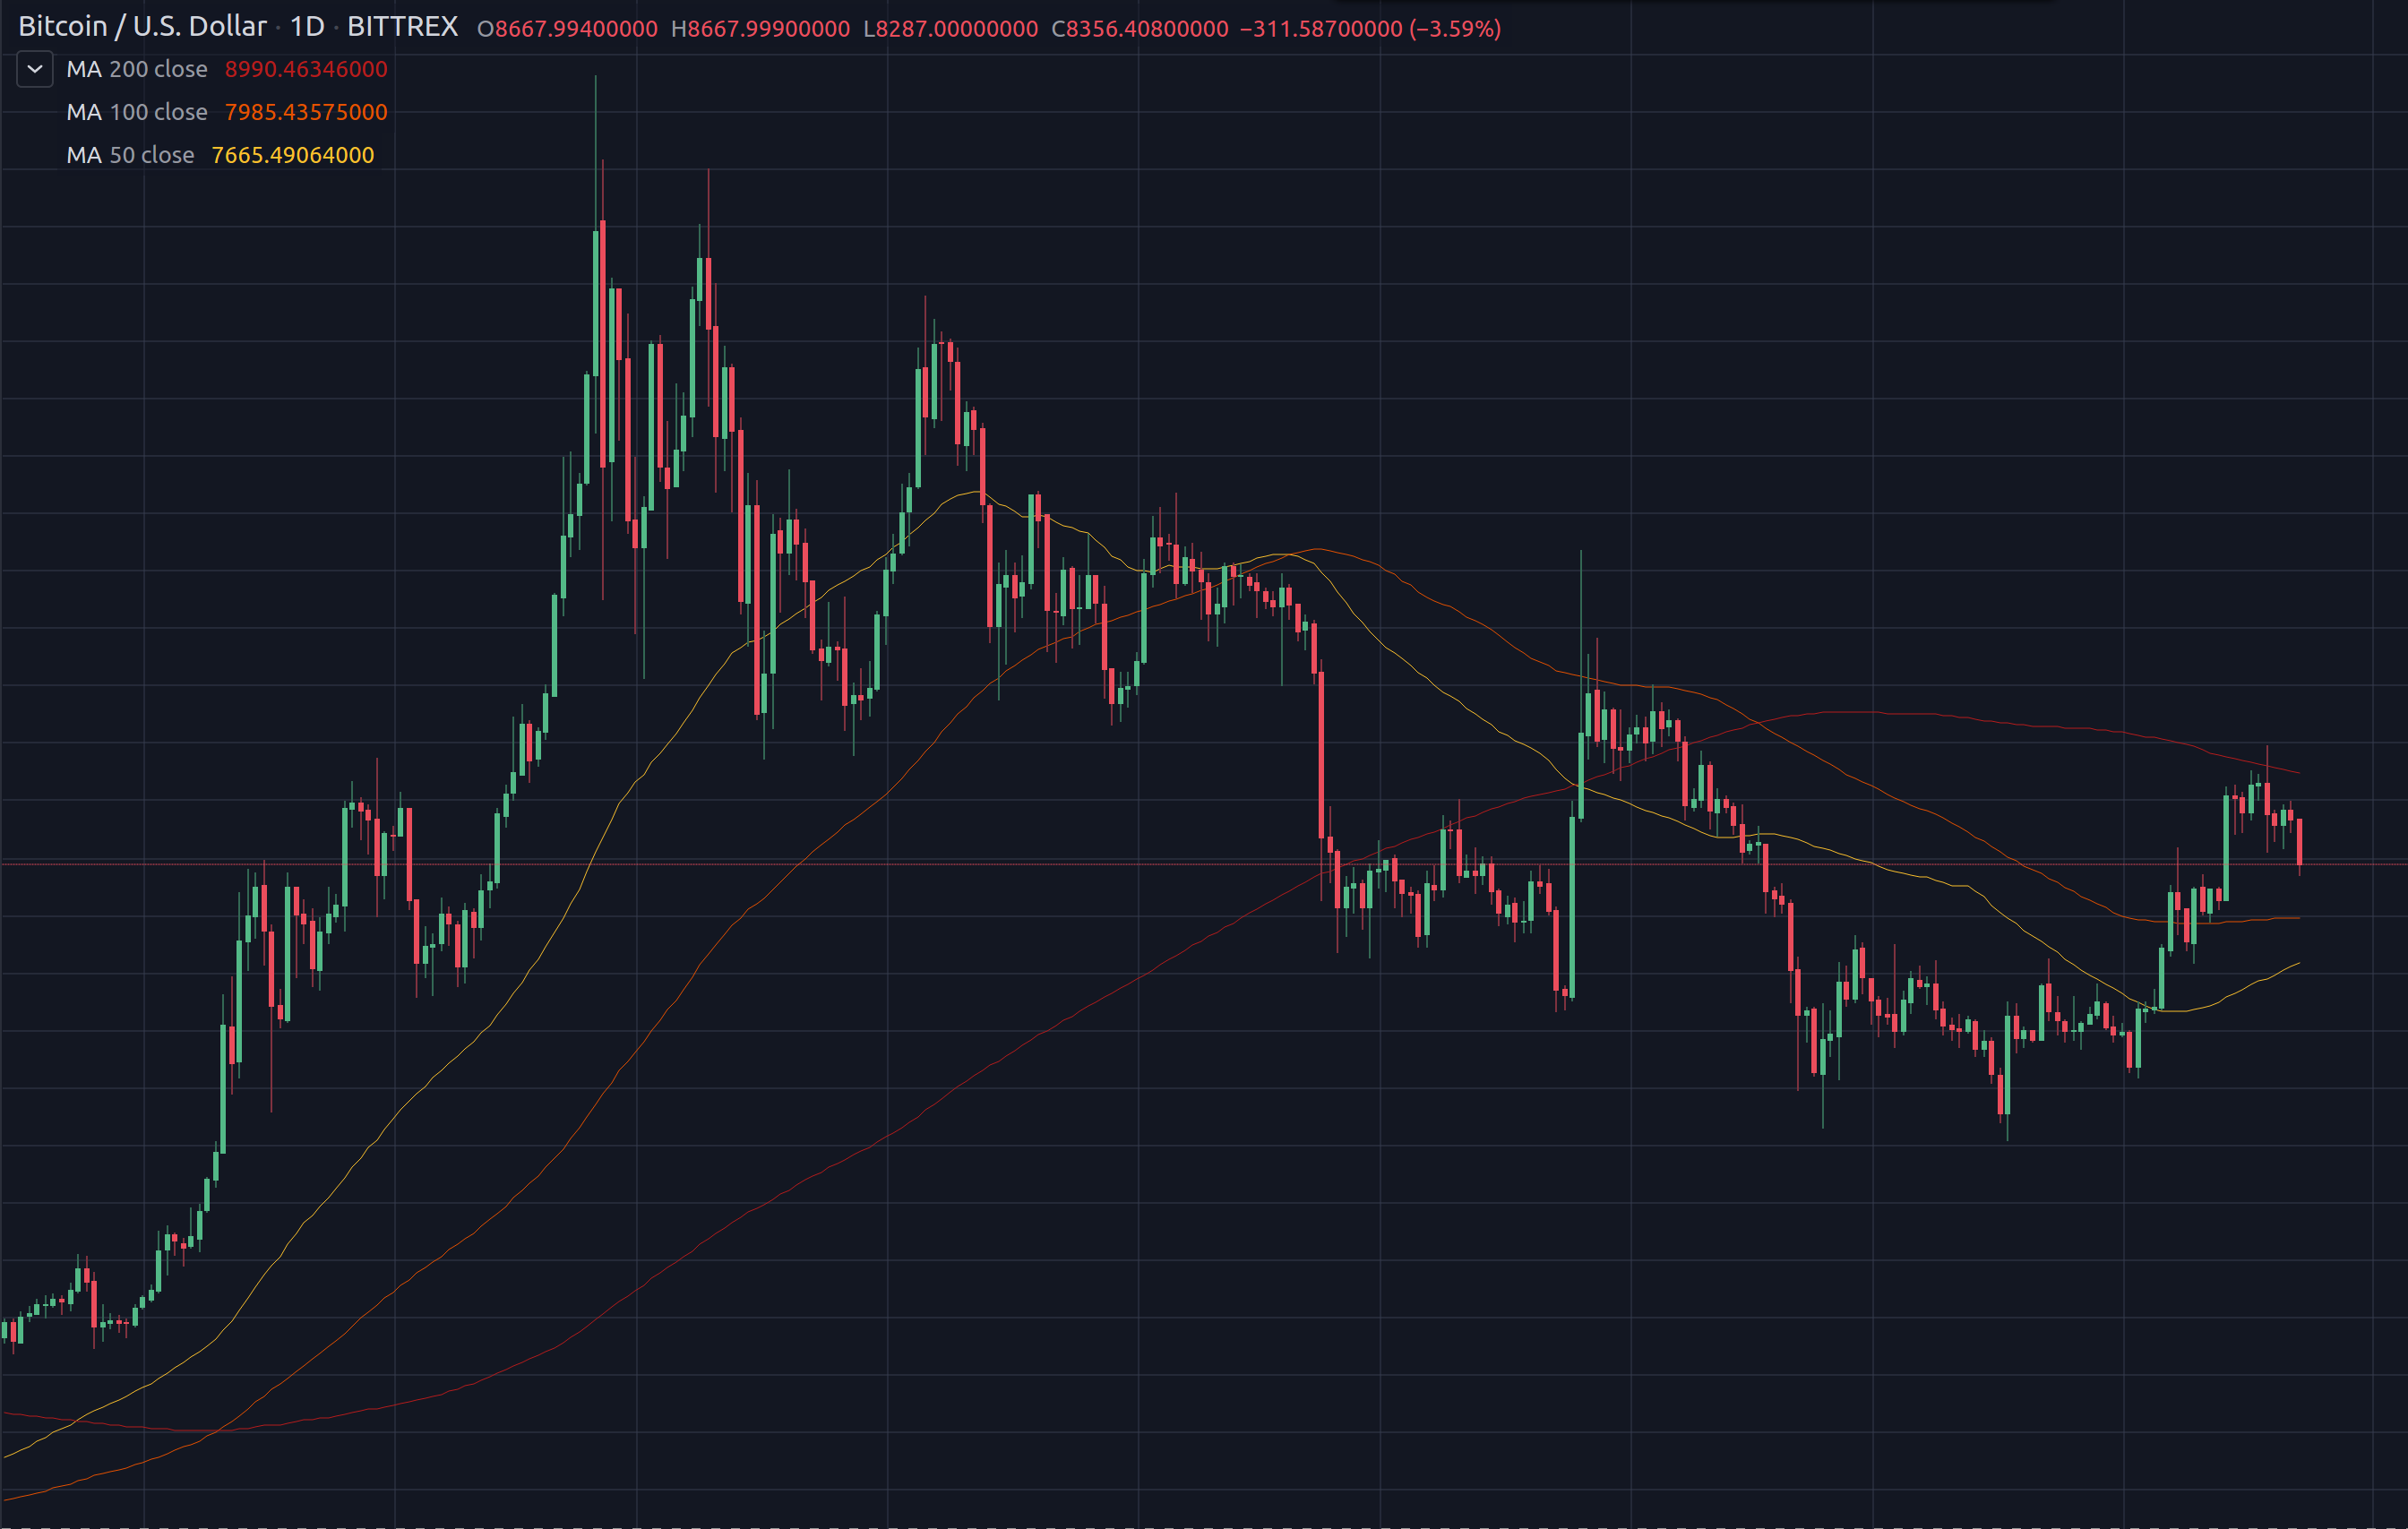
As mentioned, indicators take market data and run it through various algorithms to output that information in a new way, which often can reveal useful insight into trends. One common example is Moving Average (MA), which takes price action over X amount of previous days and averages it to create a line on the chart. These lines then often define areas where traders expect to find support or resistance. For example on the daily time frame it is common for people to use 50, 100, and 200 MAs as boundaries to watch for shifts in trends. Generally moving above an MA is bullish while dropping below is bearish, with added weight being given to crossovers on longer time frames. Know that there are in fact many different variations on MAs used by different traders, that serve unique strategies, but these are for a later time.
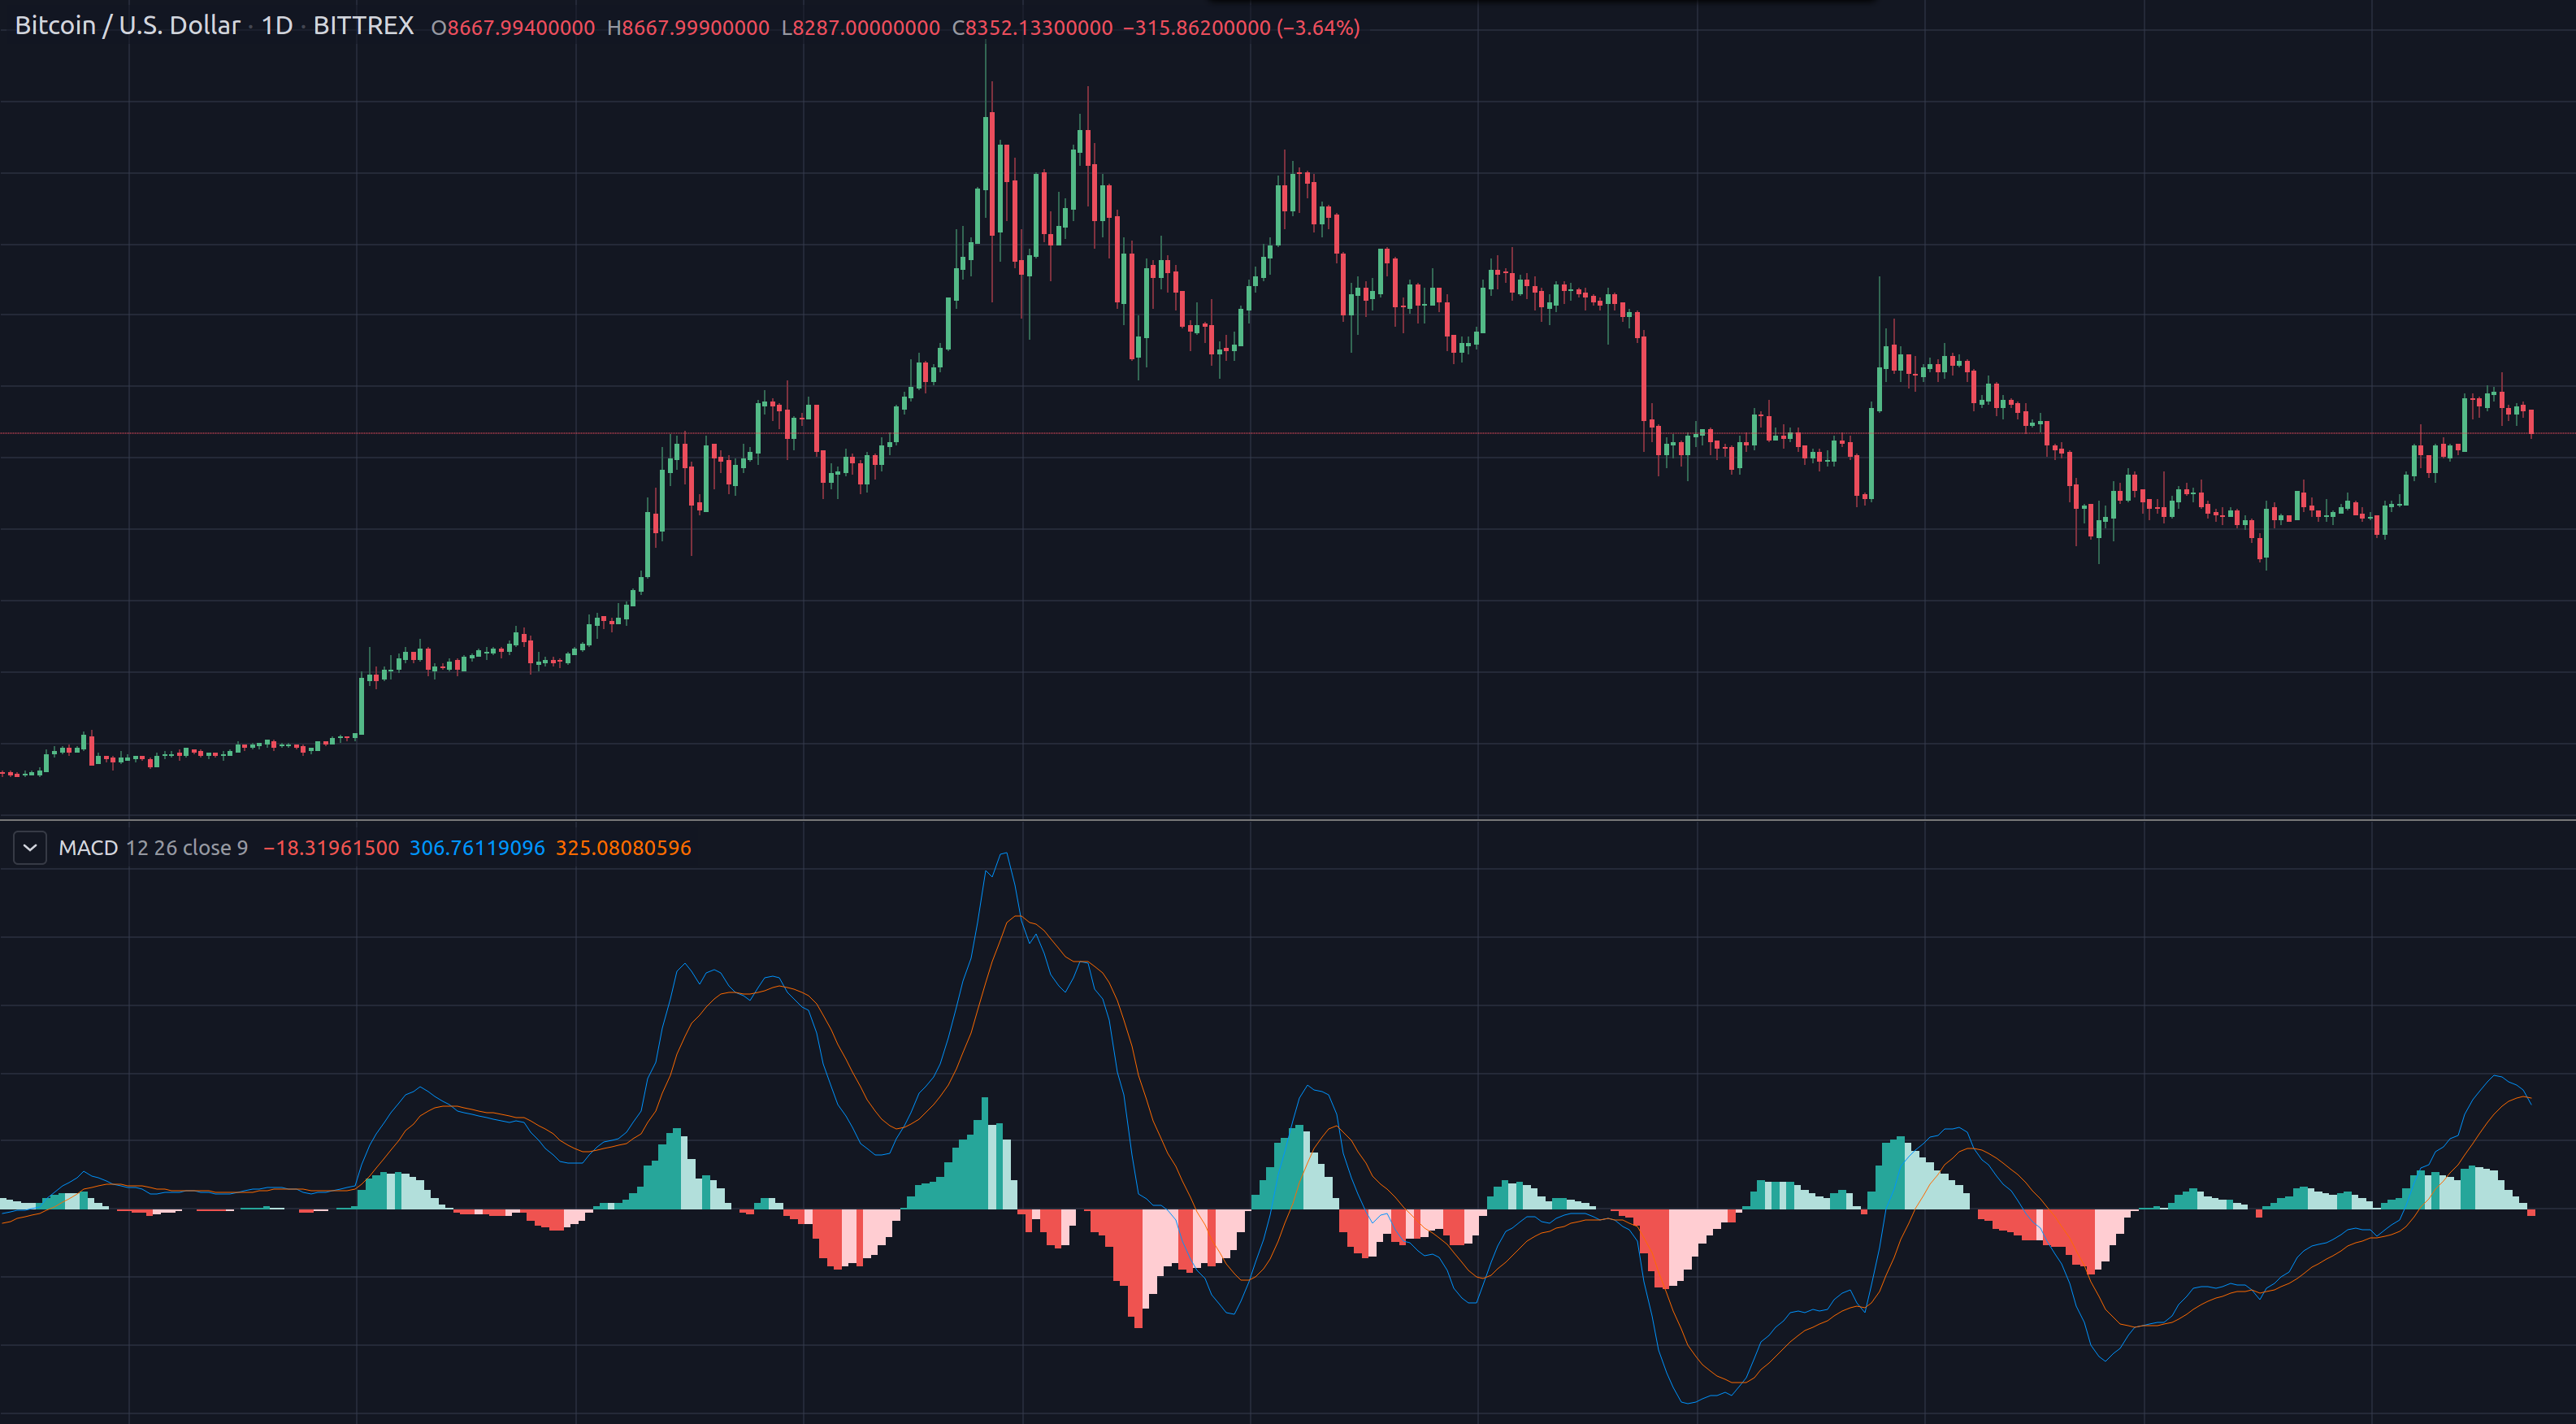
Another common indicator is the MACD, short for Moving Average Convergence Divergence, and is useful for confirming trends as well as giving evidence for reversals. Basically this algorithm takes multiple Moving Averages to show divergence in recent market momentum. Typically a MACD indicator will have a blue line and a red line (though colors may vary) as well as bars which represent the distance between these lines. Bull trends should see the blue line holding above the red, while bear trends would follow just the opposite. Traders are generally watching for crossovers, where the lines pass over each other, often an indication that a trend is shifting. Similarly, if the lines get sufficiently divergent from each other it could indicate that a market is overbought or oversold. Lastly, the MACD can also give confirmation to an ongoing trend, if the lines should attempt to crossover but instead “bounce” off of each other.
These are just two common indicators, but there are many more. Relative Strength Index and Bollinger Bands, for example, are a couple of other tools often used to give evidence to what a trend may do next. That being said, it is important to emphasize again that there is no indicator that gives 100% confirmation of what is about to happen. Generally, strategies are worked out first and indicators give information that will either support a working strategy or reveal a flaw in a failing one. By using multiple indicators a trader can at least gain confidence in their view of how the market is moving.
Conclusion
These are just the basic elements that a new trader will need to learn if they are going to find any success moving forward. While not everything presented here will align with every platform, the basic building blocks should be represented in any major trading system. There is still a lot to learn that goes notably deeper, but many traders do prefer to keep it simple with just a few indicators and some trend-lines. At the end of the day, once one has learned the ins and outs of these systems, they are free to use whichever combination of tools works best for their strategies.


