


As a trader or investor looking to navigate the volatile world of high-beta assets like stocks and cryptocurrency, looking for reliable trading strategies is common. Although there are many reliable ones in technical analysis, like the Relative Strength Index (RSI) strategy or the Bollinger Bands strategy, today, here we focus on the golden cross — a rather straightforward strategy to analyze the market. A golden cross involves the crossing of two moving averages in a bullish way. And it’s simple, works well with other indicators, and can give reliable long-term insights.
But that’s not all. Golden cross isn’t just an isolated trading strategy. It underpins several other trading and investing strategies, depending on your skill sets and understanding of the market. This guide explores the world of golden crossover strategies — looking at the five best options to amplify your trading experience. We shall also see how well a golden cross strategy can pair with other indicators.
Unpacking the golden cross
A golden cross or golden crossover is a moving average crossover strategy where you can see a short or small interval moving average line crossing above the long-term or long-interval line. Imagine a 50-day moving average line crossing above the 200-day moving average line. That is a classic example of a golden crossover.
It is a bullish chart pattern that hints at the onset of a bull market. Yet, like any other chart pattern, it might fail and should be taken entirely at face value. Therefore, it is advisable to keep emotions out of trading.
“The influence on stock prices are so numerous and so complex that no person has ever been able to predict the trend of stock prices with consistent success.”
John Templeton, a mutual fund pioneer: from The Templeton Touch: The Art of Global Investing
As mentioned earlier, a golden cross strategy is a bullish signal, as a short-term MA crossing above a long-term MA signals a positive momentum corresponding to the price trend.
However, there are a few more things that you should know about a golden cross strategy. A golden crossover is a lagging indicator as its moving averages rely on historical data. Also, as a pattern, a golden crossover formation hints at a trend reversal as a short-term moving average crossing above a long-term moving average signals a positive change in momentum. And a momentum change is typically the secret sauce for a “trend reversal.”
Experienced traders use a golden crossover formation to enter an asset or increase their holdings. This happens in anticipation of an aggressive price rise. Also, a golden crossover strategy holds in every kind of market — stocks, commodities, cryptocurrency, and core. Additionally, you also use this pattern for options trading.
Also, the inverse of a golden cross is a death cross — a phenomenon where the short-term moving average crosses under the long-term moving average — triggering a dip.
How accurate is the golden cross?
To understand the accuracy of a golden cross, it is important to identify the ideology behind the strategy We know that a golden crossover is identified with a short-term MA crossing above the long-term MA.
Notably, a short-term or, say, a 50-day moving average is more reactive to recent price changes, and crossing above a long-term or 200-day MA shows that the recent view of the market is skewing bullish. This ideology-based positioning of a golden crossover makes it one of the more accurate patterns or trading strategies around. And if you read deeper into this ideology, another interesting aspect surfaces. With the short-term moving average picking pace, a golden crossover can also be associated with increased buying pressure.
As golden crossover is a lagging indicator and highly biased towards momentum shift, it is advisable to always consider the trading volume. Another aspect of the golden crossover is that as it is also a short-term moving average-led strategy, buoyant price surges and sentiments might have an impact.
That is another reason why you need to pair other indicators with the pattern.
Which moving average pairs to consider?
Even though we know how a golden crossover is formed and how it is interpreted, an important question remains to be answered. Which moving average pair should you use?
For starters, 50-day and 200-day moving averages are regarded as standard parameters for a golden crossing. 50-day MA offers an accurate representation of a short-term trend, whereas the 200-day MA offers an accurate reflection of the asset’s long-term perspective. And those are the reasons why they are termed the standard choices.
Did you know? Traders who indulge in scalping — quick trades that use short-term price volatility — prefer using 5-period EMA and 13-period EMA lines to determine bullish crossovers. These ultra-short-term moving averages react quickly to rapid price changes.
However, according to your trading preferences, you can even use 20-day, 100-day, 150-day, or any other moving average timeframe. For instance, if you want a perspective that’s skewed toward the long-term, 100-day and 200-day moving averages can be used. You can use the 20-day and 50-day moving averages for very short-term trading or swing trading. It all depends on the market scenario and how traders have been backtesting their strategies.
Note: You can use any other timeframe apart from the “day” for identifying a golden crossover. For instance, if you are trading using the 4-hour chart, the interpretation changes from 20-day, 50-day, 100-day, or any other day-specific discussion to 20-period, 50-period, 100-period, and similar discussions, where the period stands for the chart timeline.
The EMA-SMA conundrum
Before you start putting the golden cross strategies to work, you must understand that you can use both exponential moving averages (EMAs) and simple moving averages (SMAs). EMAs emphasize recent prices, whereas SMAs assign equal weightage to every historical data point. As EMAs take the recent prices more seriously, using them for your golden cross strategy might result in the “crossing” appearing earlier than SMAs.
However, the decision to go with EMAs or SMAs is completely yours — much like the choice of trading pairs. Still, every golden crossover analysis is best represented by 50-period EMA and 200-period SMA as the go-to historical pointers. And there are reasons for this.
50-period EMA is heavily skewed towards the recent price changes in the short-term, whereas the 200-period SMA takes every historical data point into consideration and gives equal weightage to the same. This justifies the actual long-term view of an asset’s price movement.
Top golden cross trading strategies: five most popular ones
Now that we know a fair bit about a golden cross conceptually, let us put all of that into action and discuss the trading strategies, one at a time.
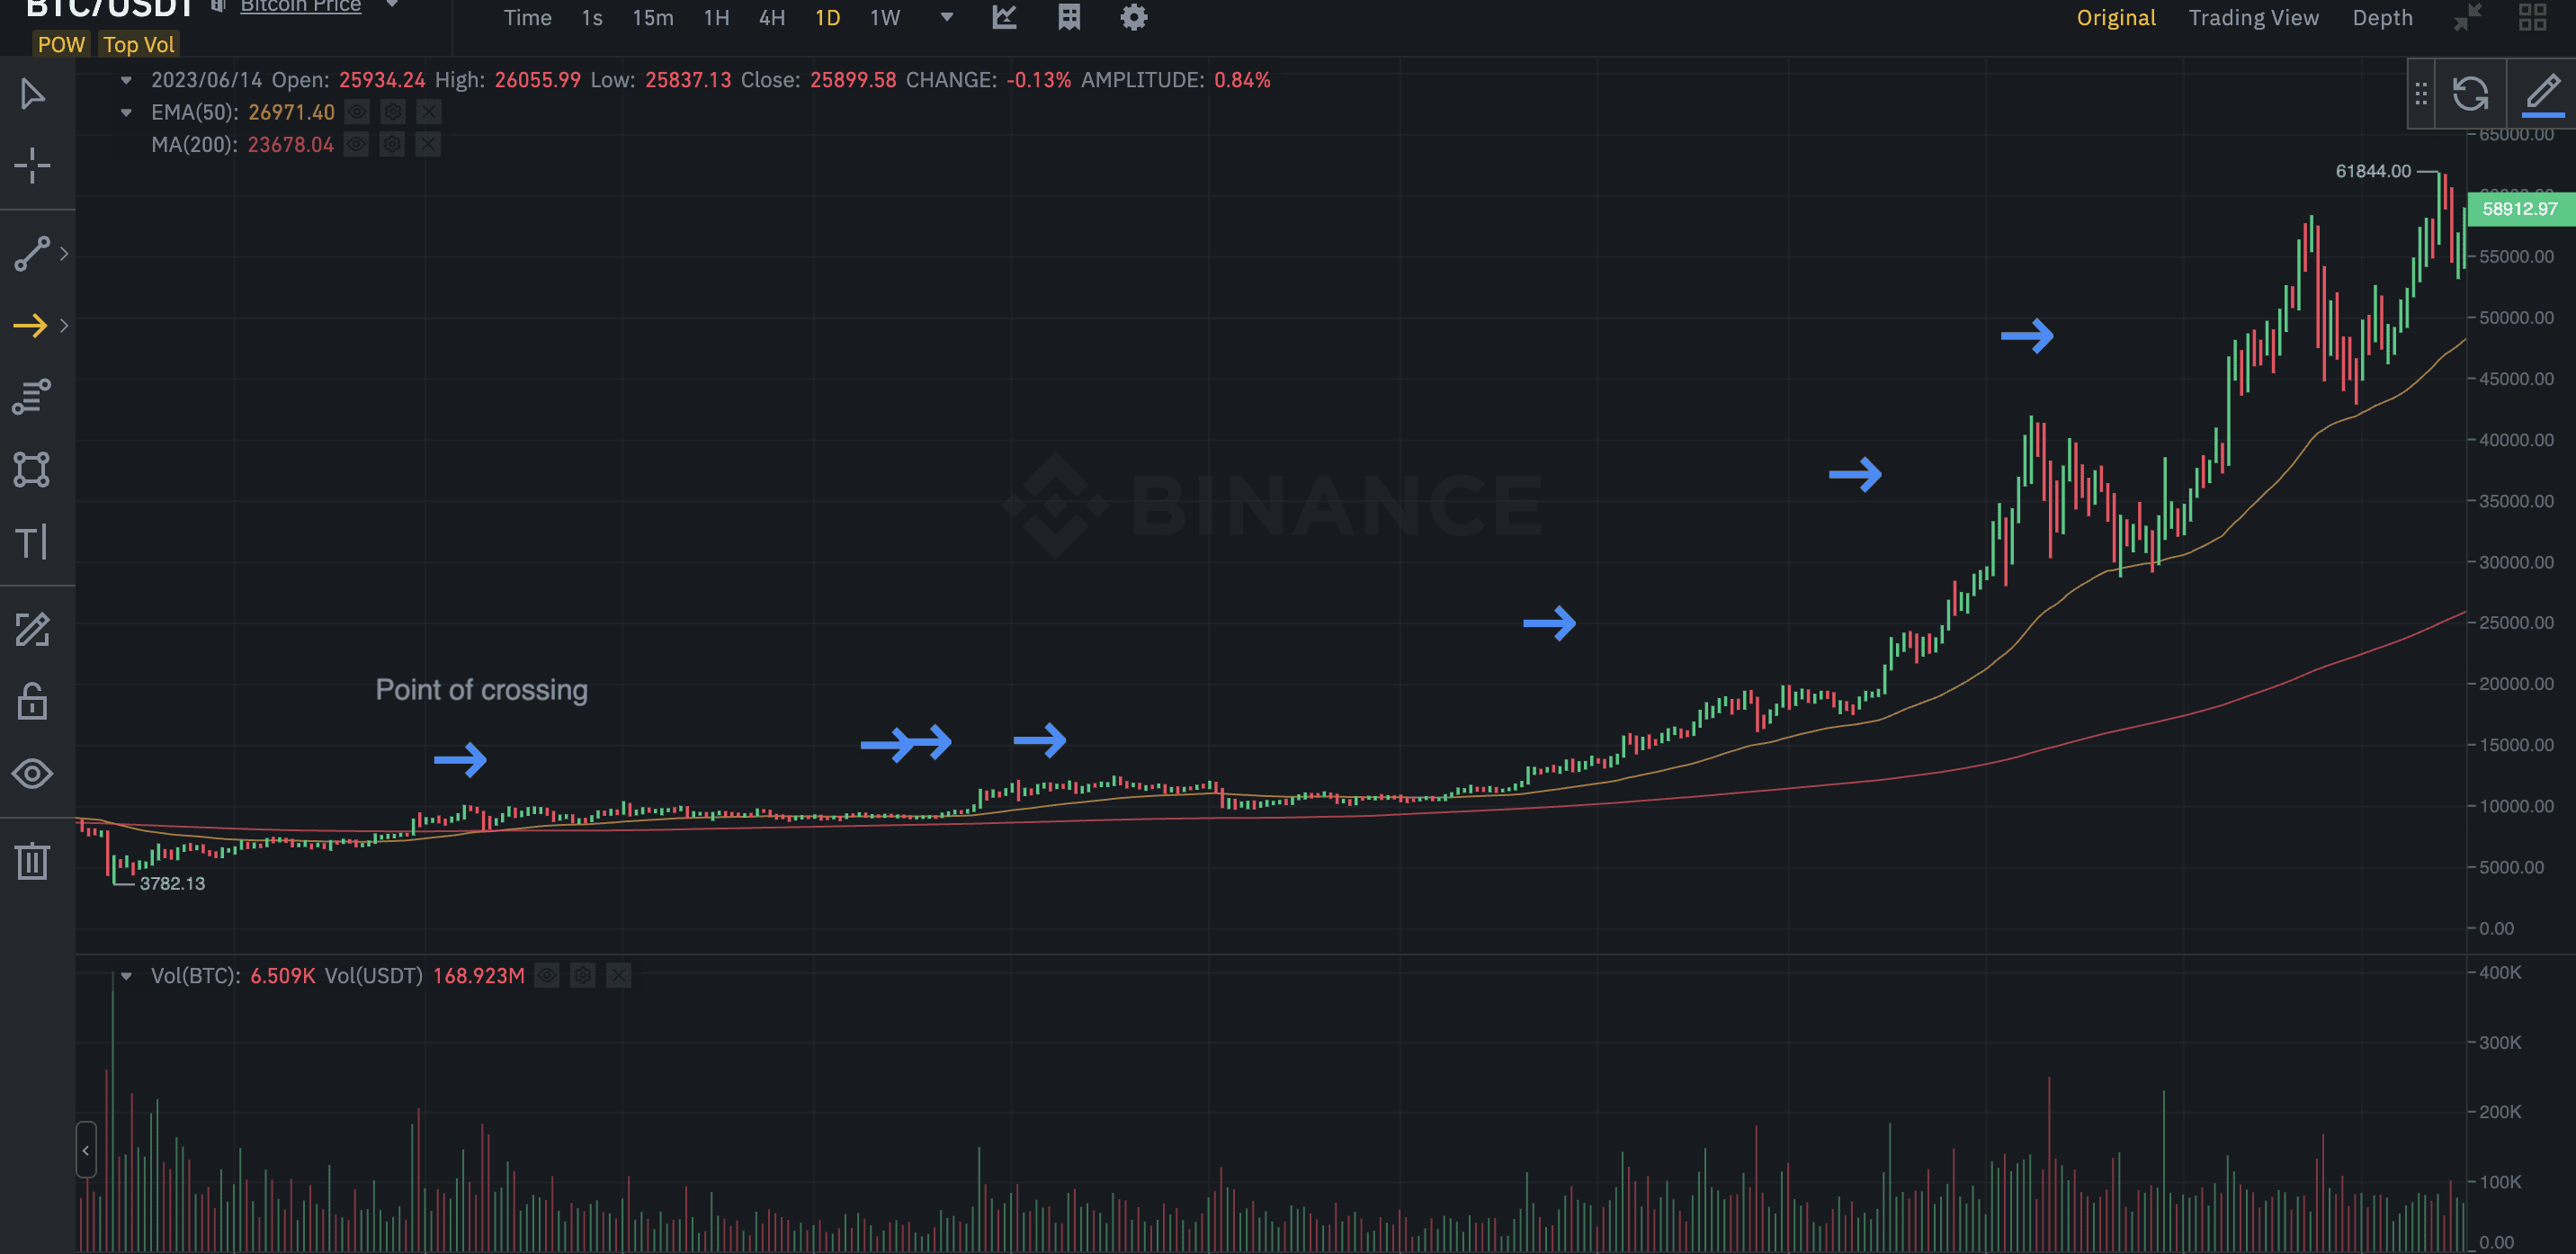
Strategy 1: Basic golden cross strategy
The basic golden cross strategy is to locate a crossing of moving averages corresponding to the price action. This has to be the most basic implementation of a golden crossover pattern used by traders to enter long trades.
Here is how it works:
A trader tracks the moving average pairs of their choice and places an entry or a buy order the moment there is a crossing. Conservative traders look for a retracement as some sort of confirmation before placing entry orders as a typical risk management strategy. This is often a good way to cut losses.
“The most important thing in making money is not letting your losses get out of hand.”
Martin S. Schwartz, Wall Street trader: from the Pit Bull: Lessons from Wall Street’s Champion Day Trader
The trading strategy can be as follows:
Entry
- Identify the exact position of the golden crossing. You might consider placing the buy order the moment the price crosses the area of crossover.
Exit
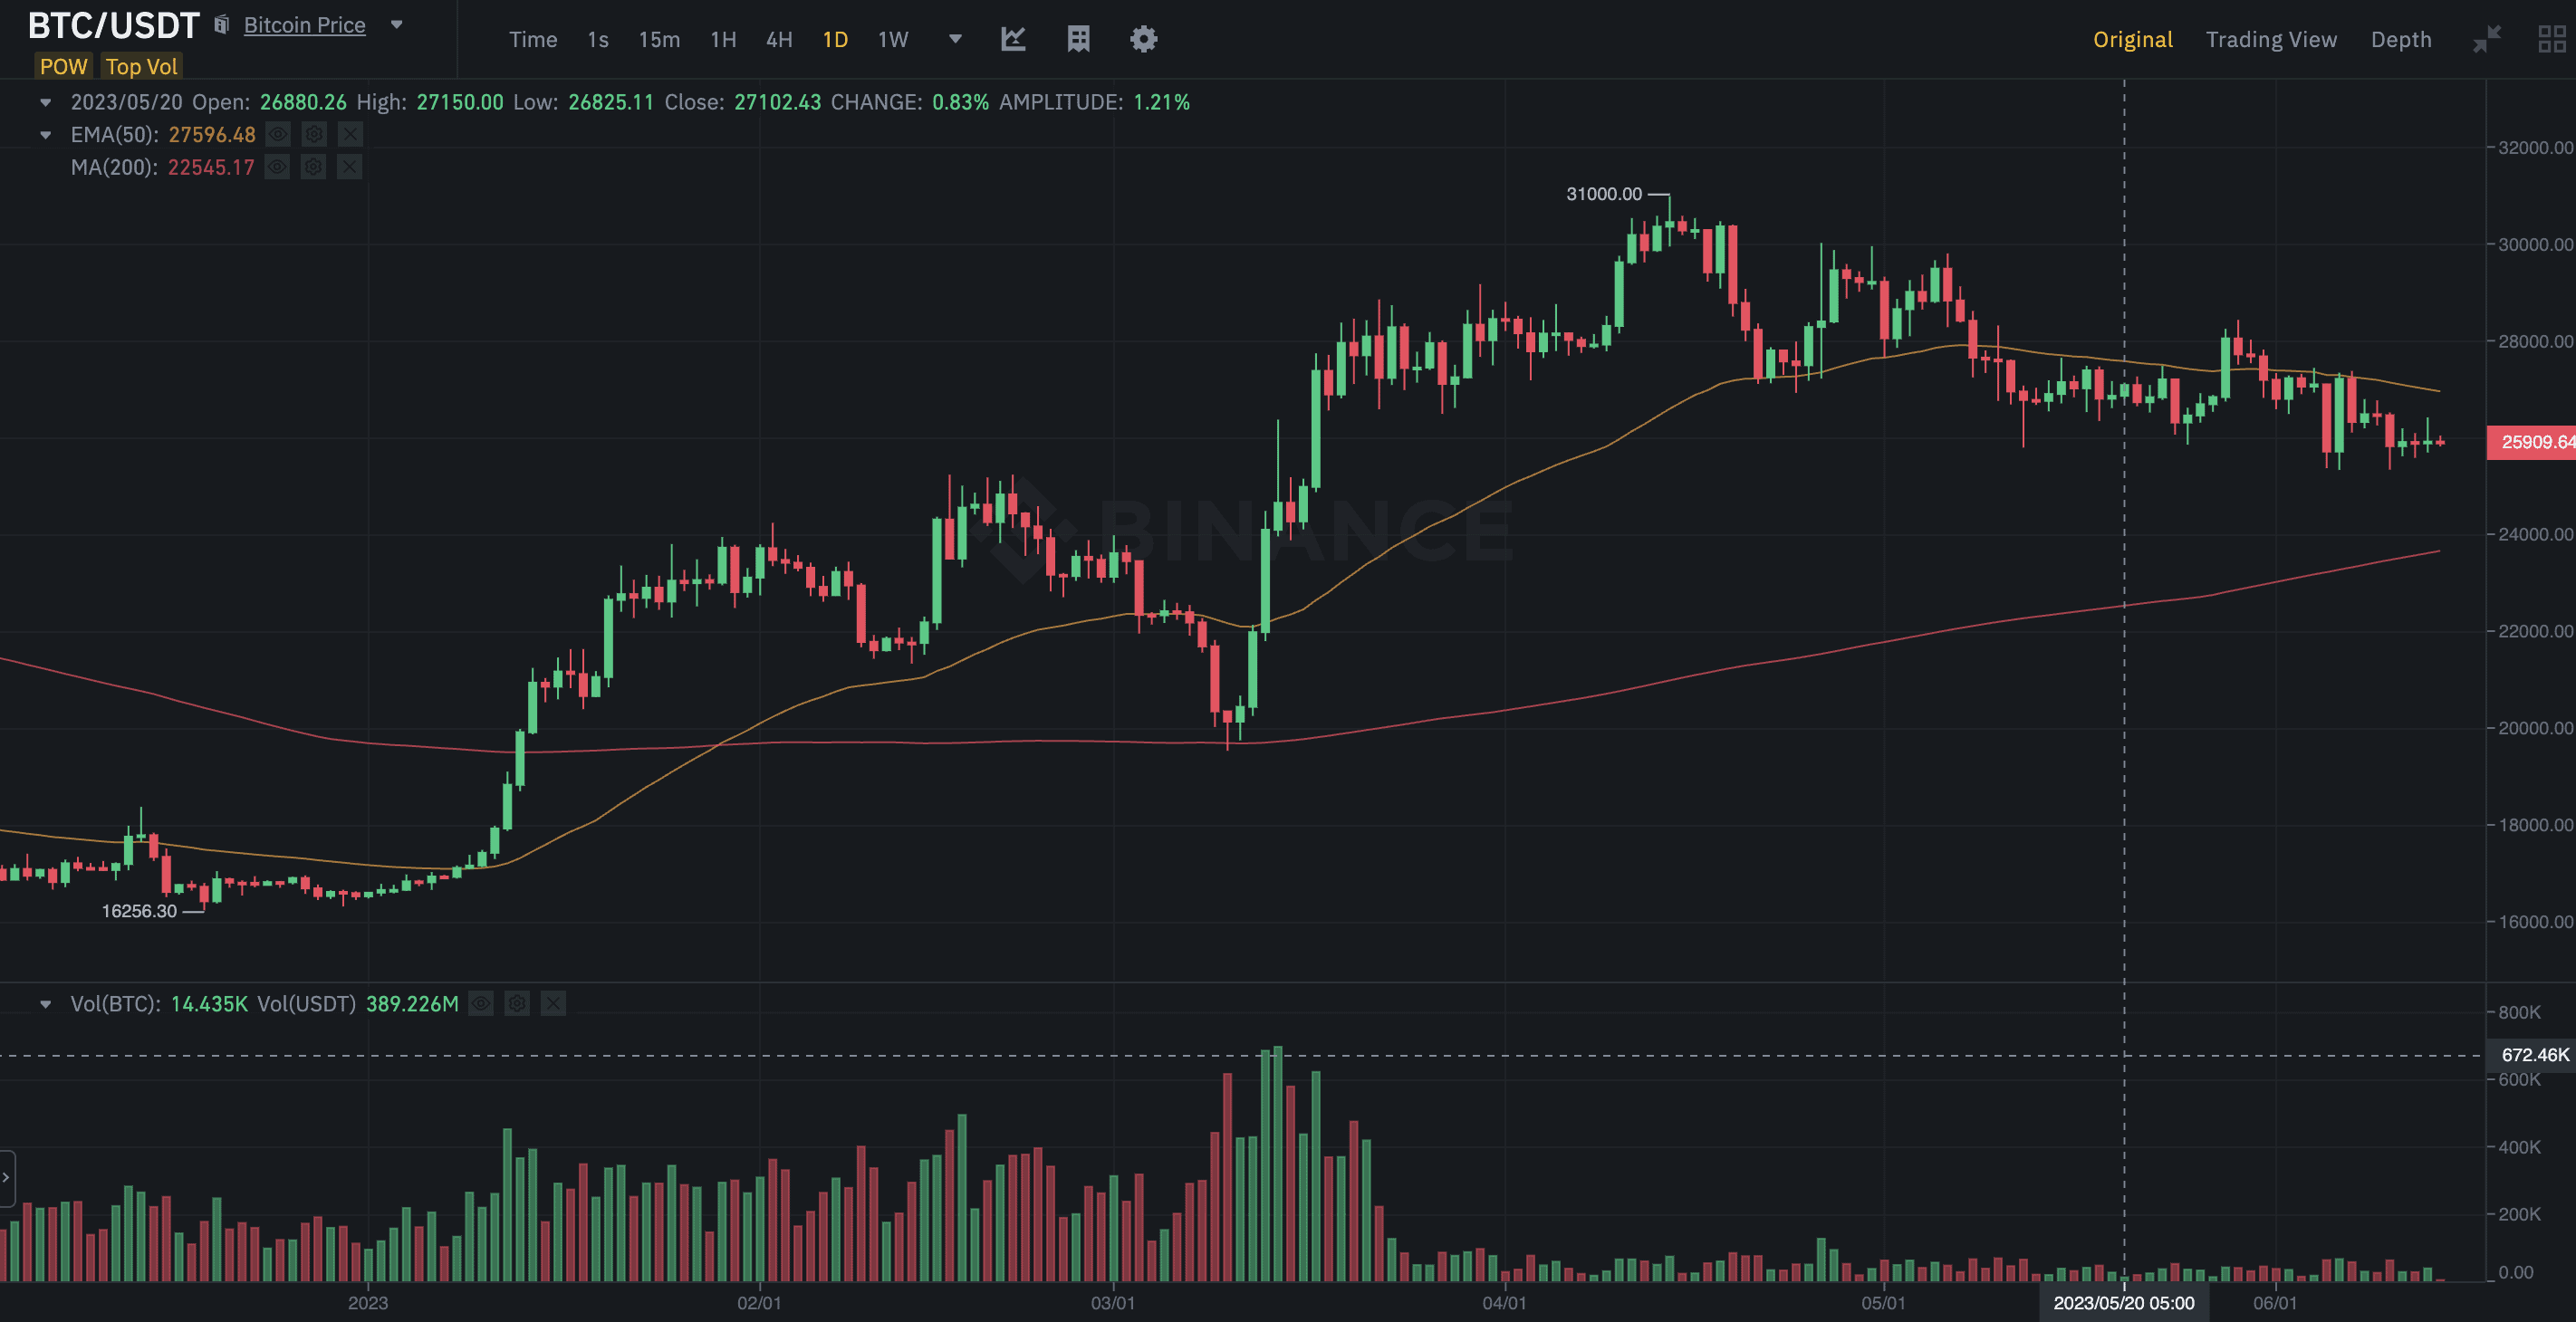
- For a basic crossover, without any support from other indicators, locating the region to exit can be tricky. However, if you are risk averse trader, you can place a stop loss lower than the 200-day simple moving average line.
- Also, if you see the 50-day EMA crossing under the 200-day SMA or the death crossover, the point of the first intersection can be a good point to exit. In a death crossover, a falling knife or a sharp price correction becomes the standard expectation.
- If you know how candlestick patterns work, a good indication to look for is to identify bearish candlestick reversal patterns like three black crows, evening star, or more. Identifying a bearish reversal pattern can help you locate the desired profit-booking pointers even when the 50-day EMA keeps trading above the 200-day SMA.
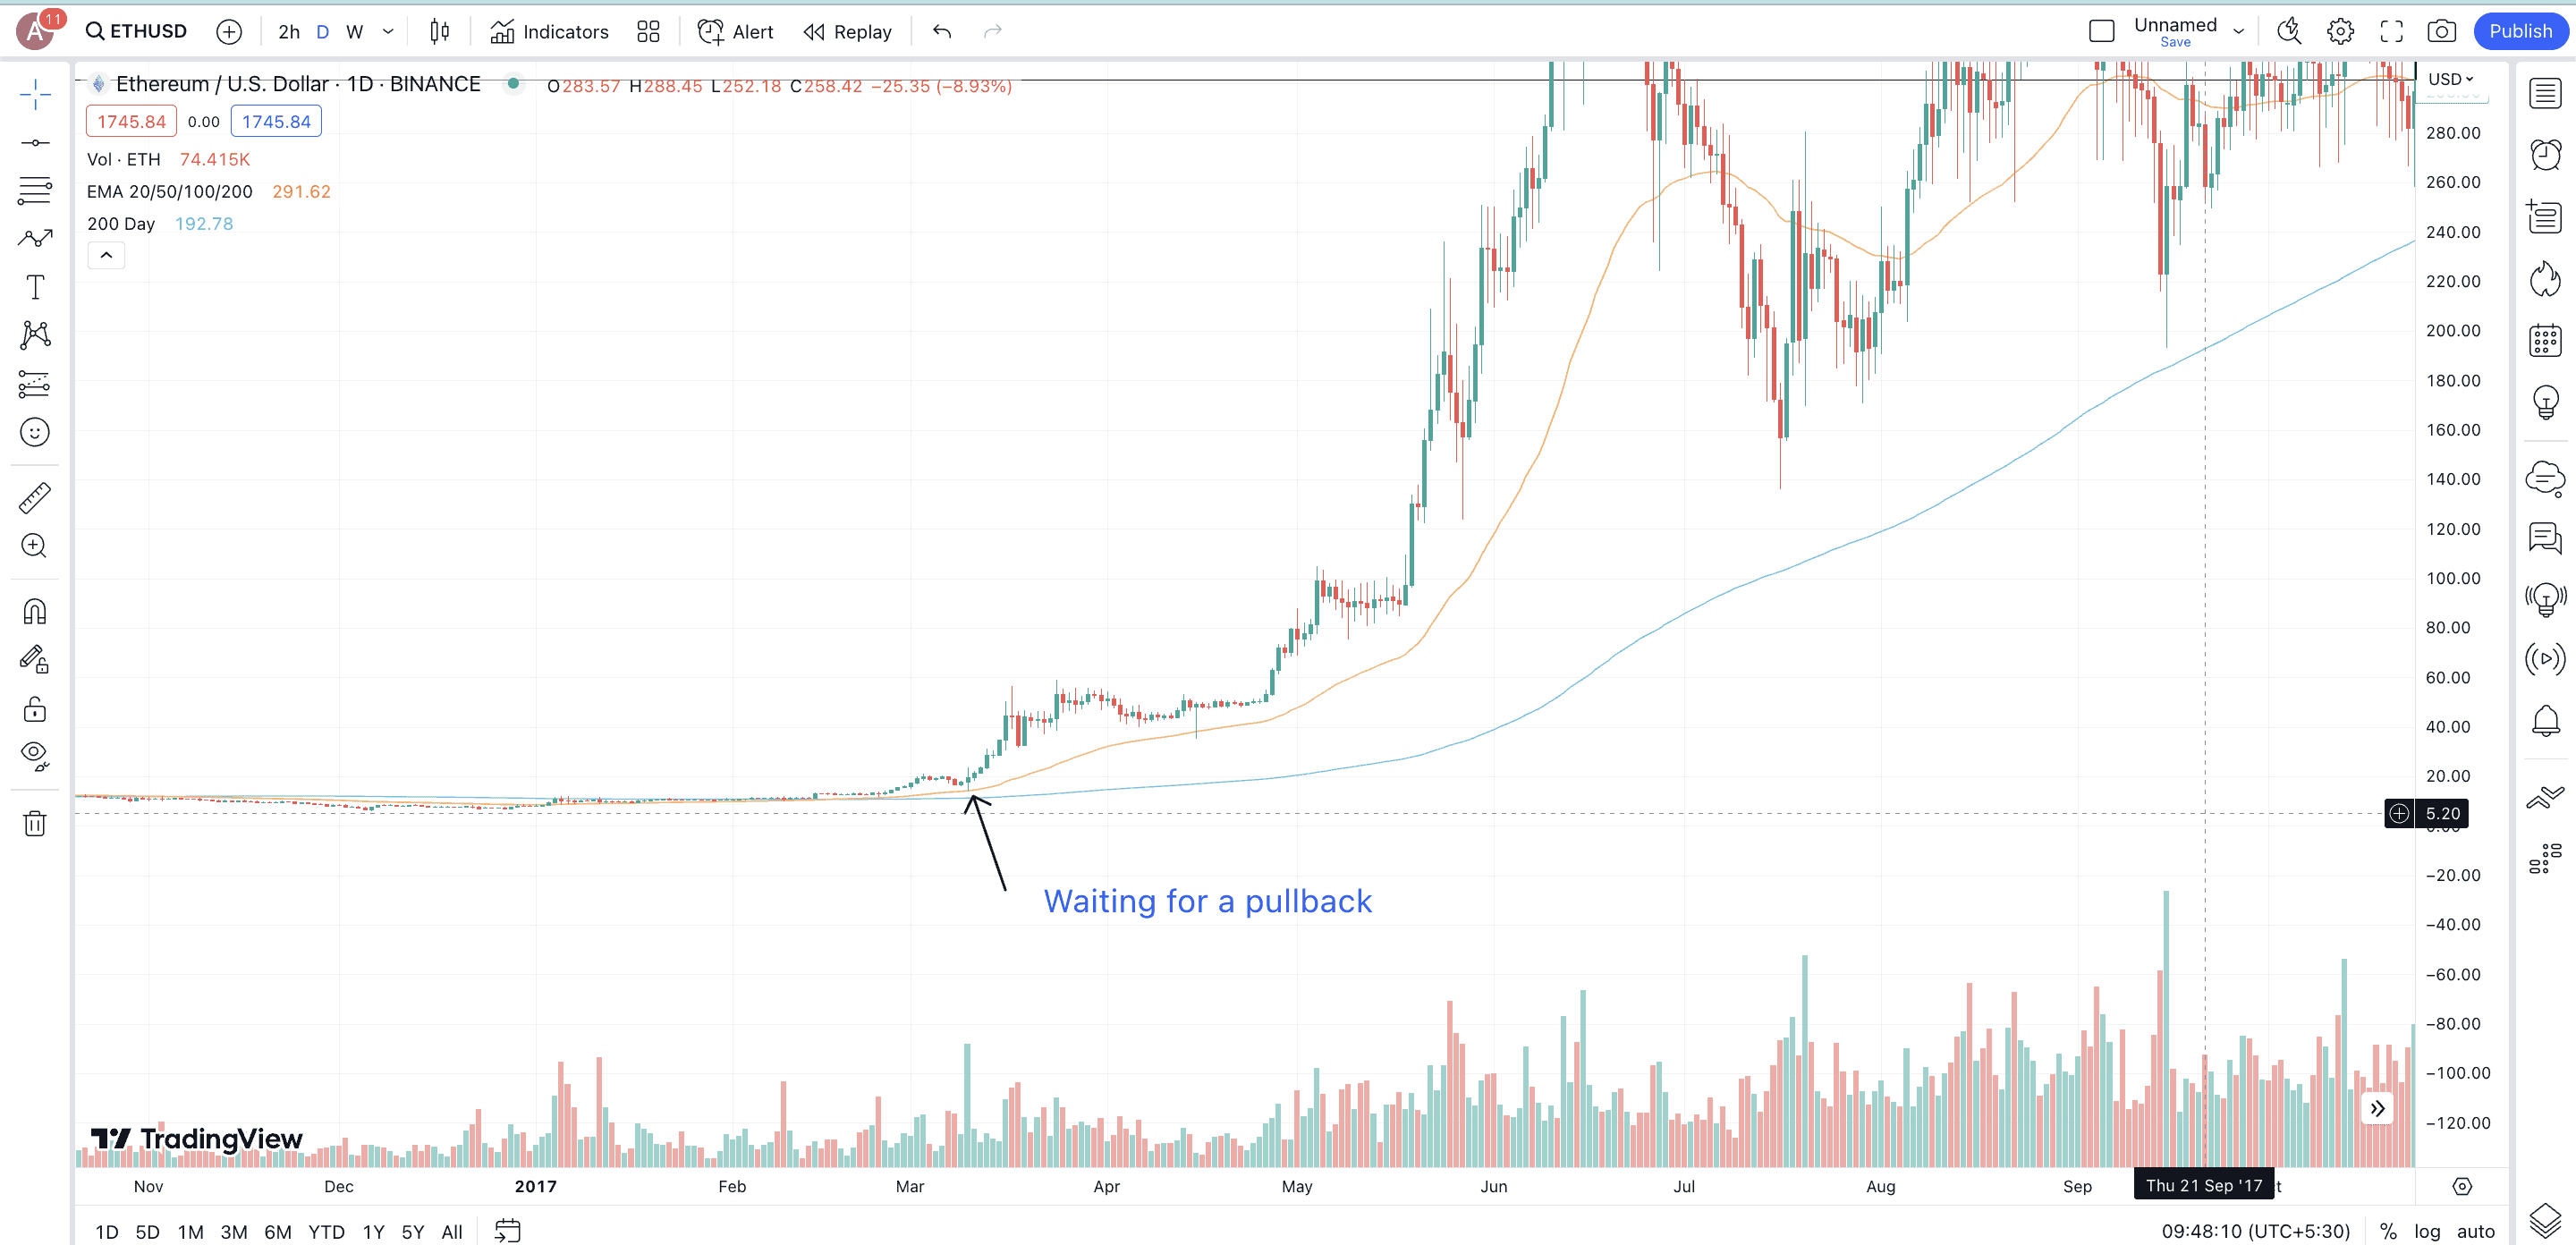
Strategy 2: The pullback strategy
This golden cross strategy is a lot more reliable than the regular usage of a golden crossover. Here is how it works:
Once a golden crossover exists, do not immediately fall for the price breakout. Instead, you should wait for the price to come back or retrace near the area of the crossover. This kind of pullback is meant to shake out all the weak hands before the uptrend resumes. The pullback strategy banks on the idea that prices retrace to specific support zones before continuing the upmove.
You can consider the following trading strategy:
Entry
- Locate the exact point of the crossing. Once the price crosses that region, wait for a pullback — the price to head back towards the 50-day EMA and then the 200-day SMA as the significant support levels,
- Only if the price moves back up after hitting the support levels you might consider taking a trading position.
Exit
- While you can always exit the moment a death crossing is identified, there are a few other pointers to consider.
- The moment you start seeing a pullback, you can place the stop loss lower than the desired pullback level — lower than the 50-EMA and the 200-SMA.
- If you know how to draw support levels, try and locate the most prominent ones coinciding with the 50-day EMA and the 200-day SMA levels.
- If the price breaks the support first and then moves to breach the moving average lines, you can adjust your stop loss or exit position accordingly,
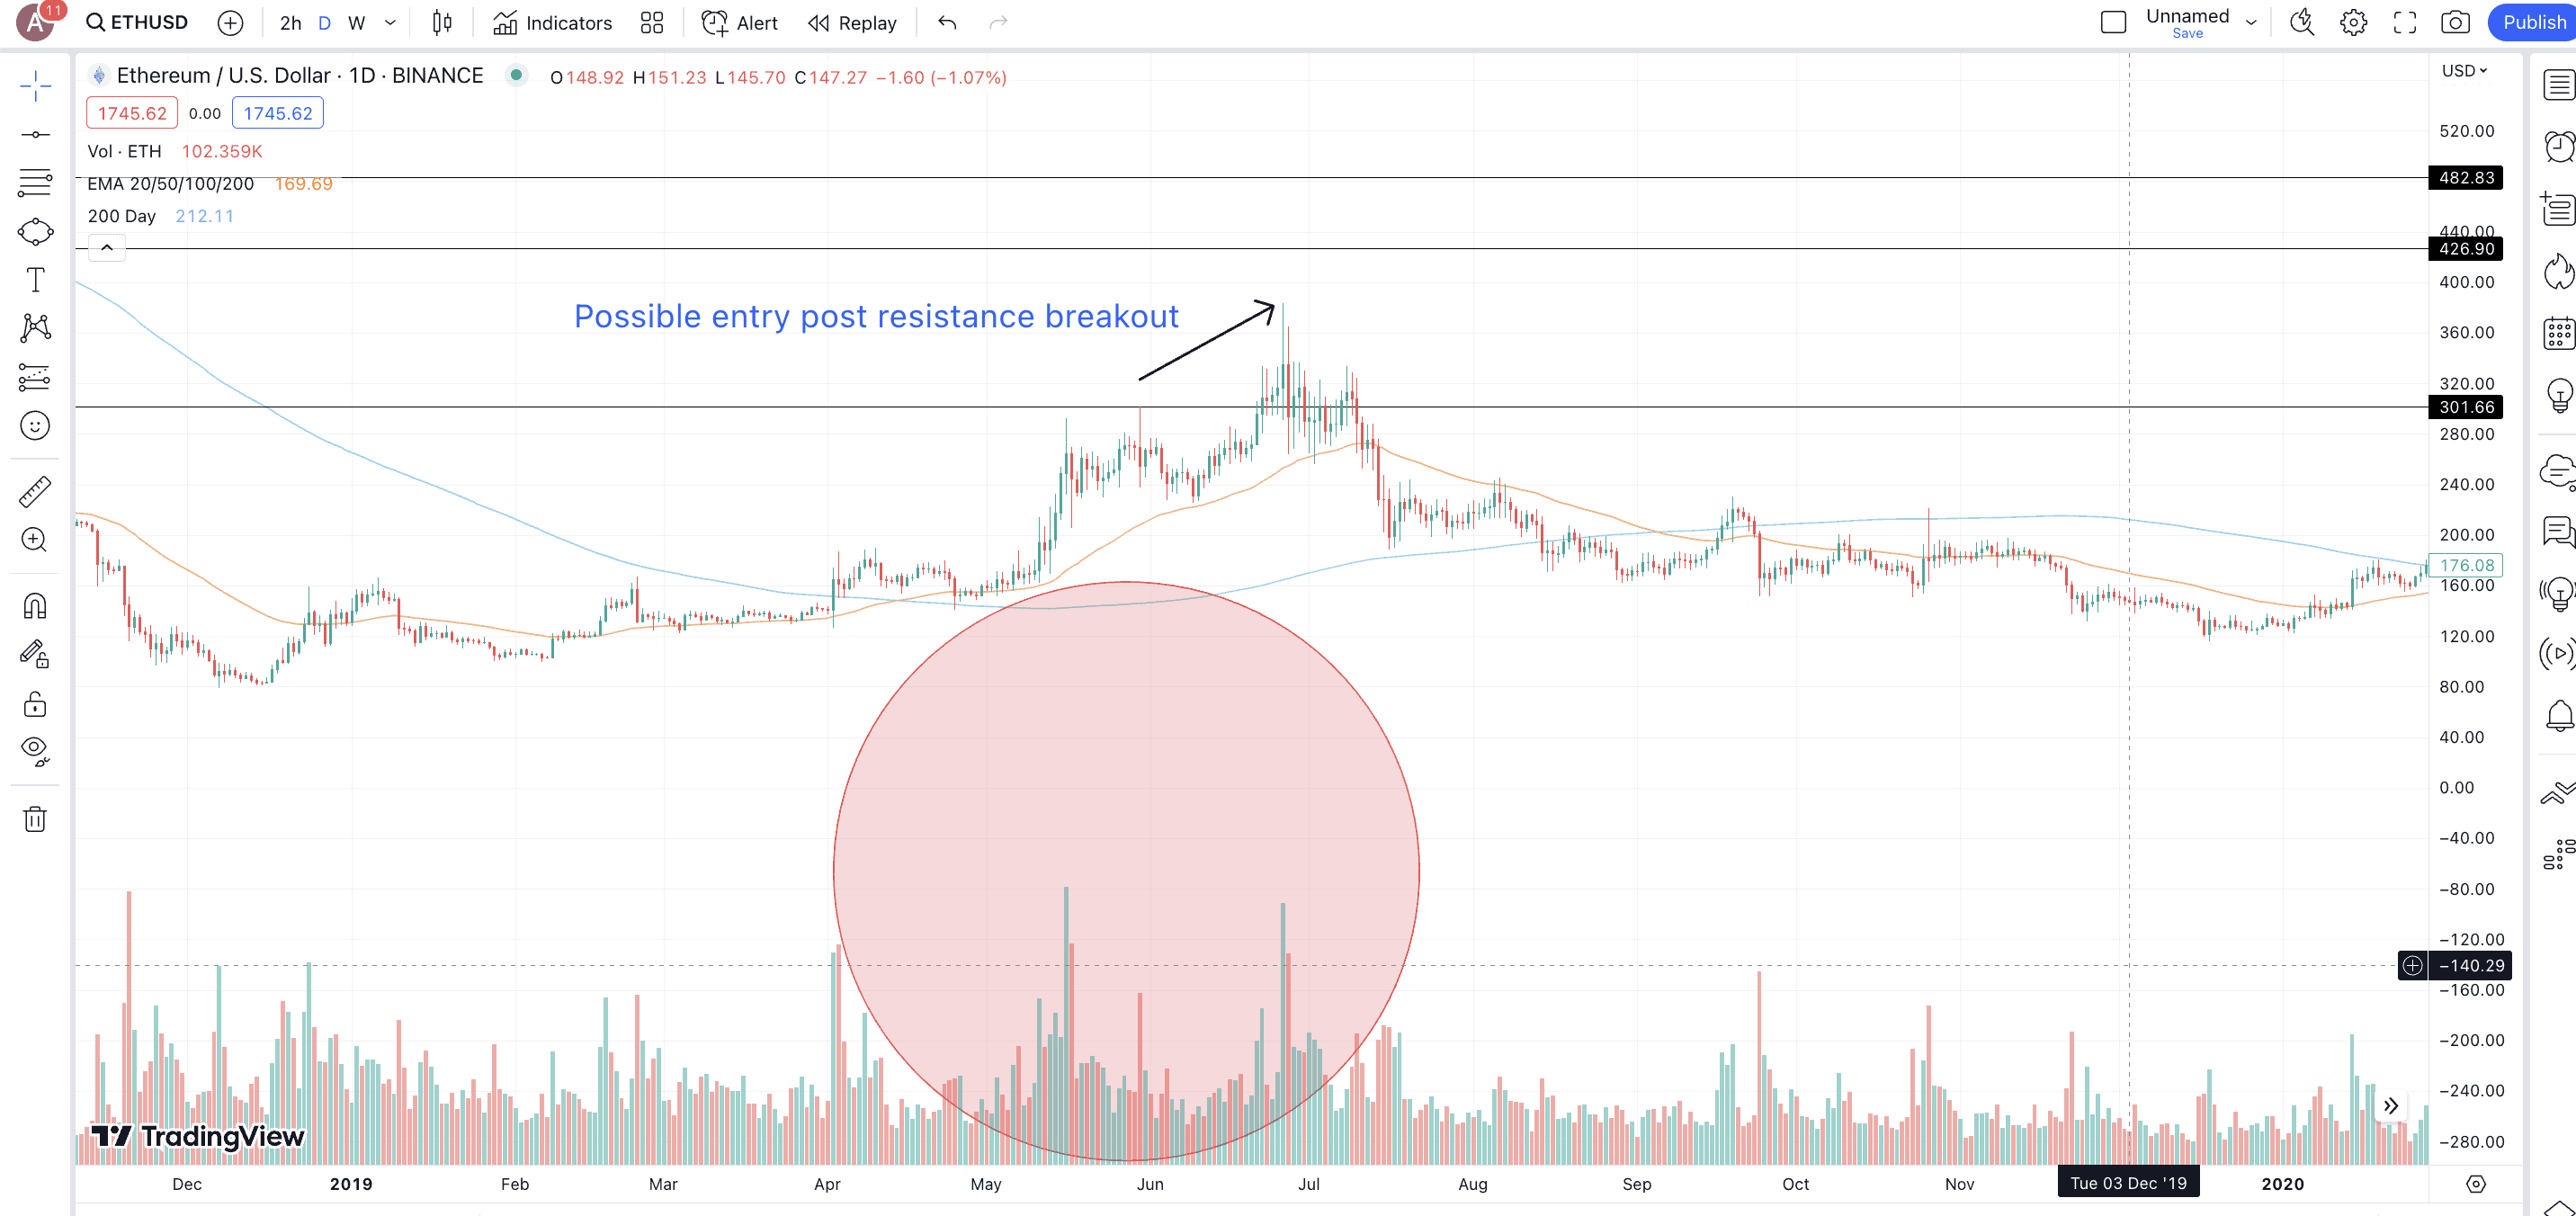
Strategy 3: The breakout strategy
You can use this easy-to-understand golden cross strategy to get a stronger confirmation. Here is how it works:
Once you start seeing a crossover scenario, you can quickly overlook the moving averages and draw those conventional resistance lines on the chart. These lines are specific breakout zones, and you might consider entering the trade only if these levels are breached post the golden crossing.
Here is a tentative trading strategy to follow:
Entry
- Locate the strongest resistance zones and draw the same above the MA crossing zone.
- Once the crossover happens, wait for the price to break out of that resistance zone, placing the buy level above the breakout level.
Exit
- If the breakout happens, the resistance level becomes the immediate support for the asset.
- Therefore, you can apply the trailing stop loss method — adjusting the stop loss depending on market conditions.
- The first profit booking zone can be the resistance-turned-support, followed by the 50-day EMA and the 200-day SMA lines.
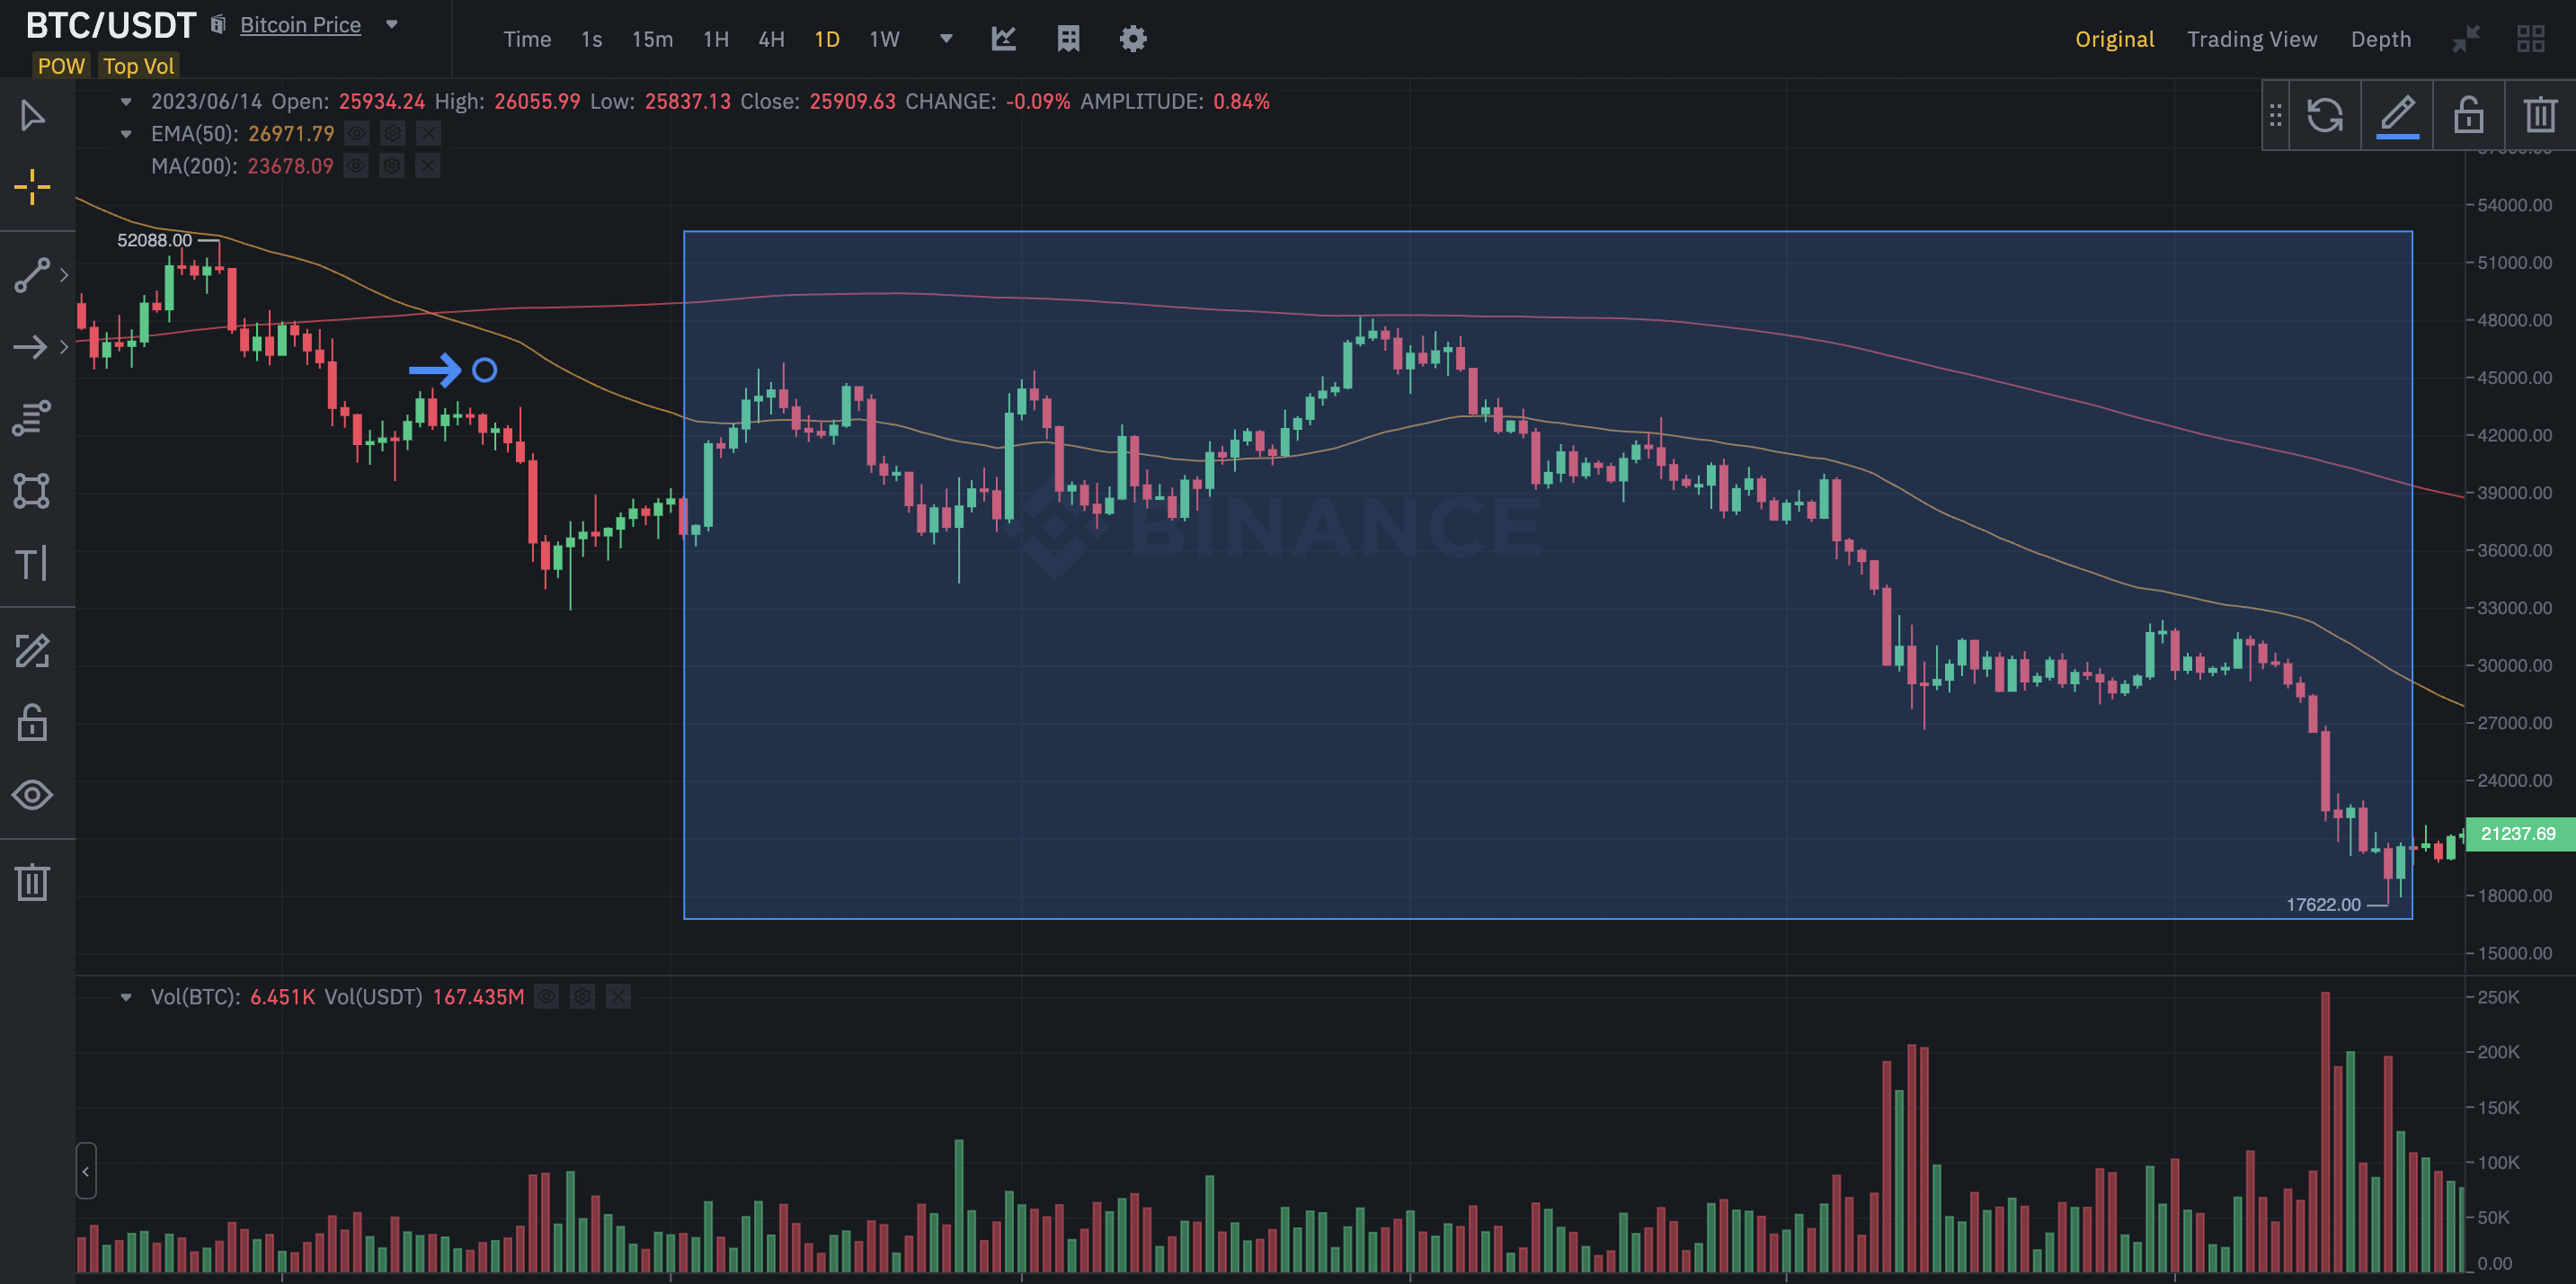
Strategy 4: Golden cross with volume confirmation
Like any other moving average crossover trading strategy, even the golden cross strategy relies heavily on trading volumes. While the crossover itself is a confirmation, a high trading volume adds to the conviction. Here is how the process works:
You need to use the volume indicator, price chart, and moving averages. Anytime there is a crossing, you must confirm the momentum with high trading volumes. If the volume isn’t high enough, the crossing might be a bull trap and not a bullish signal. In that case, it is better to refrain from trading the crossover.
In this case, exiting a position could be at a point where you see the short-term moving average falling under or converging with the long-term moving average. However, it is advisable to place an exit order only if the volume is high, even during the inverse crossover.
In this case, volume acts as a secondary confirmation. Here is how to trade this strategy:
Entry
- Identify the crossing and check if high trading volumes confirm the same.
- The perfect indication would be to experience high-volume pillars the moment the golden crossing happens.
- A pro tip here is to follow the price and volume together to look for a divergence.
- If the price increases while the volume pillars keep getting smaller, there is a bearish divergence, which might mean that the crossover might not hold.
Exit
- Look for a drop in trading volume and use the same with key support and resistance levels.
- If the price surge fails to break a key resistance post the crossing and the same period is followed by a drop in volume, it might be your cue to book profits.
You can refer to this guide on the Wyckoff Pattern to understand more about the volume and price relationship. This can help you trade the golden crossover better.
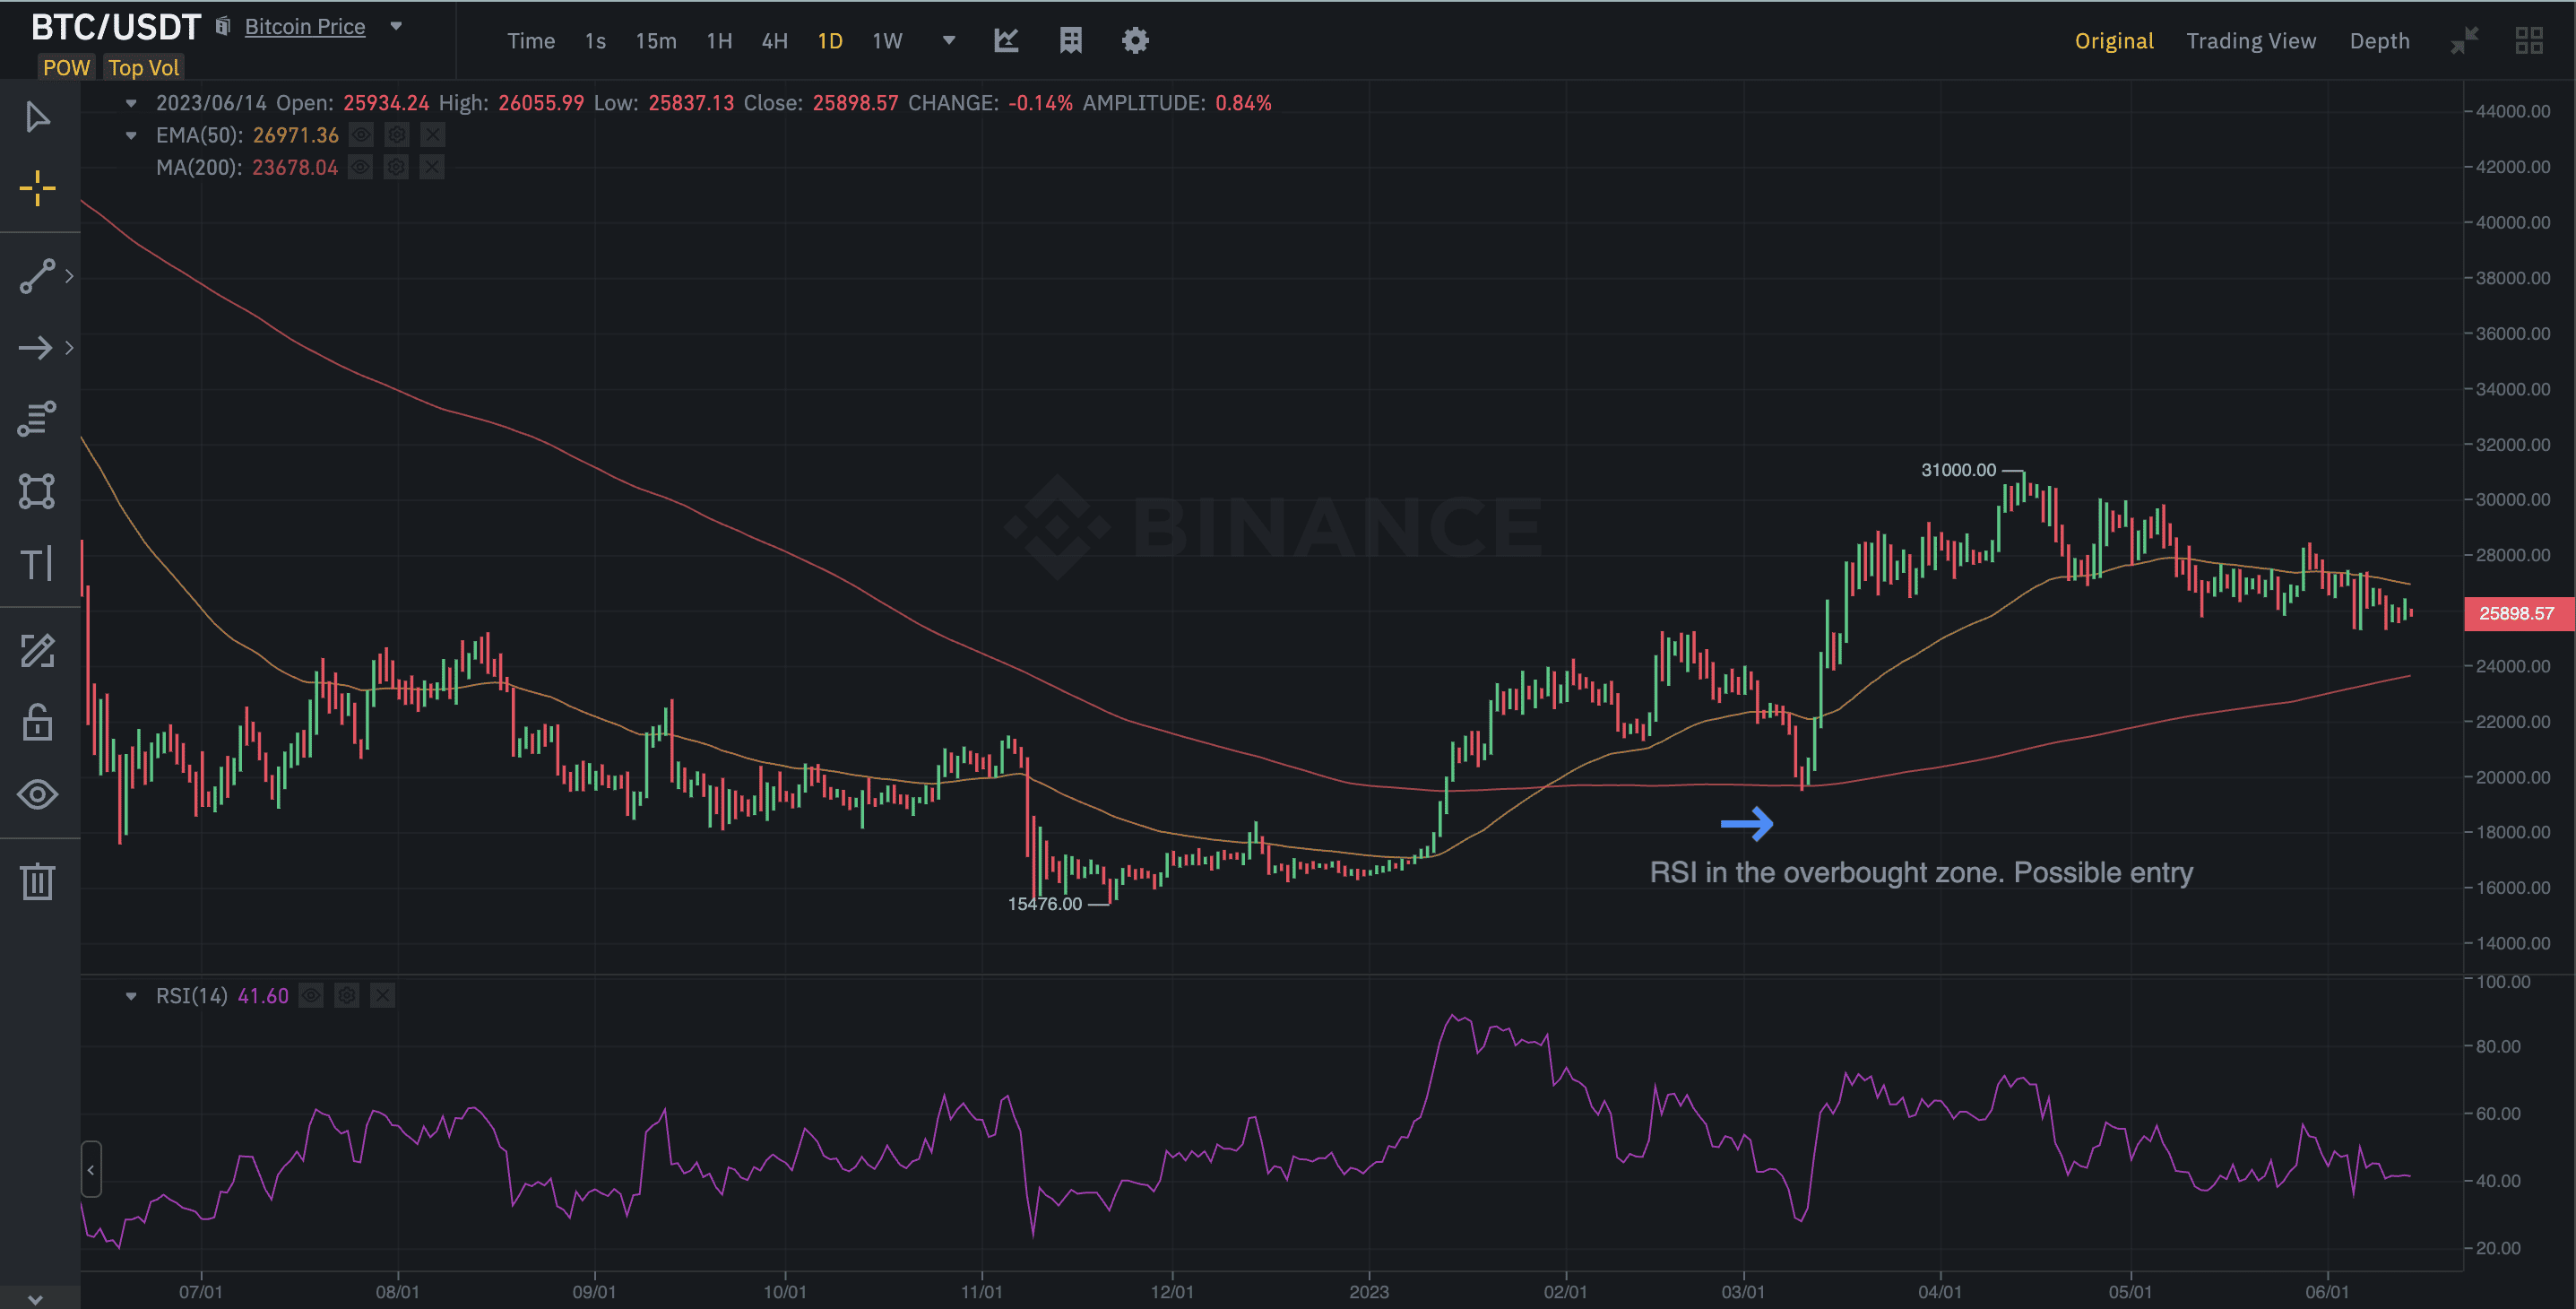
Strategy 5: Golden cross with RSI and RSI Divergence
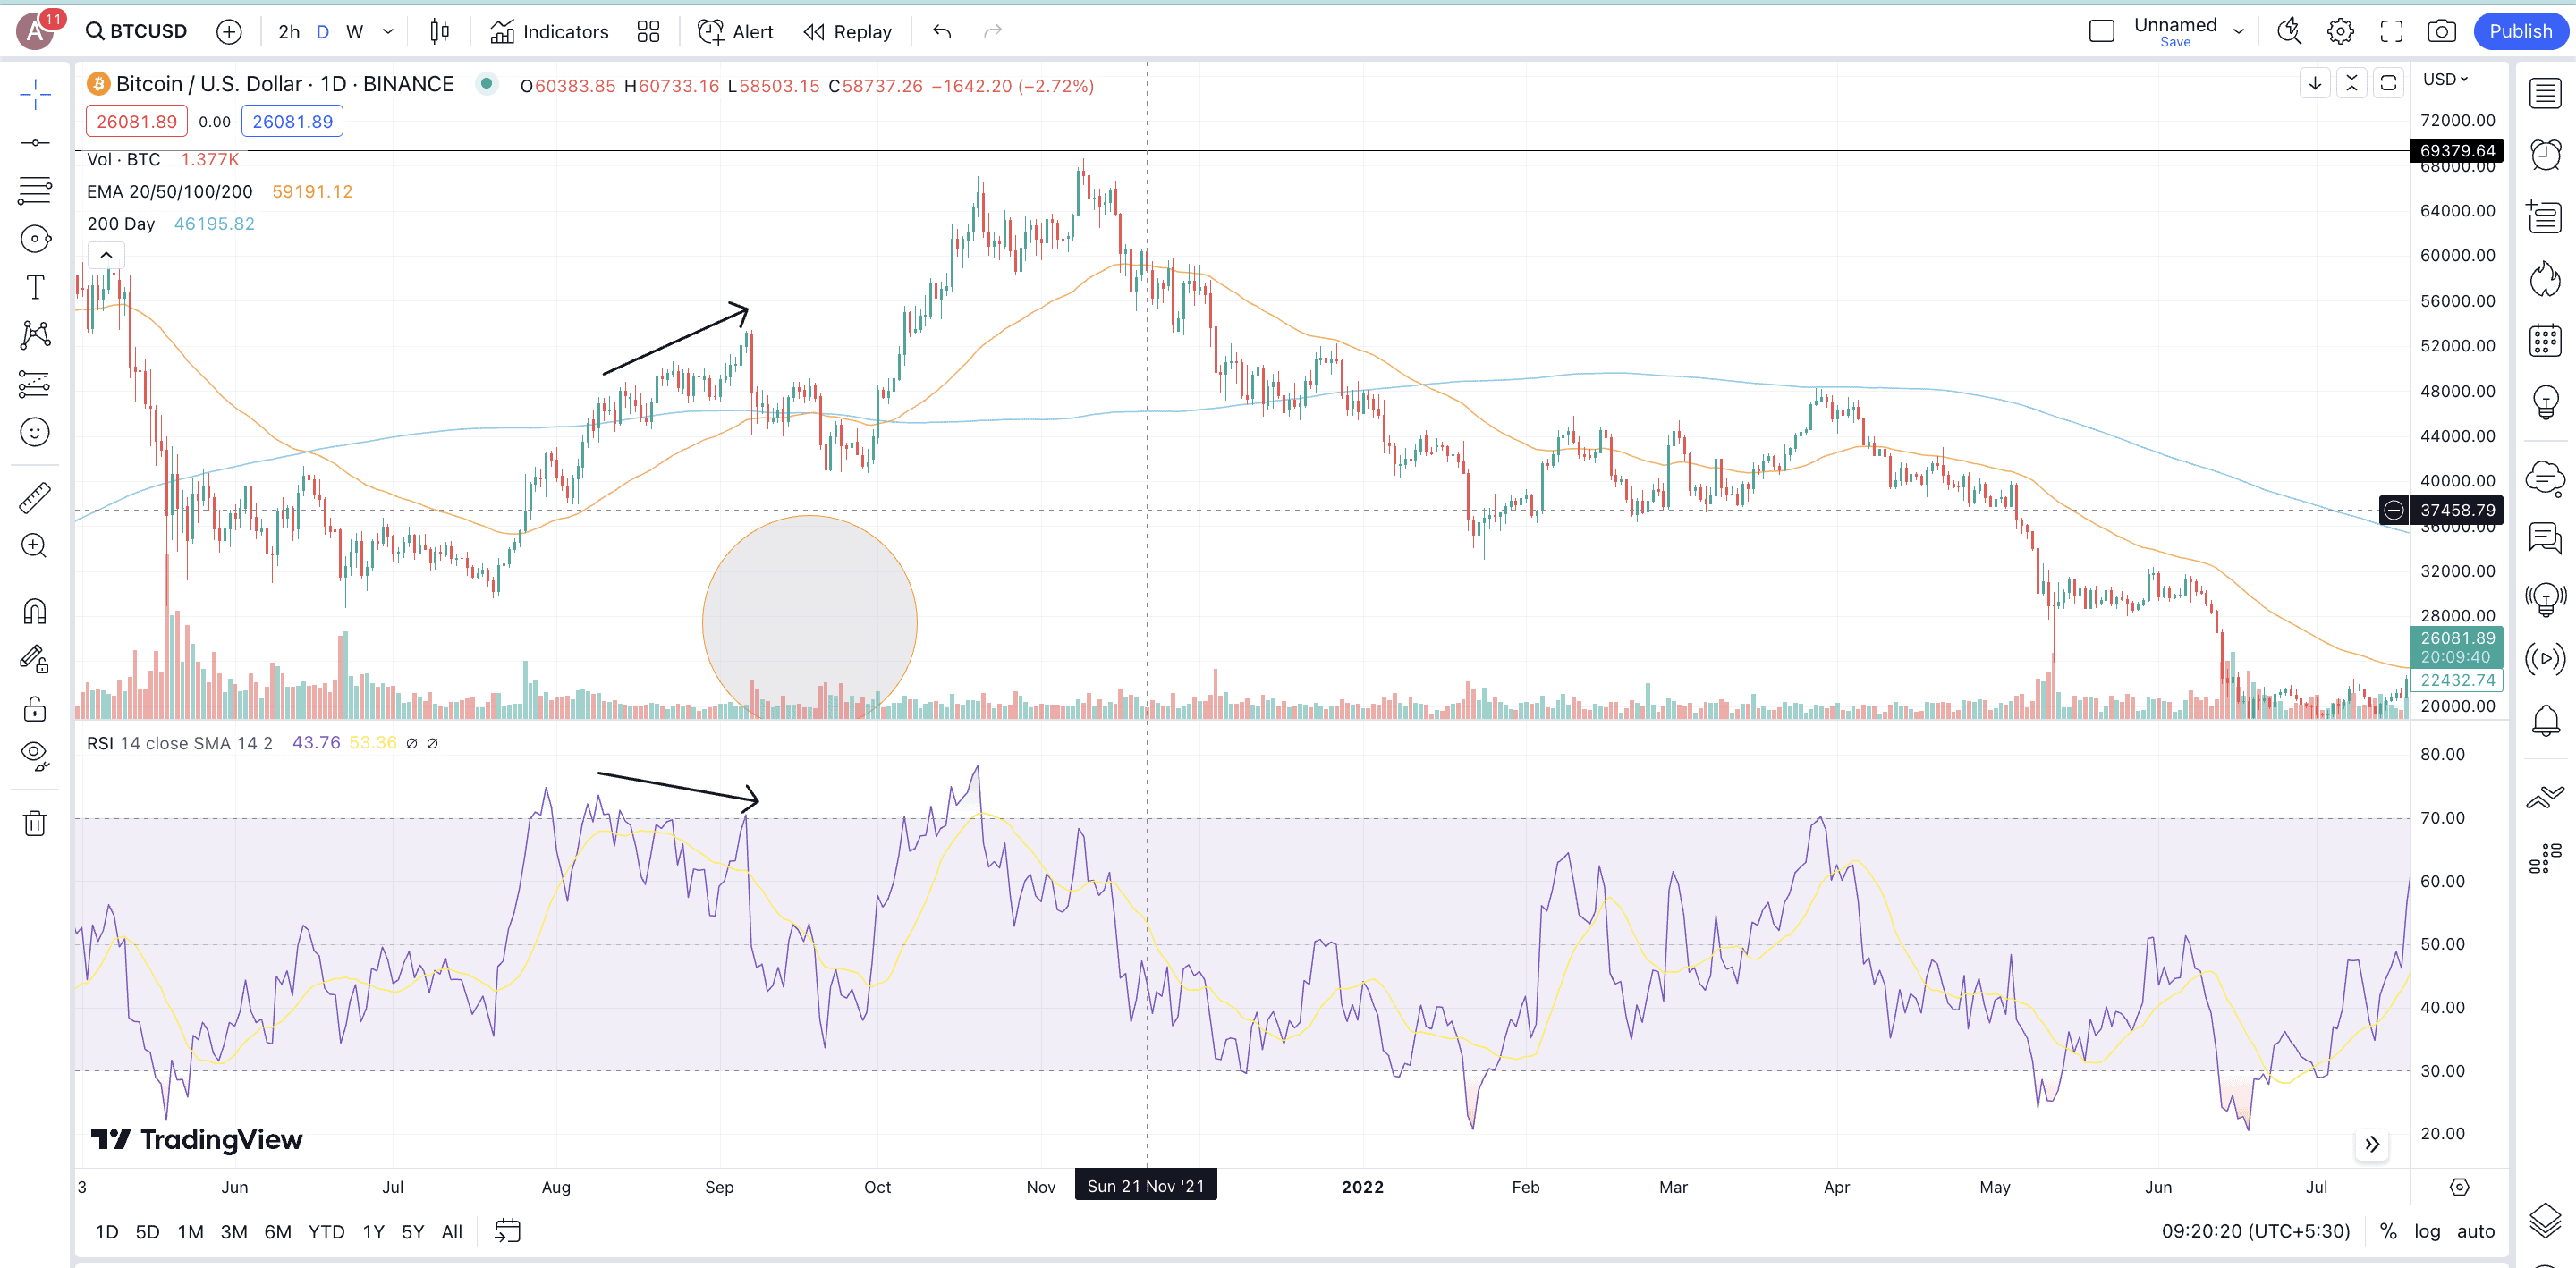
Relative Strength Index (RSI) is an oscillator that can help you confirm or reject the strength of a golden crossover. Here is how it works:
If you see a golden crossover forming on the price chart, you can confirm this with RSI levels. If the RSI is under 30 and there is a crossover on the price chart, there might be a strong bullish momentum on the cards in the form of a trend reversal.
But that’s just pairing the RSI with a golden cross. If you want a stronger validation, we would recommend RSI divergence. Here is how it works:
Once you see a golden crossover on the price chart, check whether the prices are moving in any pattern. Also, keep an eye on the RSI. The ideal scenario here would be to find the prices move in a lower higher formation with the RSI making higher highs. As RSI stands for momentum, a higher high move confirms a strong bullish momentum, which in turn confirms the golden cross’s strength in the first place.
It is better to avoid entering the trade if a bullish RSI divergence doesn’t validate the golden cross or if there is a bearish divergence in play — RSI making lower highs and prices making higher highs.
Also, here is a quick way to trade this strategy:
Entry
- Once the MA crossing happens, check for the price and RSI divergence, if any. This is when you must prepare for an entry if there is a follow-up sign.
- If there is a clear bullish divergence — RSI making higher highs as opposed to the price — it might be a good point to enter.
- It is necessary to note that the crossover has to happen first, and after that, you need to keep close track of the price and the RSI.
Exit
- In case price and RSI change trends, despite the crossover, it might be a good time to consider an exit.
- To locate the exact point of exit, you might have to draw the crucial support lines and place the stop loss immediately below the same.
Special mention: Golden cross with MACD divergence
It is noteworthy that Moving Average Convergence/Divergence (MACD) is often considered a more reliable ally to a golden crossover formation. The reason is that, like MACD, even the golden crossover works with moving averages.
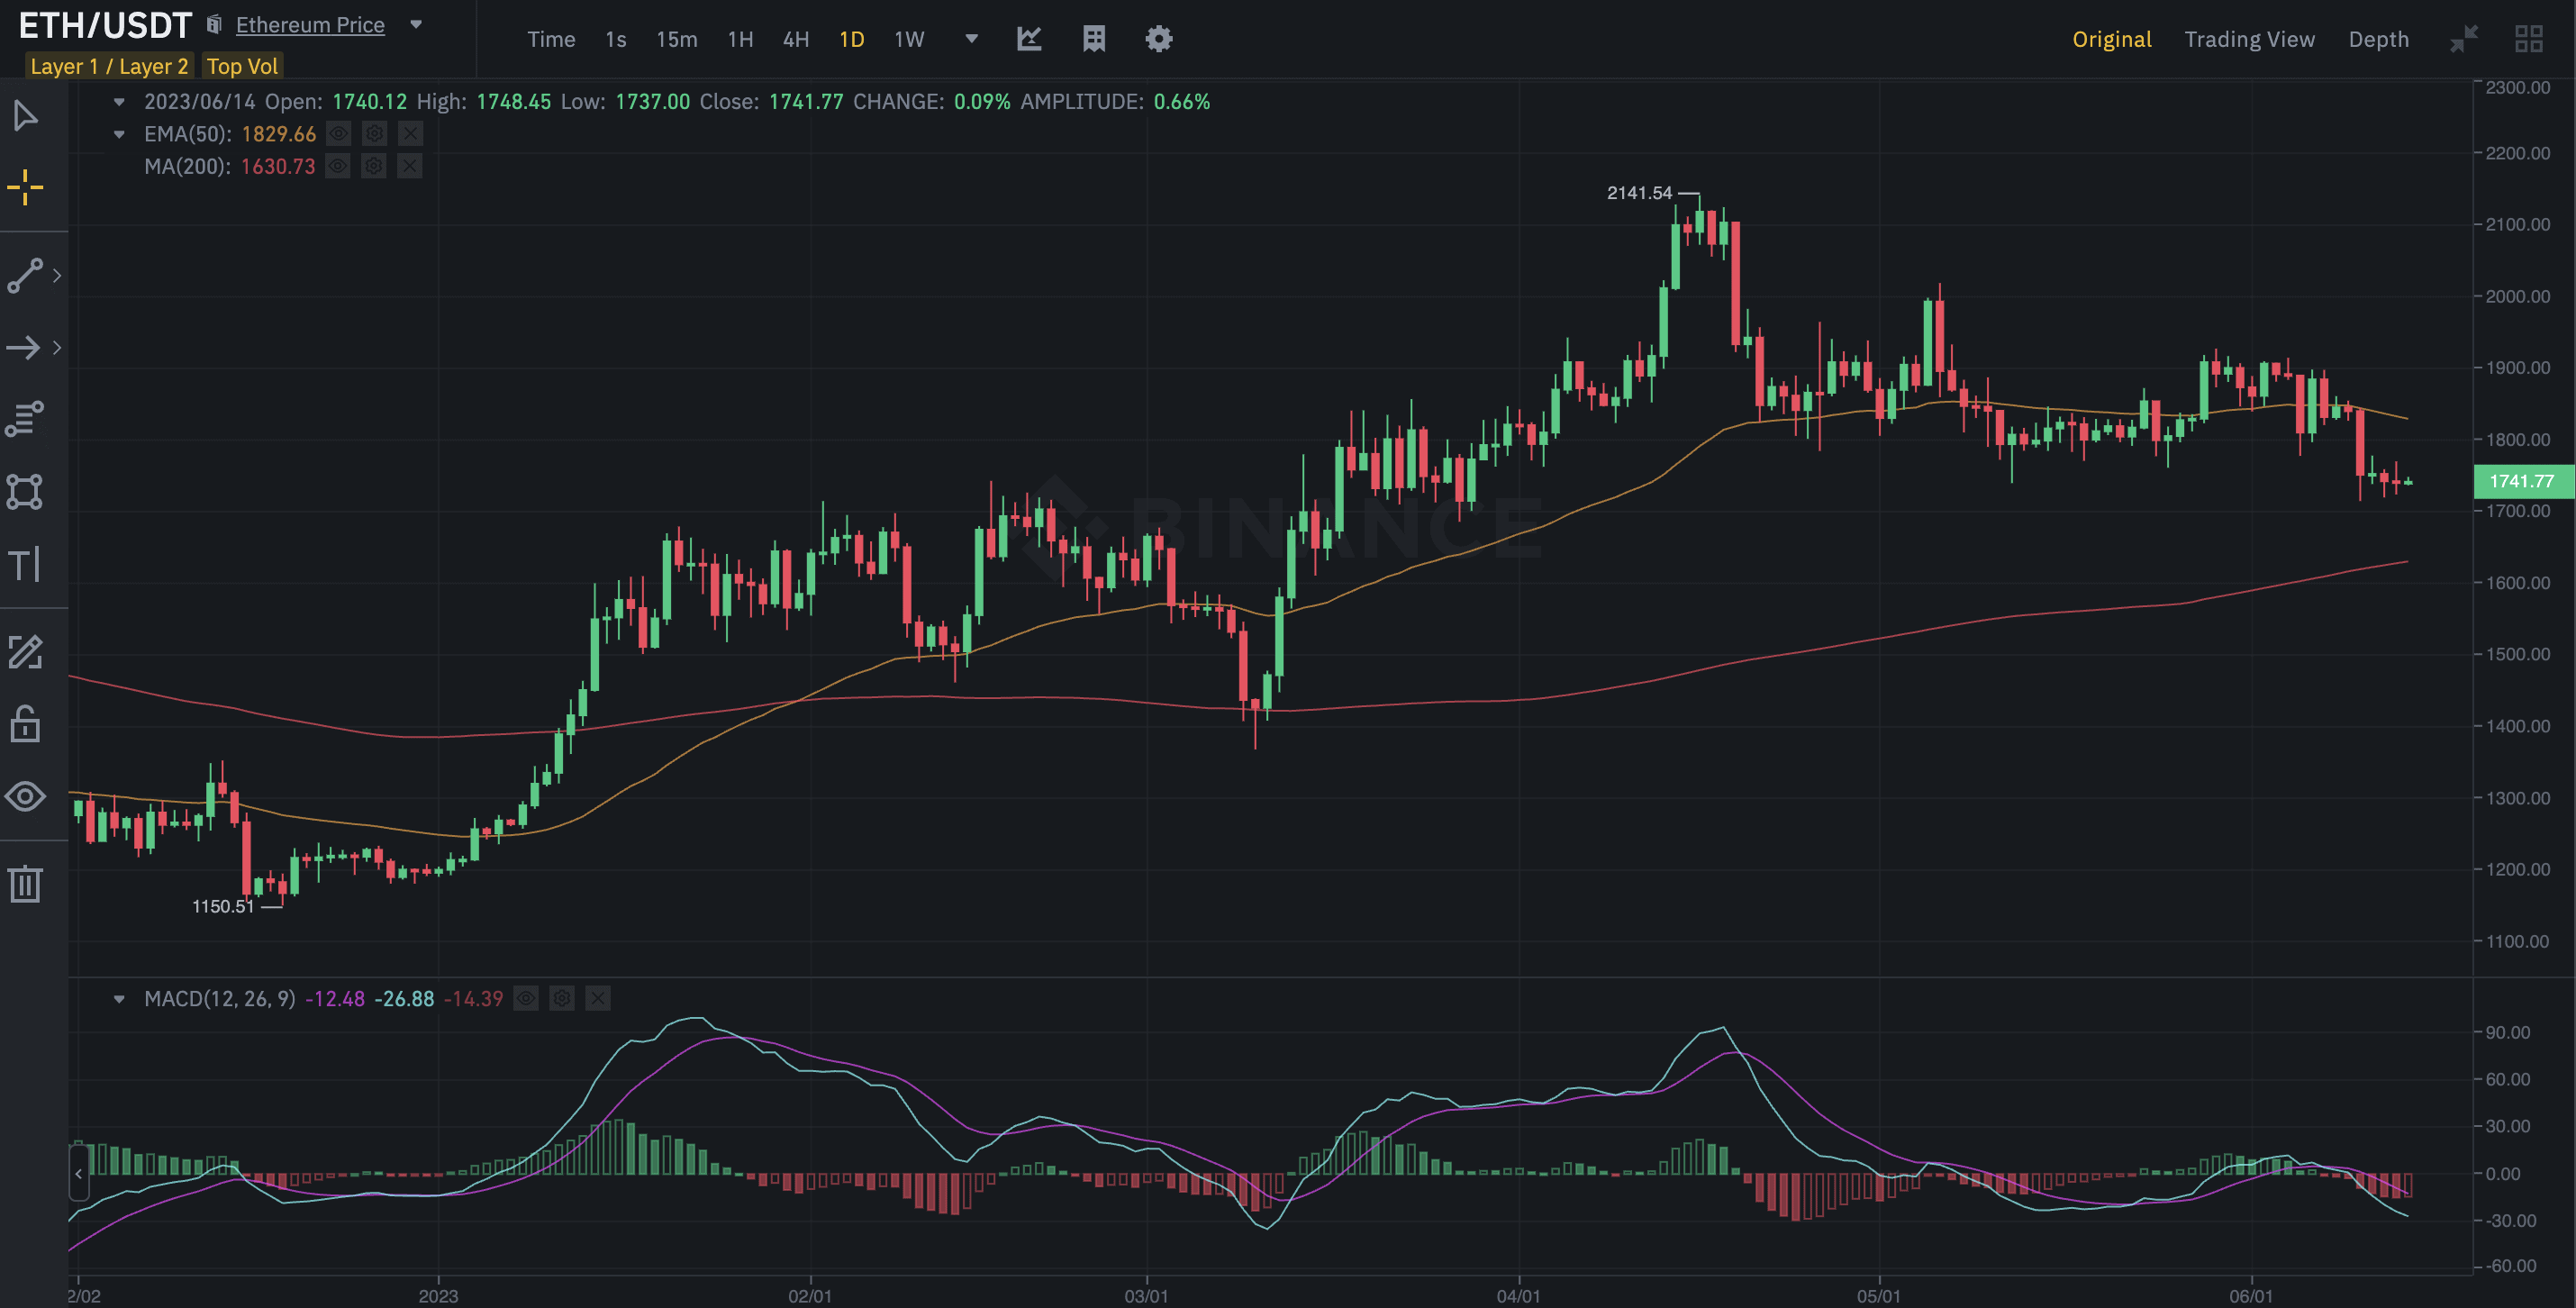
Like RSI divergence, bullish MACD divergence at the crossover point can validate the bullish move.
It is worth noting that RSI and MACD divergences, bearish divergences to be exact, can even help with short-selling. You need not wait for a death crossover to happen — the short-term moving average to cross under the long-term moving average to identify short-selling opportunities. Strategies like “Mean Reversion” can make use of bearish MACD divergence to find the zones where the bullish trends stop and bears start coming in.
Combining golden cross with other technical indicators and patterns
We saw that golden crossovers work well with RSI, MACD, and volume indicators. Yet, there are a few more patterns and indicators that can help you validate the MA crossing signals better. Here are six additional strategies.
Golden cross and Bollinger Bands
In technical analysis, Bollinger Bands are like volatility identifiers, comprising Simple Moving Average lines along with two upper and lower standard deviation lines.
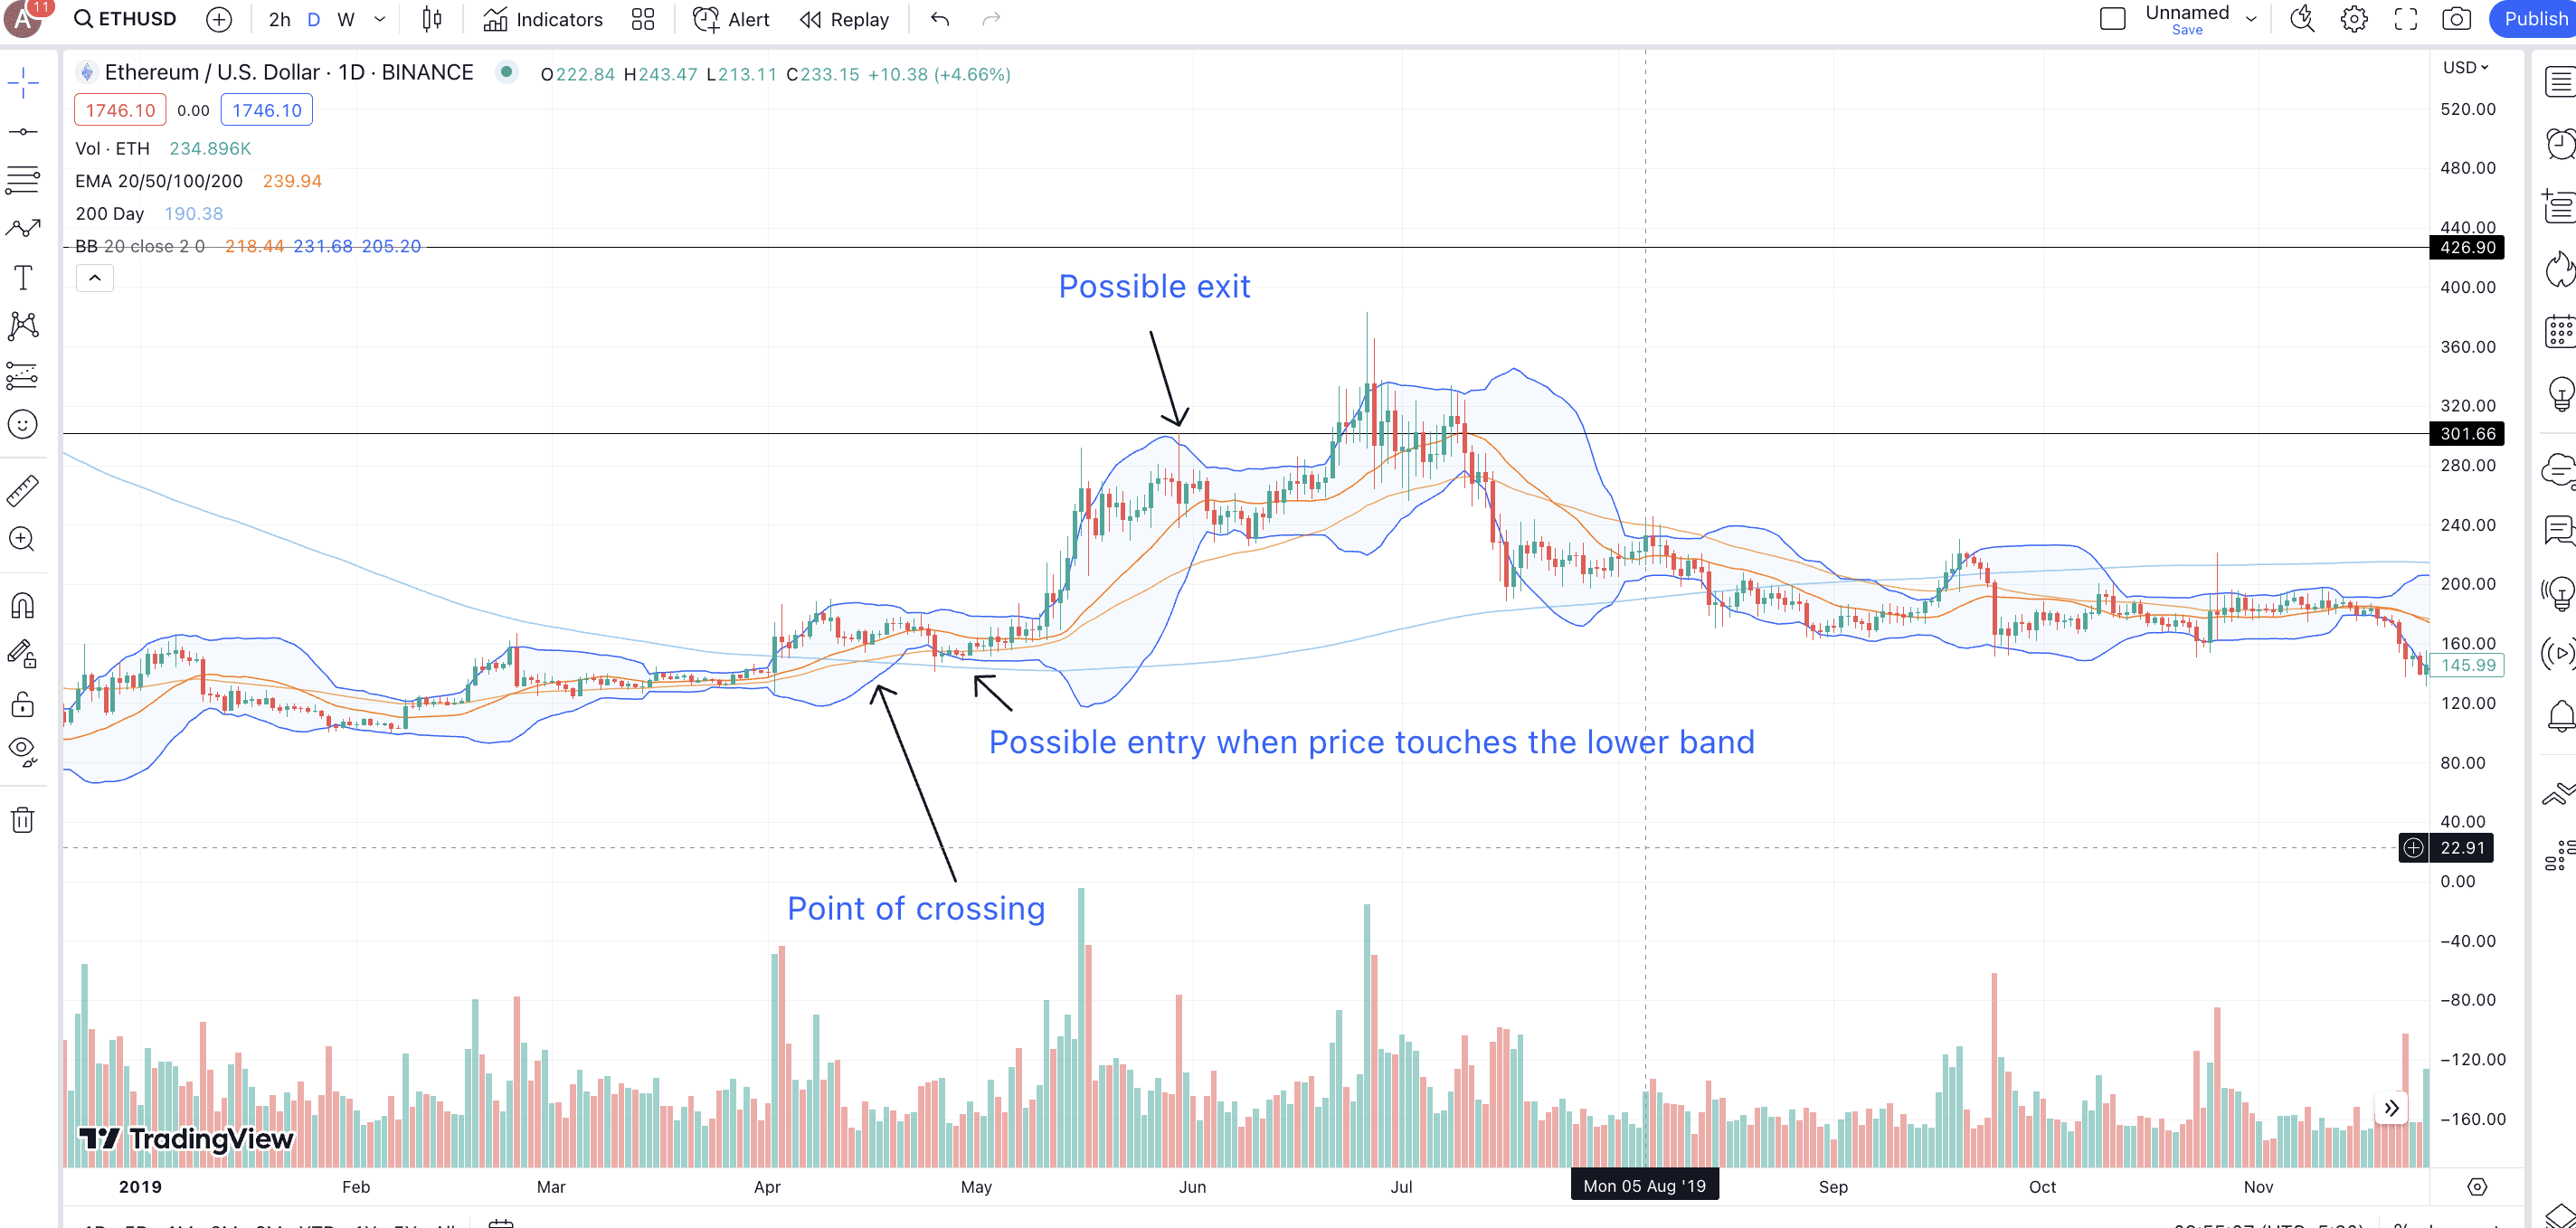
These bands contract and expand based on market volatility.
Here is a quick way to trade this strategy:
Entry
- Identify the point where the actual MA crossing happens.
- Once there, superimpose the Bollinger Bands indicator on it.
- When the price takes support at the lower band of the Bollinger Band indicator, you might consider an entry.
Exit
- A good exit could be when the price touches the upper band of the Bollinger Band indicator.
- If you prefer to take more risk, you can always consider placing an exit order or stop loss below the middle band of the indicator.
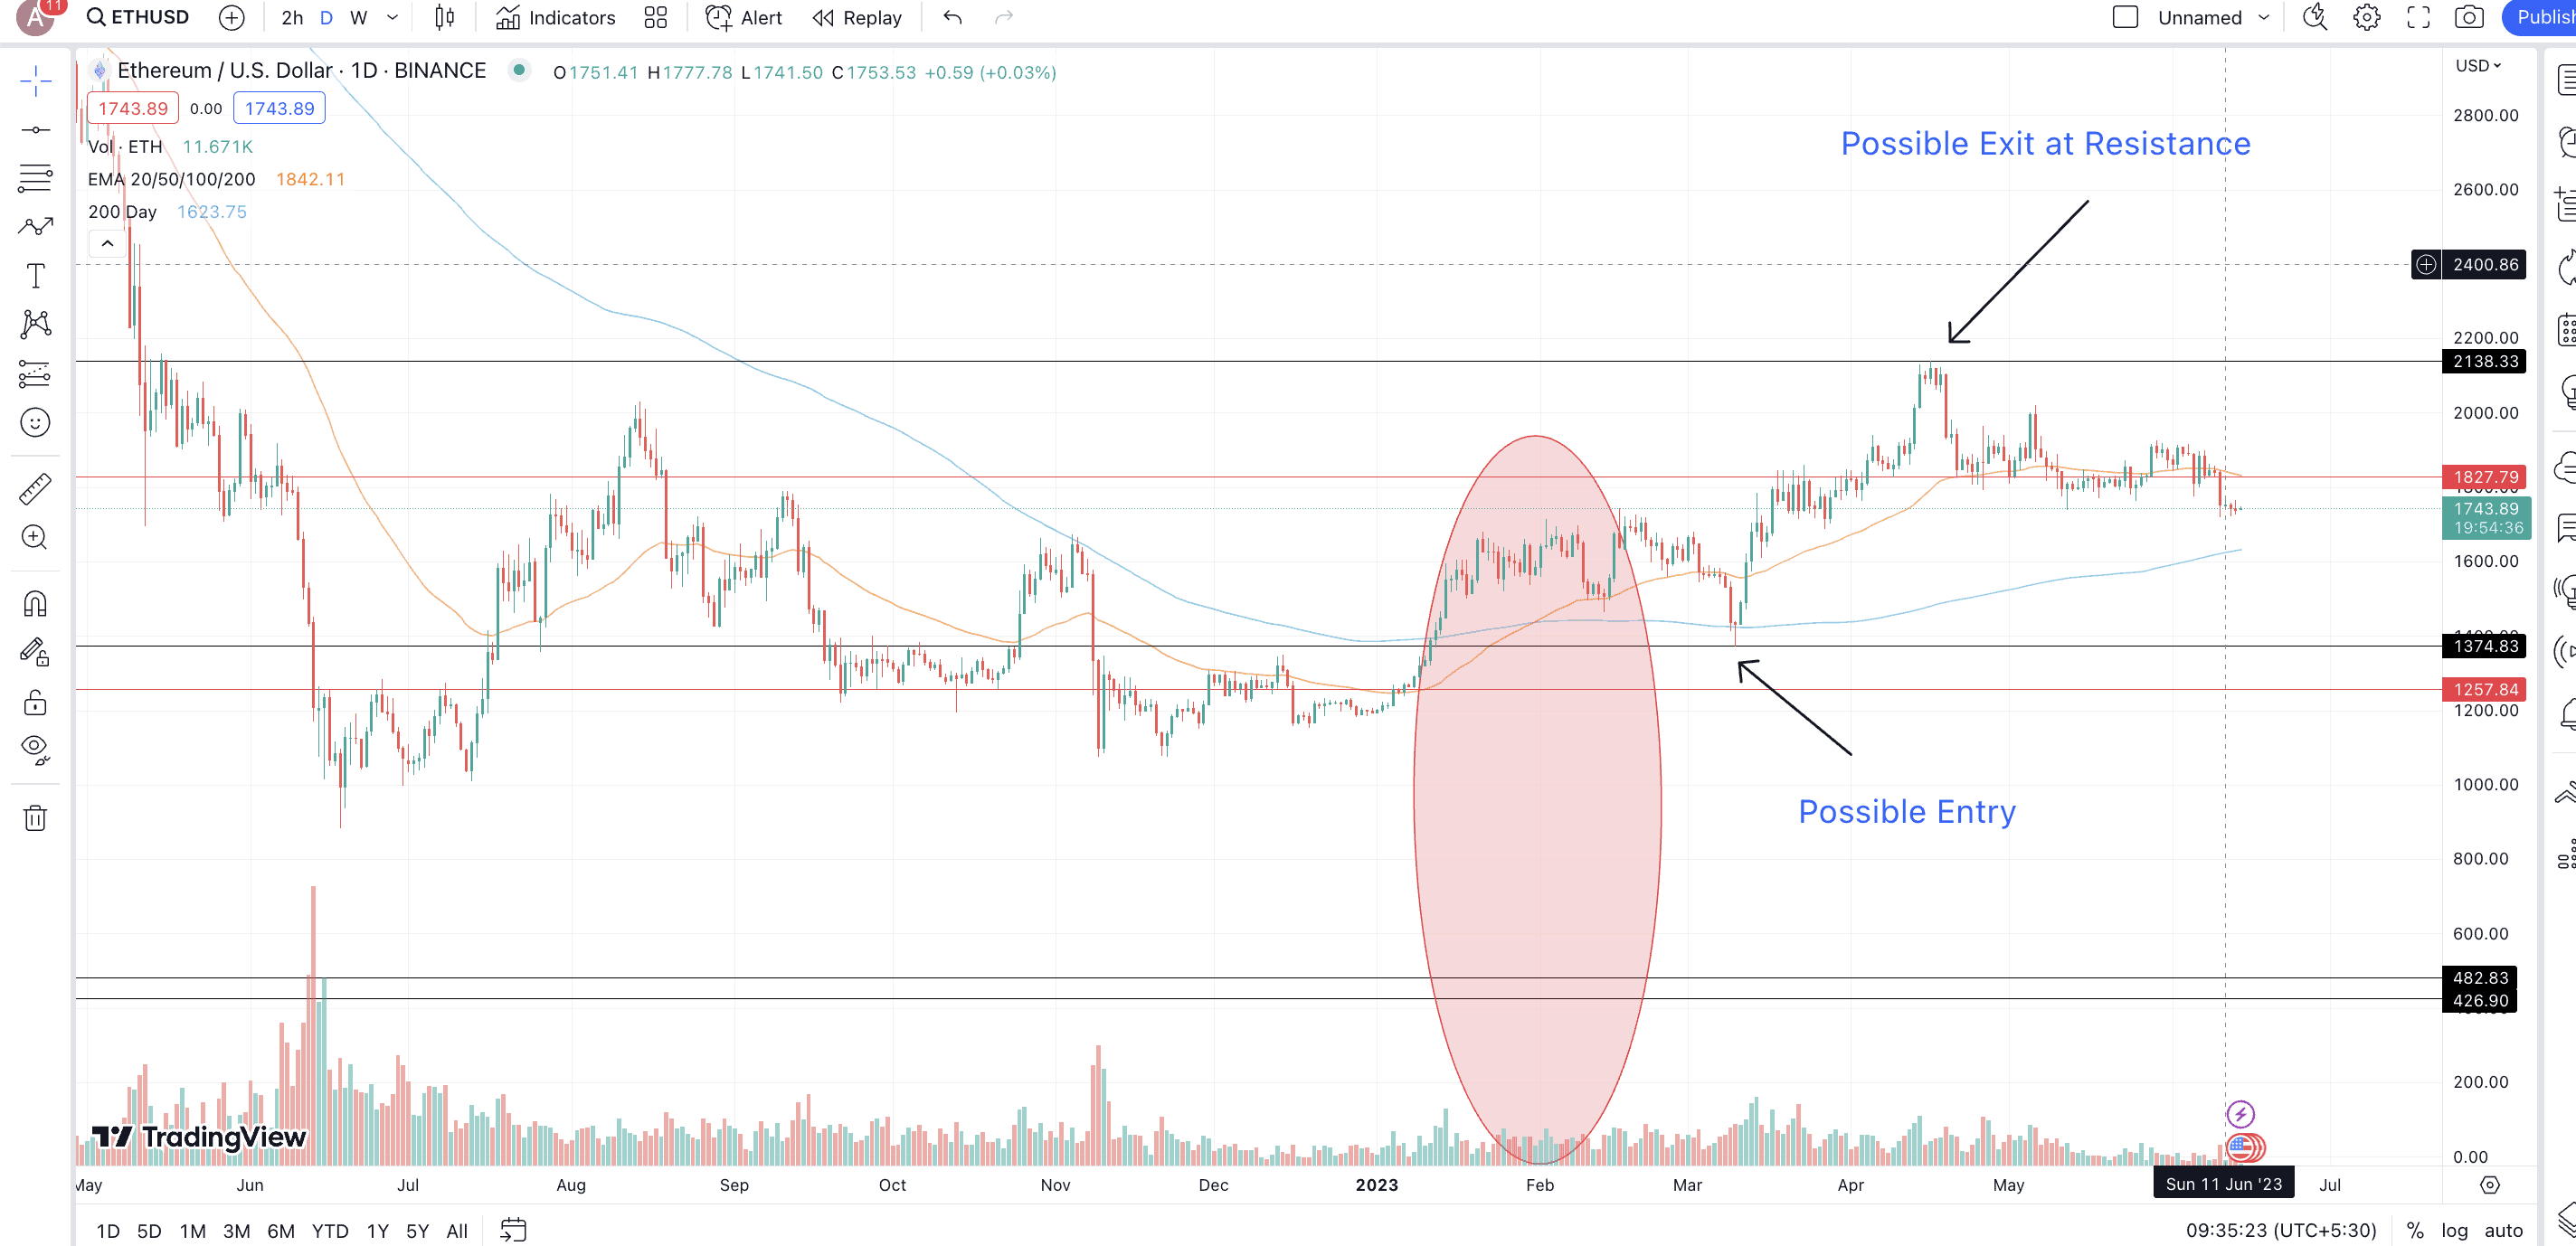
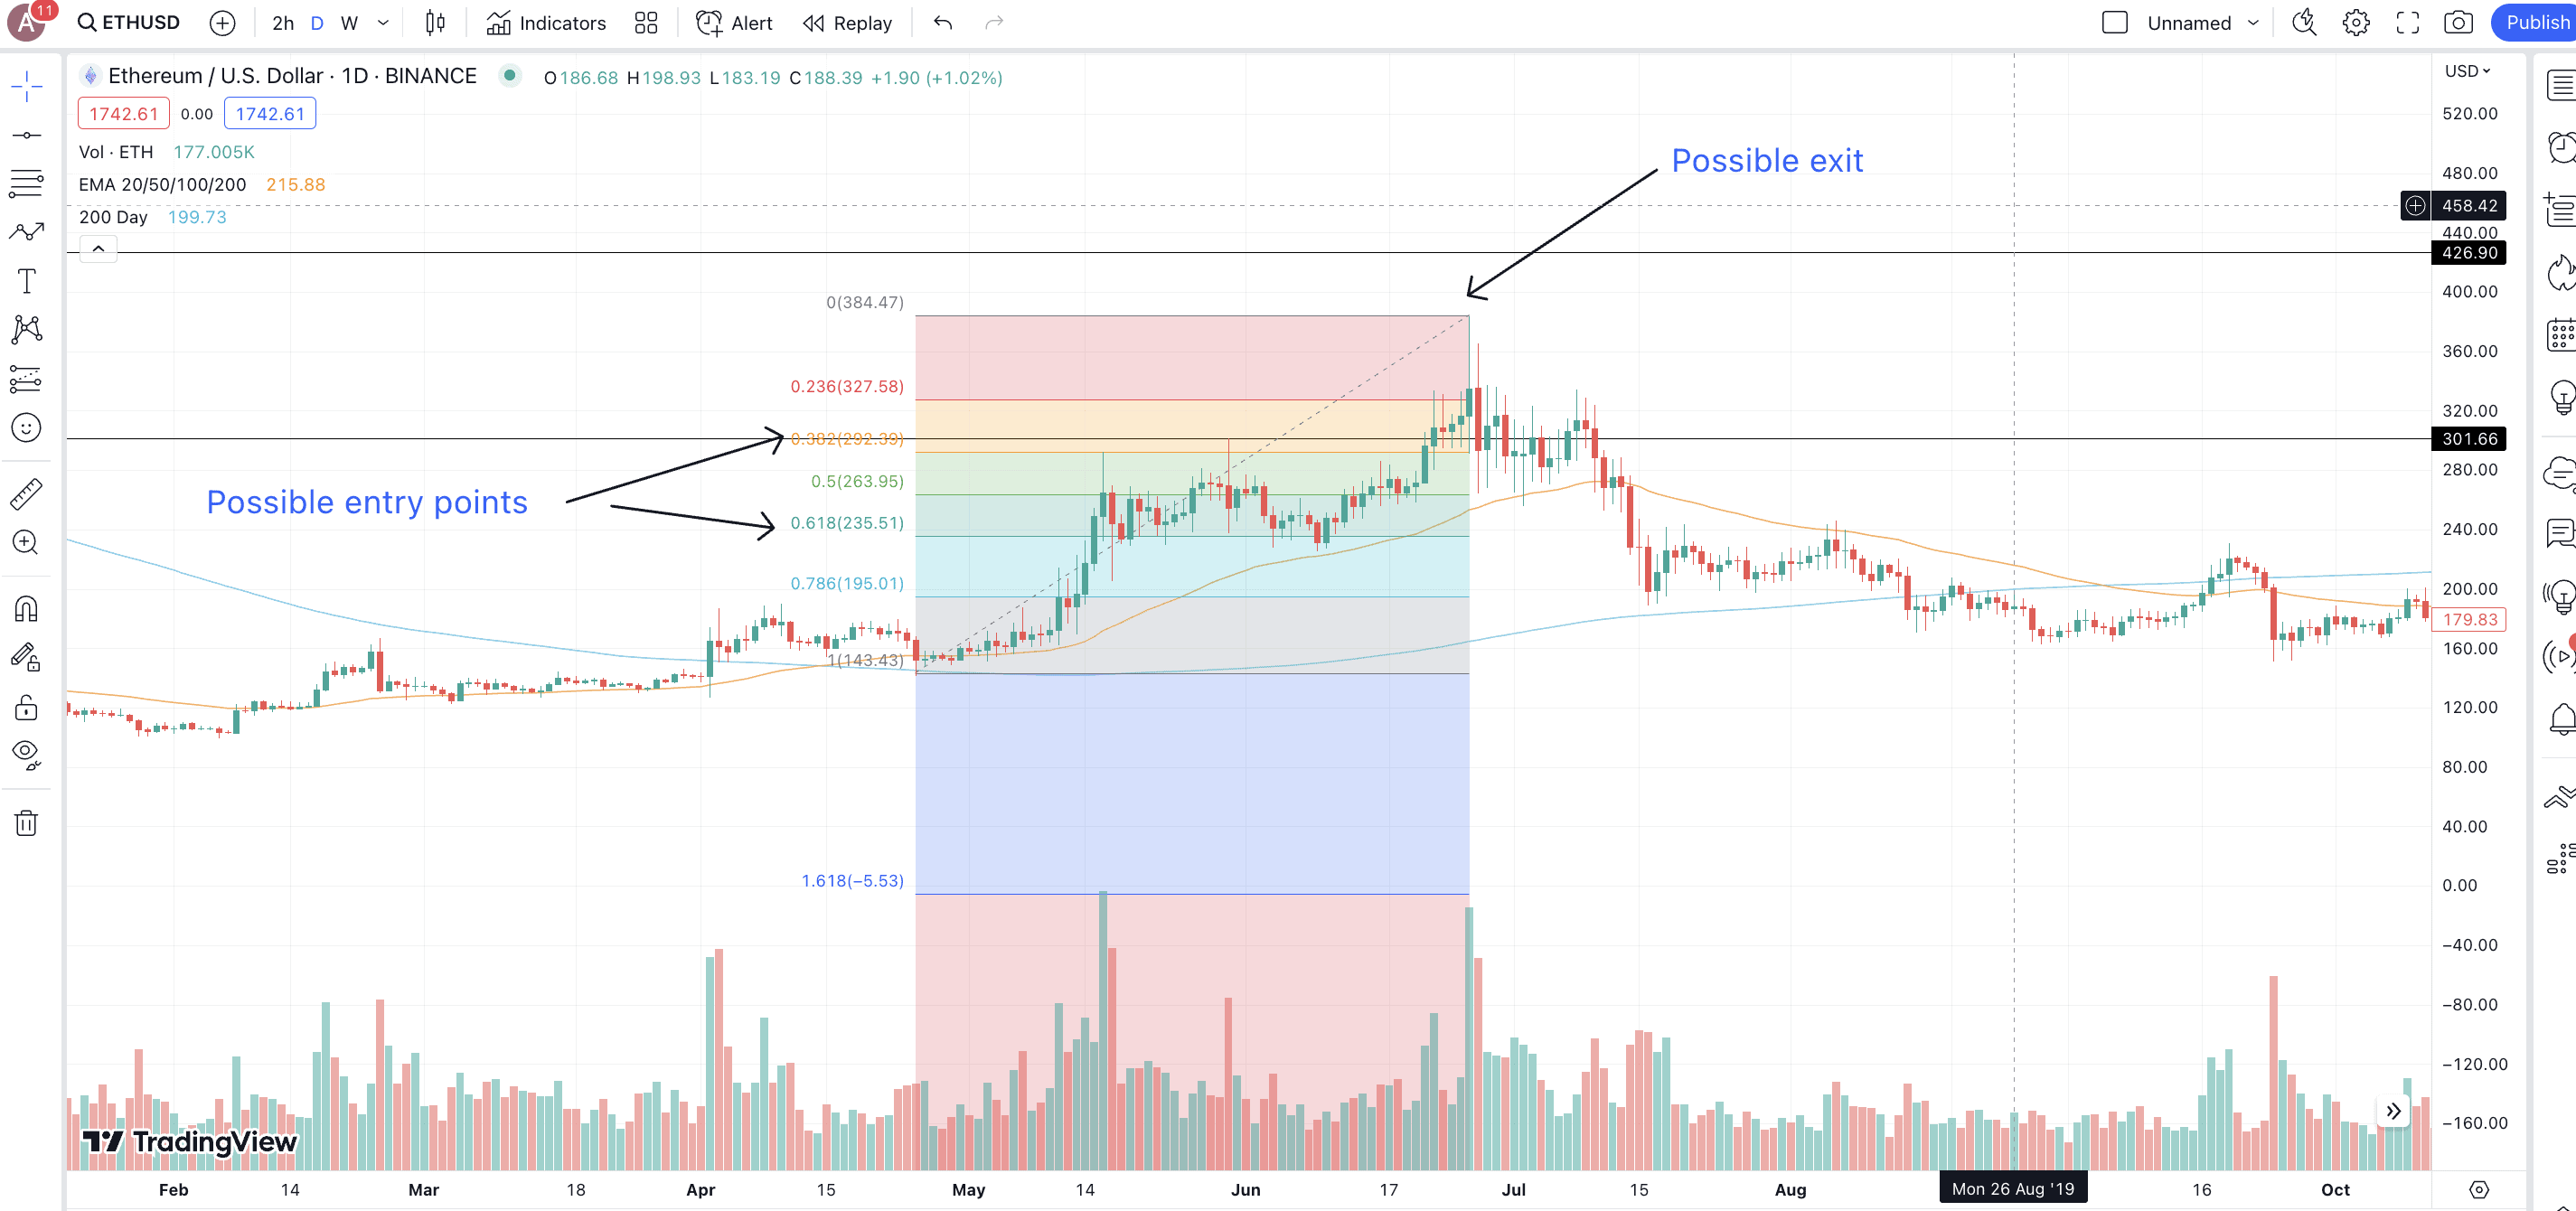
Golden cross and Fibonacci retracement levels
You can always use the Fibonacci retracement tool to locate the hidden resistance and support levels associated with the price chart.
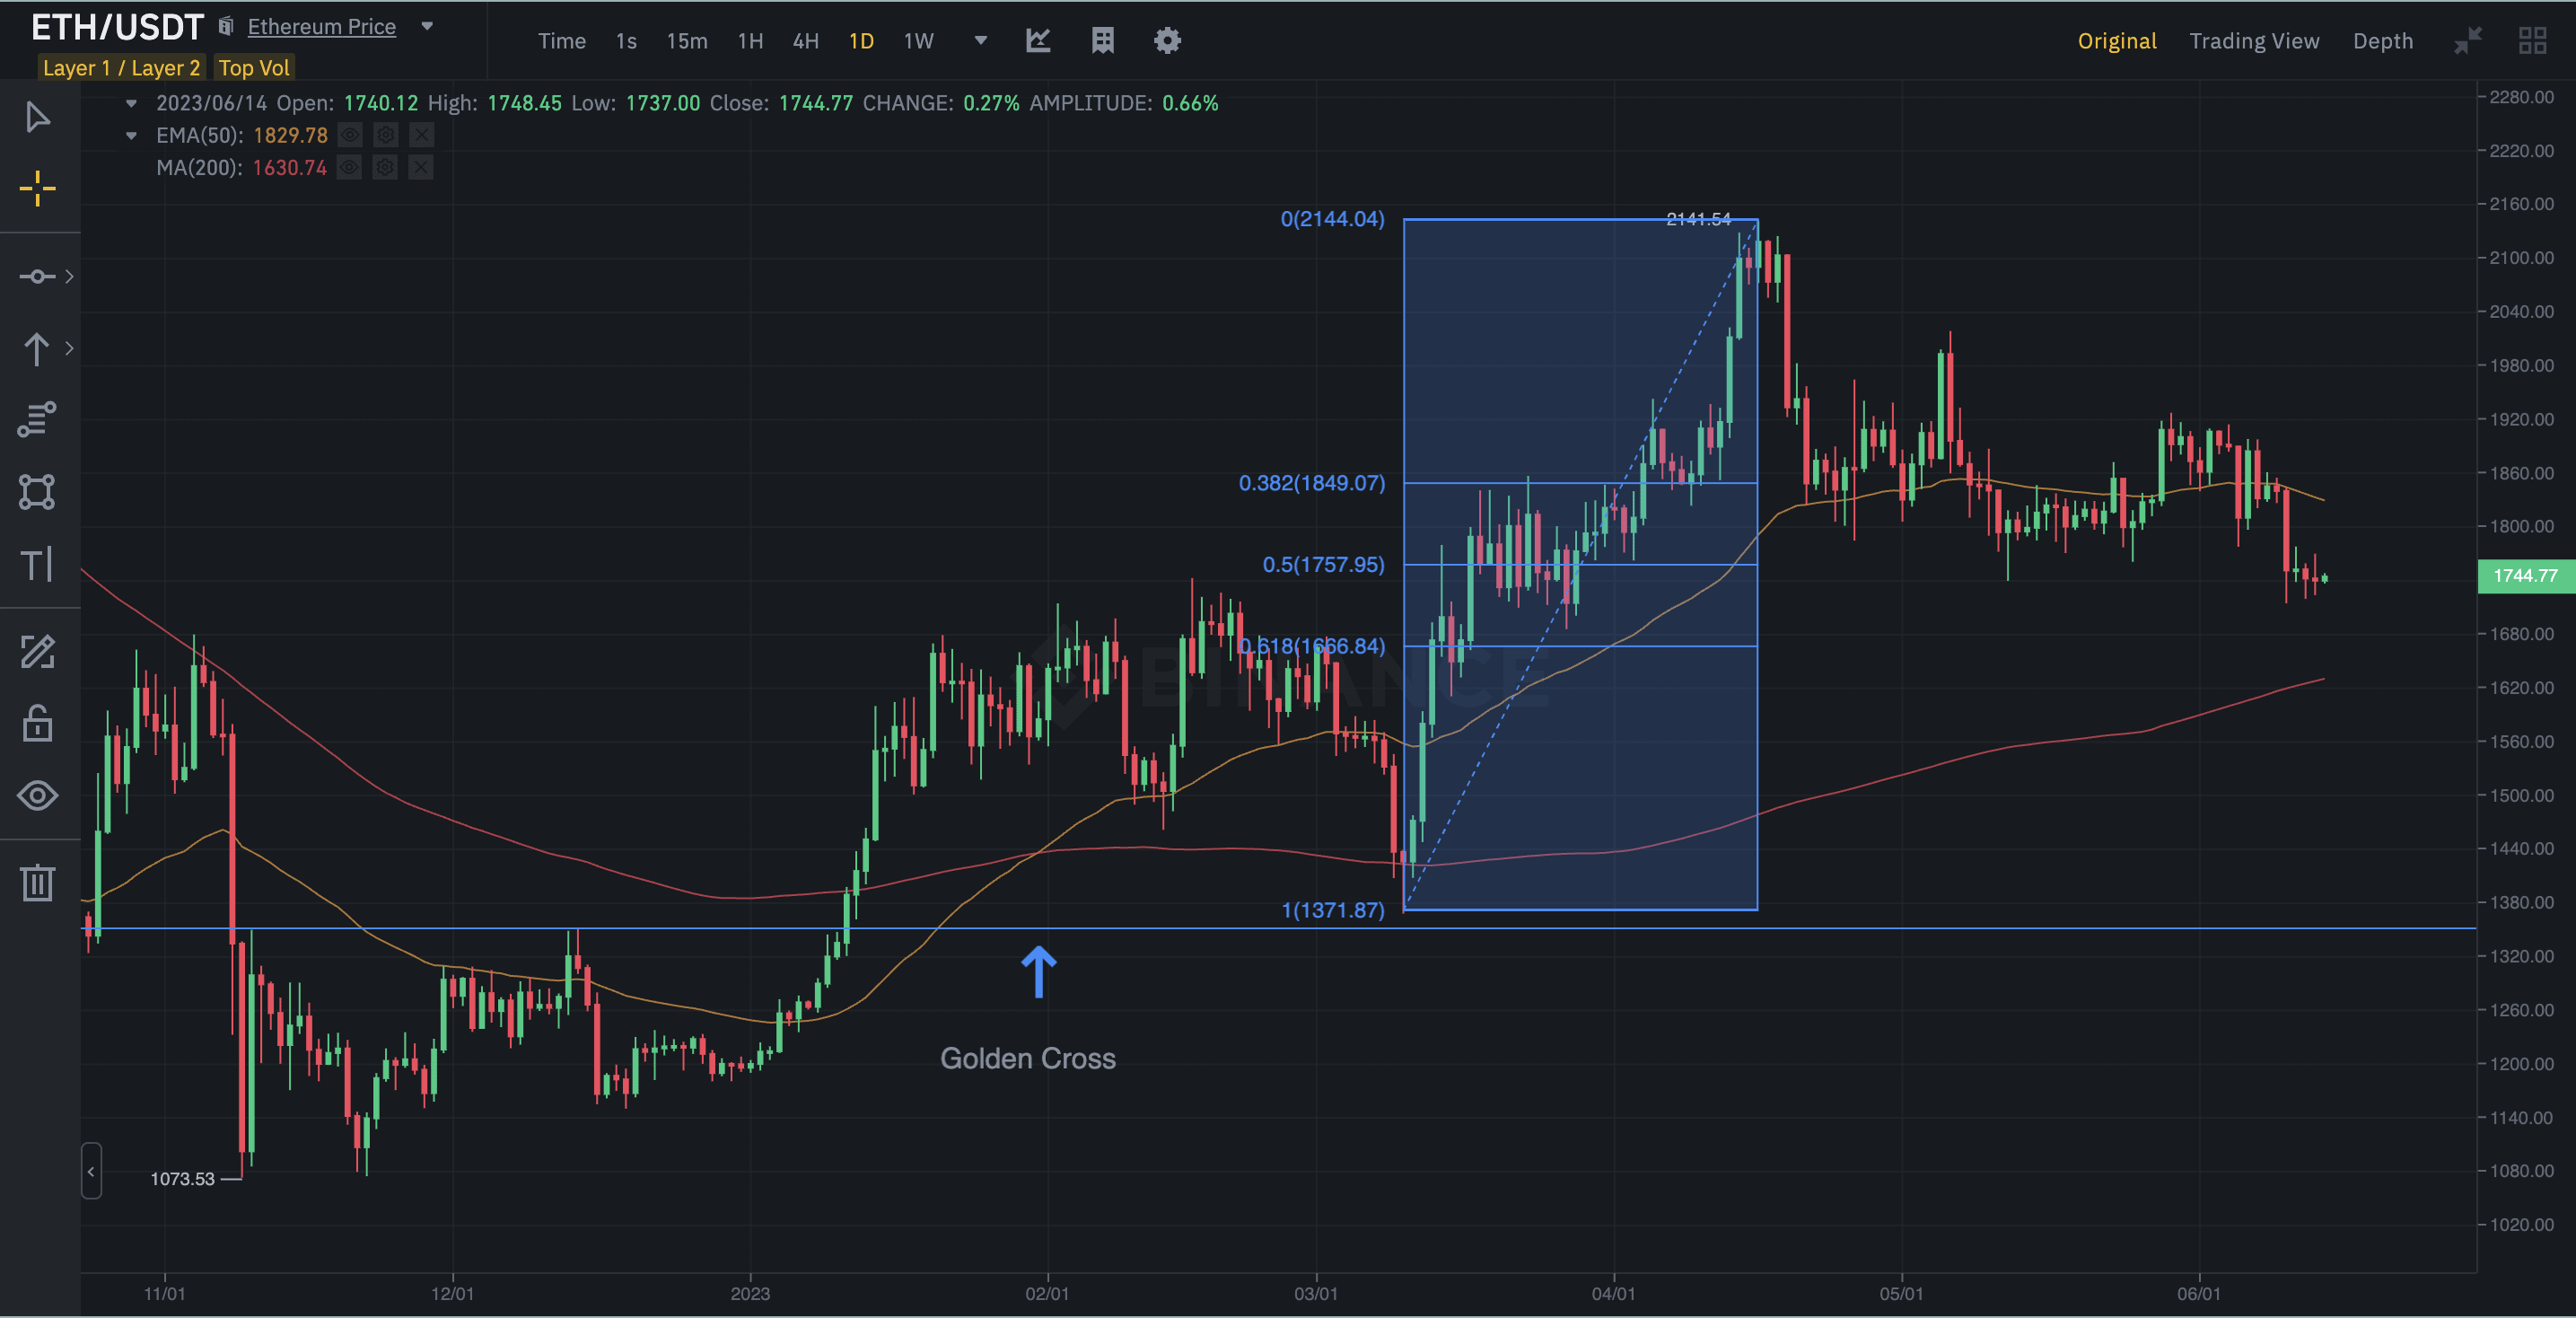
And if you are confused about drawing the retracement levels correctly, aim to connect the swing low to the swing high, post the golden crossing.
To trade, you can follow this plan:
Entry
- Once you have identified the crossing, connect the swing low and the swing high using the Fib indicator.
- Possible entry levels could be when the price pulls back to the 0.618 or the 0.382 levels, post the golden crossover. Every other Fib level is worth respecting, and you can consider entering the trade at any point, provided the volume confirms the same.
Note: In the chart we used, the price of ETH respects the Fib levels and never breaches the 0.78 mark before the Fib analysis is complete.
Exit
- If you are planning to exit, a safe strategy is to put a stop loss immediately below the Fib level where you entered the trade.
- If not, you can exit the trade when the price moves to the previous high or the 0% Fib level.
Golden cross with stochastic oscillator
A golden crossover signifies bullish momentum. And what could be a better indicator to pair with it than the stochastic oscillator? This indicator compares the closing price of an asset and its recent price moves.
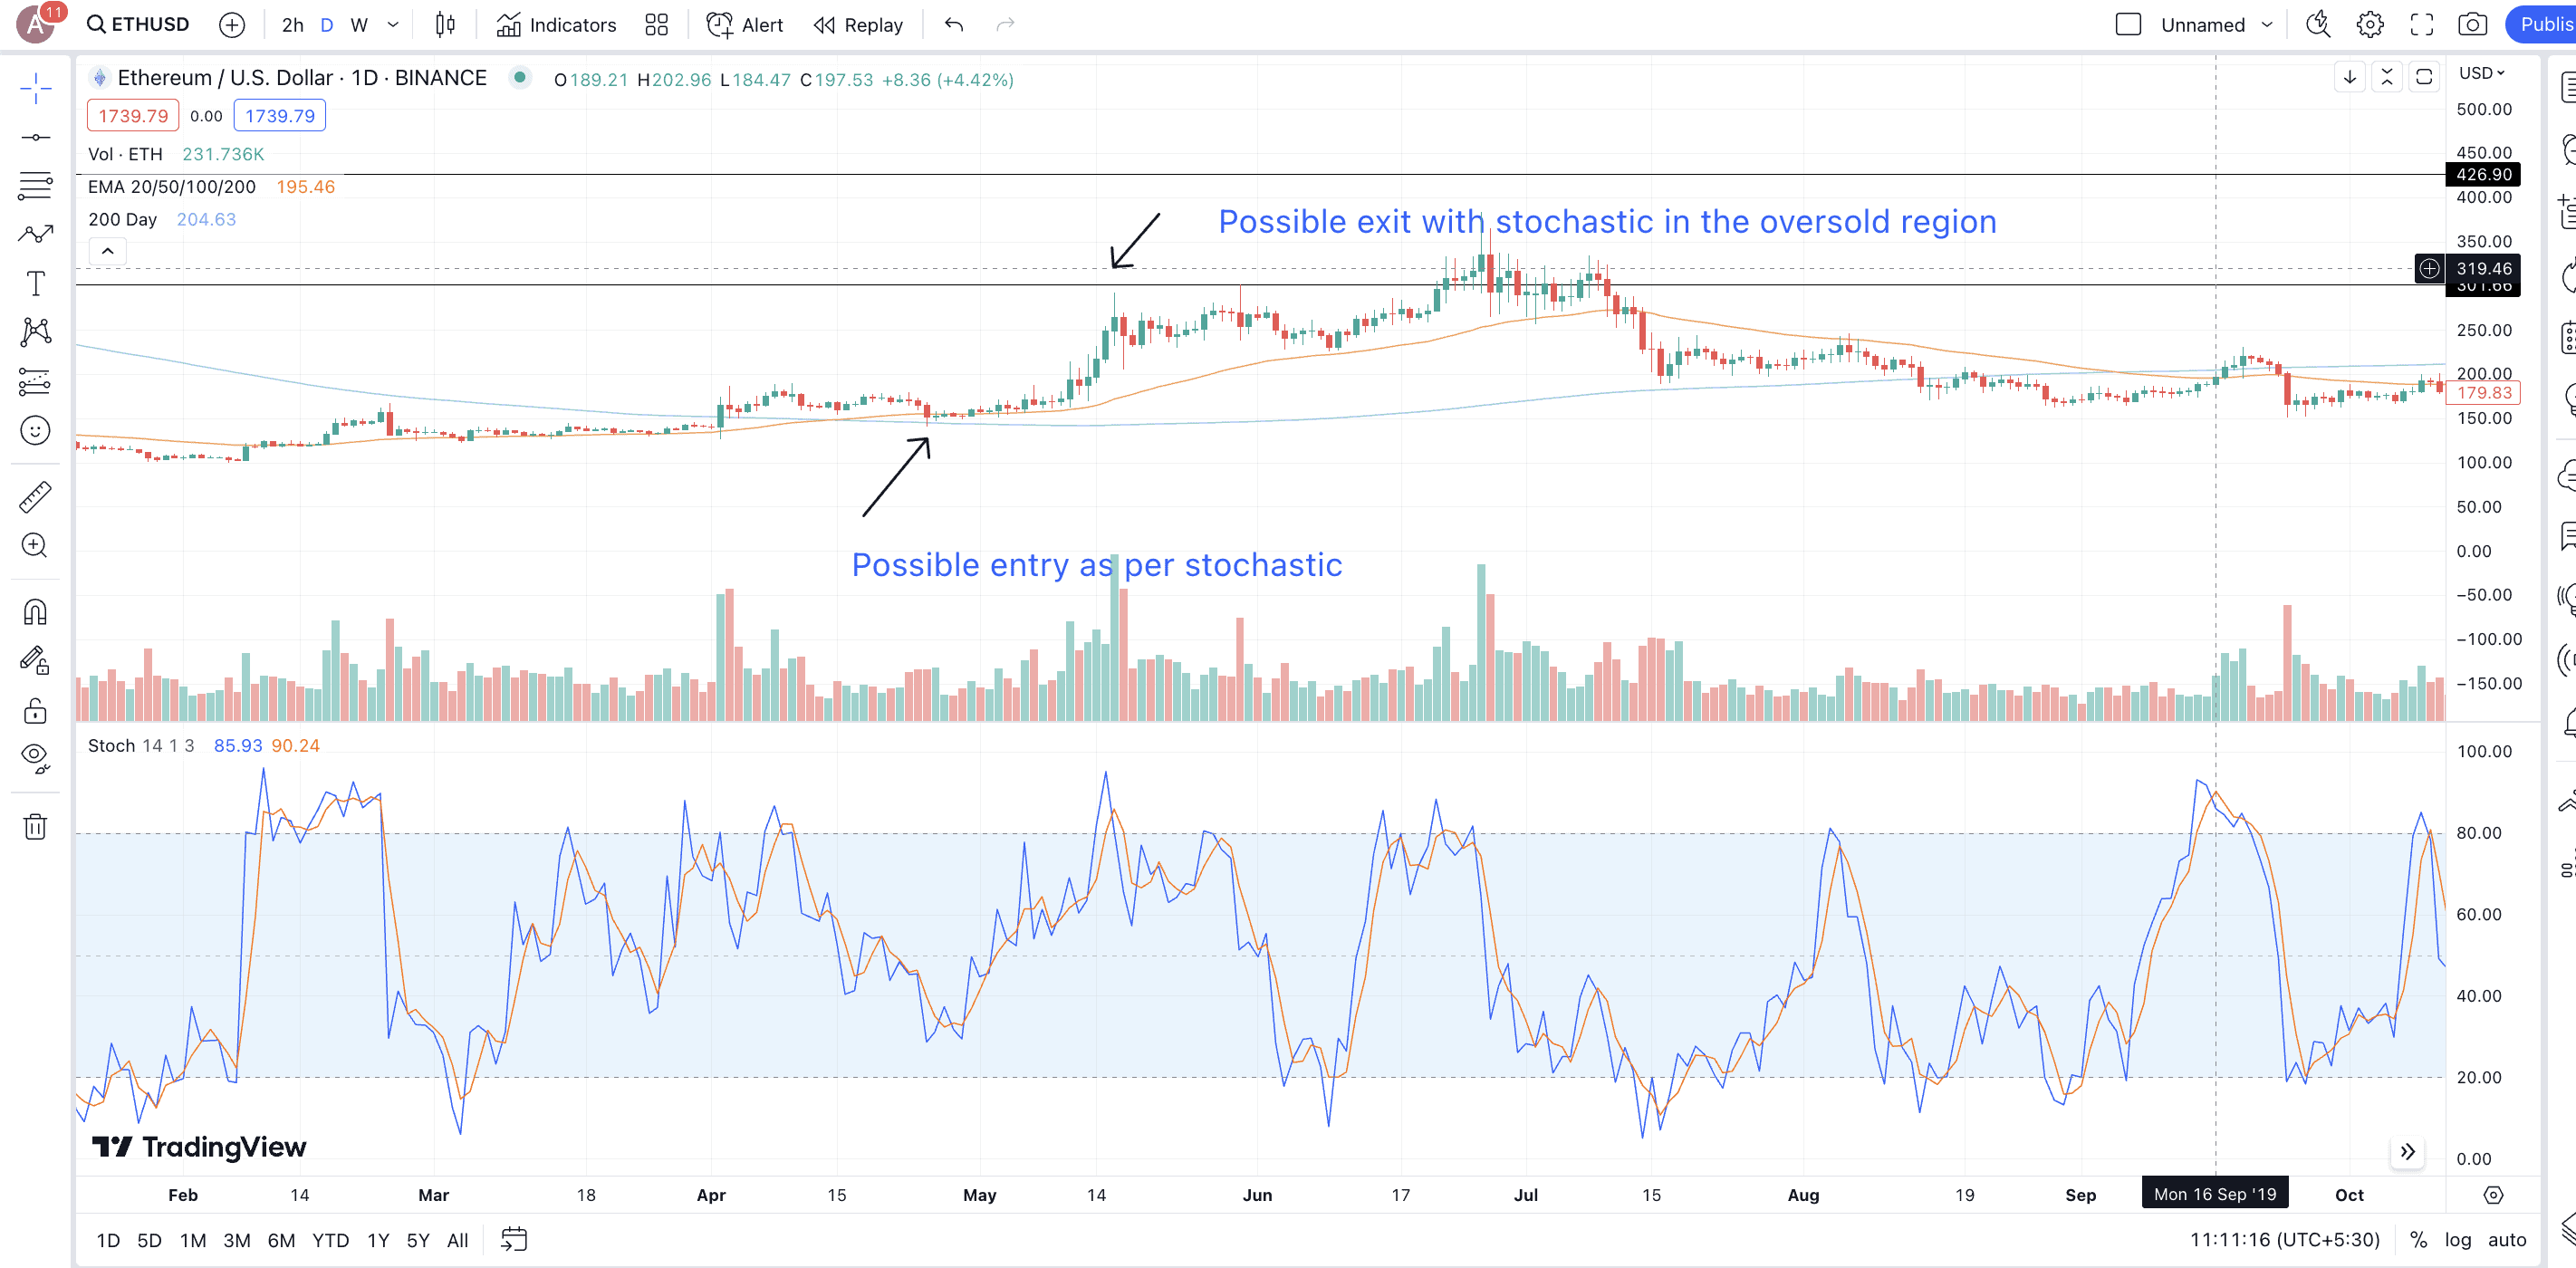
Here is how to enter a trade with the stochastic oscillator:
Entry
- Once you identified the cross, look for the level when the price coincides with the oversold stochastic zone — under 20 or under 30. That can be your entry point.
- You might consider adding more to your holdings if you see the stochastic oscillator making a bullish divergence in relation to the price. This happens when the price makes lower highs, and the oscillator makes higher highs, hinting at positive momentum.
Exit
- An ideal exit point could be when the stochastic oscillator moves to the overbought zone — above 80.
- If you are a risk-averse trader, you can also look for bearish divergence — stochastic making lower highs or lower lows compared to the price — to exit.
Golden cross and the EMA line (Carry the EMA)
This strategy can be considered an extension of the basic golden crossover strategy. If you look closely, “Carry the EMA” doesn’t allow you to take trading positions aggressively.
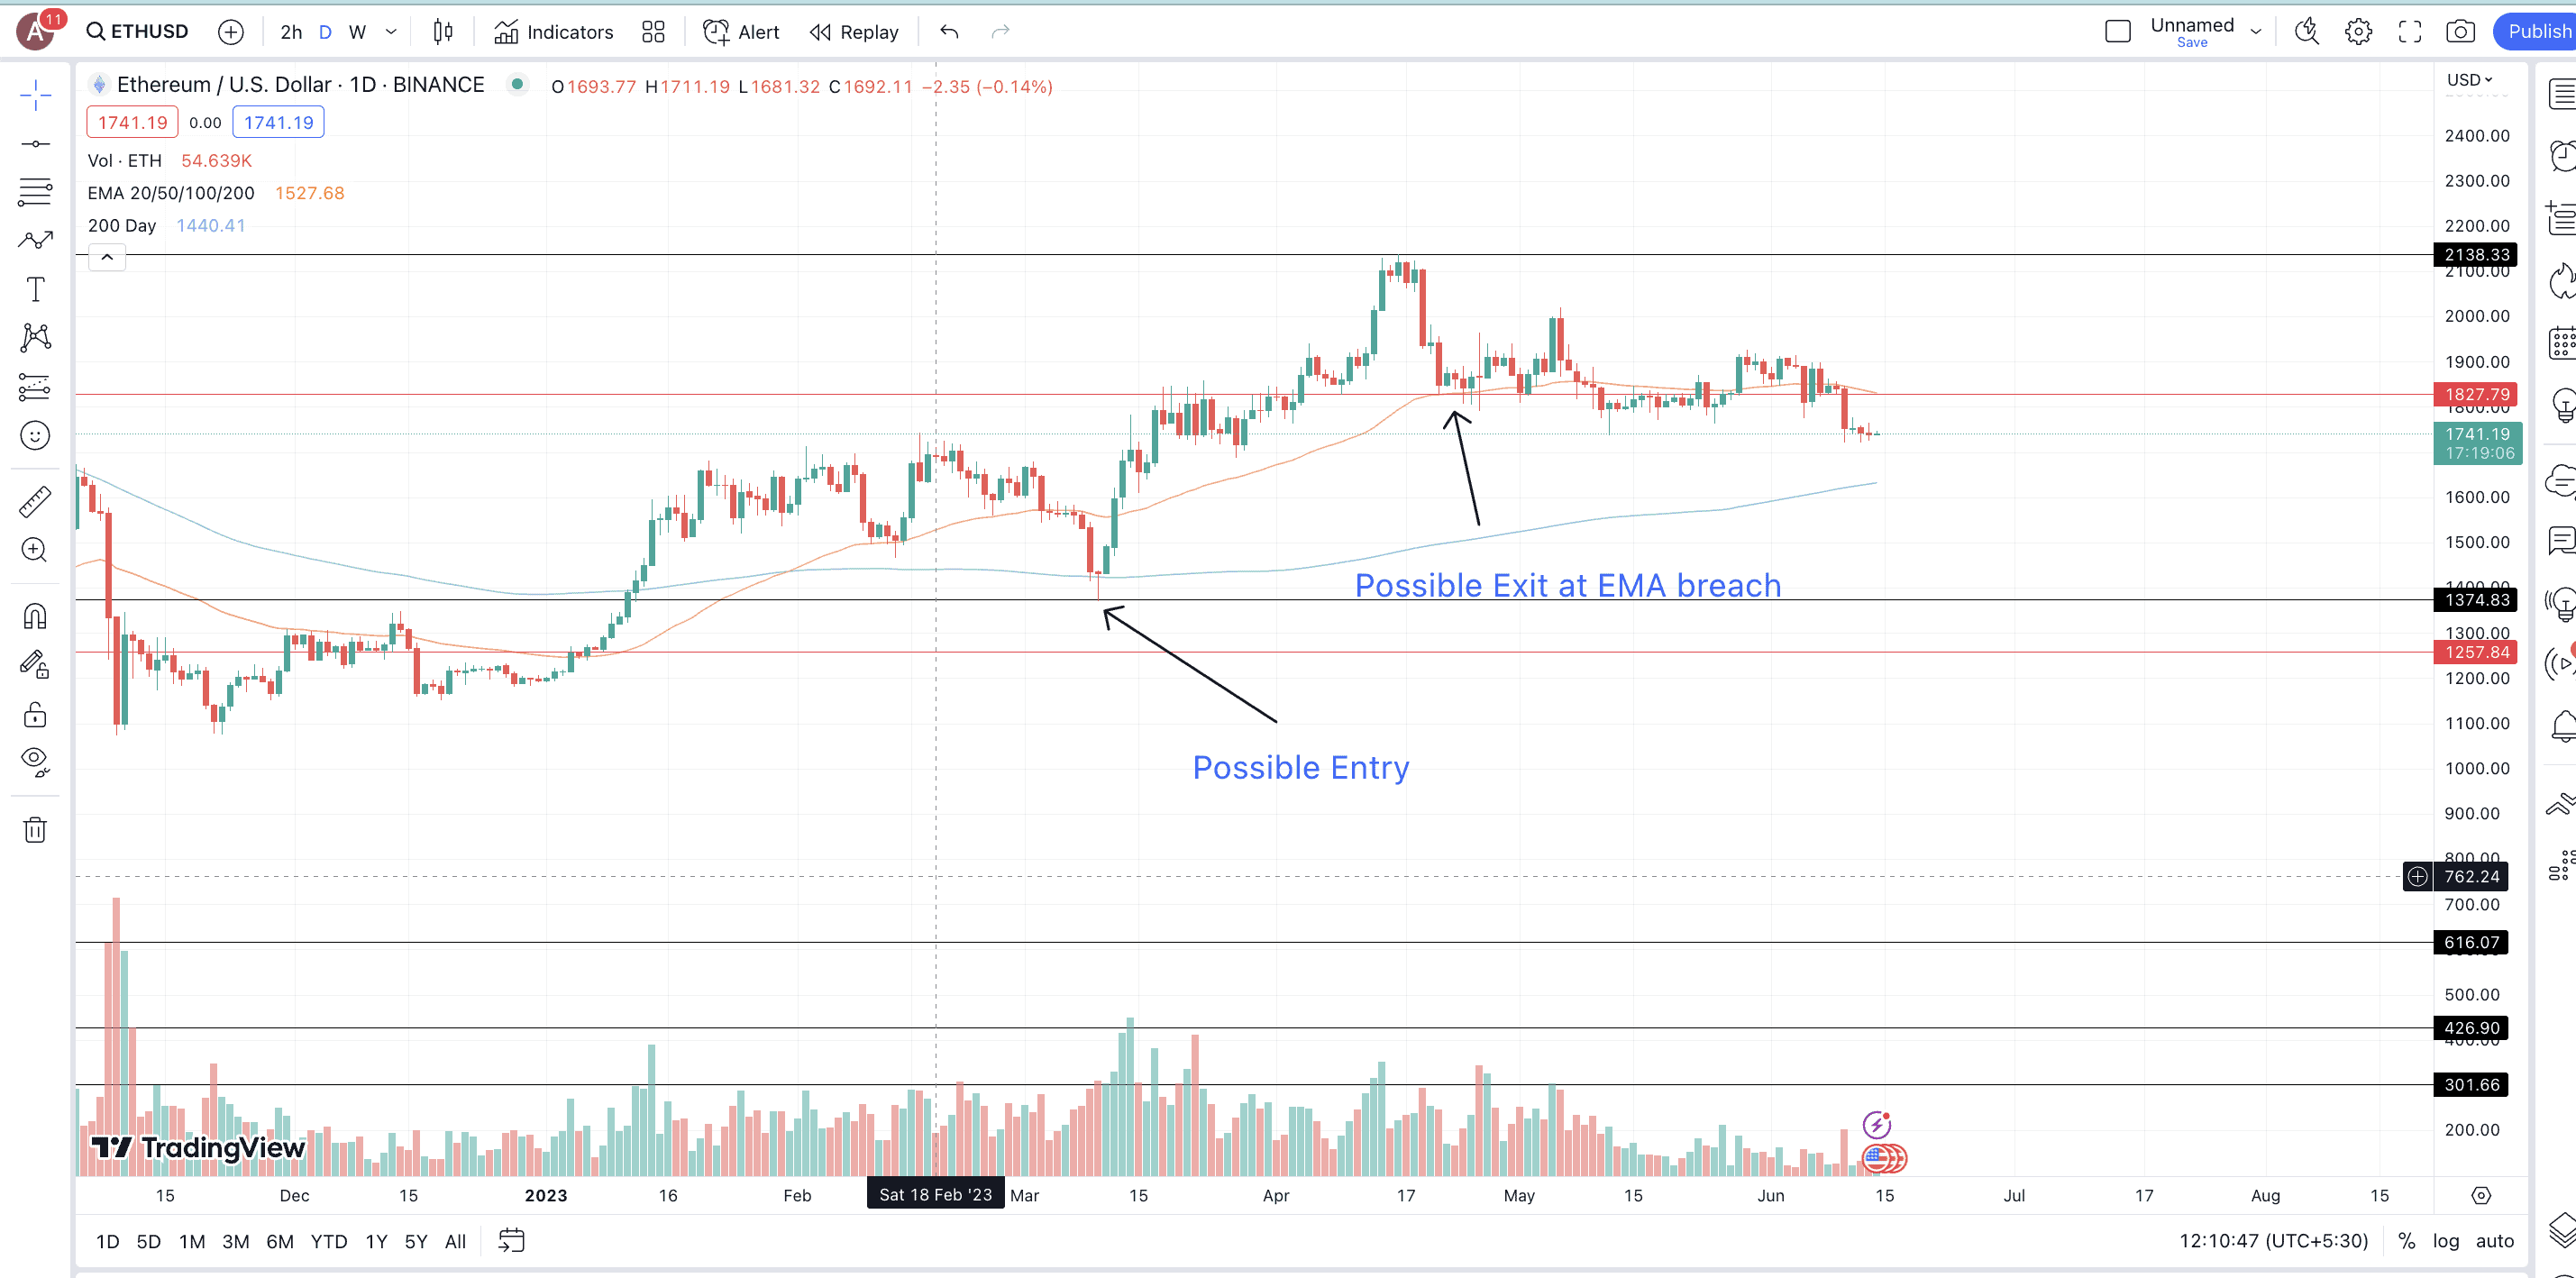
Instead, you can use the EMA line to make use of the positive momentum for as long as it exists. Here is what the trading strategy looks like:
Entry
- Once you have identified the golden cross, keep an eye on the price and its relation with the 50-day EMA. Do not exit the trade if other indicators give bearish hints. Instead, check if the price falls to the 50-day EMA lines and bounces up. That could be an indication to add more to your holdings.
Exit
- If you want to exit, place the stop loss immediately below the 50-day EMA line. Or you can use a wide range of support levels to keep tracking the EMA line.
- The “Carry the EMA” strategy lets you work with trailing stop losses. This way, every time the price of the asset moves above the EMA line, the stop loss level increases, allowing you to squeeze every bit of the positive momentum left post the crossover. You can even use grid trading strategies to place such incremental orders.
The 50-day EMA works like a dynamic resistance and support level in this case. Also, it is better to use this strategy in conjugation with the pullback strategy. That way, you can get better entry levels.
Golden cross with a flag pattern
A bull flag is a trend continuation pattern, whereas the golden crossover hints at a trend reversal. Therefore, in most cases, a bull flag shows up a while after the crossing forms. Also, a bull flag is more of a tool to help the trader in your maximize profits, as it can distinguish a strong crossover from a weak one.
Here is how to trade this strategy:
Entry
- Once a bull pattern shows up post the crossing, you can consider entering if the price breaches the upper trendline of the flag.
- A good practice is to confirm the breakout with a rise in volume.
- Or, you can wait for a retracement from the upper trendline to get some additional confirmation.
- Once there is a breakout, you can use the Fib indicators to assess the possible profit targets.
Exit
- According to how a usual flag and pole pattern behaves, you can exit the trade once the profit target — the length of the pole from the breakout zone — is reached.
- You can exit the trade even if a death crossover is forming or the price falls below the flag’s lower trendline.
Using the Golden Cross with a flag pattern is similar to the “Breakout strategy.”
Golden cross with double bottom
The idea behind a double bottom formation is that the asset tries to resist a drop. And this idea can pair really well with a golden crossover.
Here is how you might proceed:
Entry
- Do not immediately enter the trade once the moving averages cross. Instead, wait for the price to go below the 50-day EMA line, forming a bottom.
- Once two bottom formations are secured, you can consider entering the trade with the entry placed above the 50-day EMA.
- If the EMA line is far off and you want to enter early, you can consider a level immediately above the asset’s neckline.
Exit
- You can exit the trade once the profit target is reached or if the price drops below the second bottom. This would invalidate the bullish trend.
- A death crossover can also trigger an exit.
In addition to these strategies, you can even pair a golden crossover with other bullish signals like the ascending triangle, the principles of mean reversion, and more. Regardless of which strategy you use, it is better to validate signals by looking at multiple indicators and patterns.
Can a golden cross predict a bull market?
A golden cross is a reliable technical indicator used to determine the onset of a bull market. However, after a bear phase, it is best suggested to leverage a golden cross for determining a bullish signal and not a bull market.
As this indicator relies heavily on the 50-EMA and 200-SMA, it is still skewed toward recency. Therefore, a golden cross is better at helping you reach a short- to mid-term decision rather than a long-term one with a broader market view.
A “golden” pass to better trades?
The golden crossover, the crossing of the 50-day EMA above the 200-day SMA, is indeed a reliable indicator. It gauges the bullish sentiments well. Yet, to use it to its fullest, you must go through every supplemental trading strategy and implement the most fitting one(s). This approach gives more context to this bullish signal and helps differentiate a bullish crossover from a false one.


