


In crypto trading, the risk-to-reward ratio isn’t always trend-specific. Good traders prefer riding trends — bullish or bearish notwithstanding. Great traders keep a close eye on rangebound price action to maximize gains. And that strategy is at the core of the Wyckoff pattern — the visual foundation of the popular Wyckoff Method.
This article deciphers the Wyckoff pattern for you, phase by phase. We identify the market structure leading to the Wyckoff pattern. Then, we detail each phase of the pattern, covering technical analysis and market entry strategy. Here’s everything you need to know about Richard Wyckoff’s innovation.
BeInCrypto Trading Community in Telegram: read all the hottest news of the crypto world, get technical analysis on coins & answers to all your questions from PRO traders & experts!
- Making sense of the Wyckoff pattern: it’s easier than you think
- Three laws governing the Wyckoff Method
- Relevance of the Wyckoff Method
- The “Wyckoff” background: history, principles, and more
- The Wyckoff Method deep dive: stages, market dynamics, more
- The role of market dynamics in the Wyckoff Method
- Wyckoff patterns: key points for better predictions
- Evaluating the market strength: complementing Wyckoff
- Analyzing the market’s readiness
- Timing the trades right with the Wyckoff Method
- How to apply the Wyckoff Method?
- Limitations of the Wyckoff Method
- Is the Wyckoff Method a means to an end?
- Where can I use the Wyckoff Method?
- Frequently asked questions
Making sense of the Wyckoff pattern: it’s easier than you think
The Wyckoff Method for crypto trading is a simple yet elaborate method to predict market movements. Unlike tracking price reversals and trend-based movements, the Wyckoff Method is great for understanding and also trading ranges. These are the extended price action phases where nothing much seems to be happening with the concerned crypto.
This trading method looks at the broader market from supply/demand and price/volume lenses. It helps unpack the price move that might be hiding behind trading ranges or even whipsaws (a quick price pivot, which ditches the broader trend and exists for a short span).
Also, this method segregates a trading scenario and price cycle into phases — helping traders anticipate future price action relevant to the asset. Broadly, there are periods of accumulation and distribution. Any standard Wyckoff price cycle can be broken into four phases: the accumulation phase, the markup phase, the distribution phase, and the markdown phase.
What is the accumulation phase?
This first stage is all about “smart money;” informed and experienced investors accumulating the concerned crypto or any other asset class.
This phase looks more like a trading range surfacing after a steady price decline. What looks like a range to the standard and unwitting trader or investor community is actually a space where composite operators or smart money go on a buying spree.
Therefore, an accumulation phase is a trading range in the wake of bearish or negative sentiment. Informed investors recognize the undervalued nature of the assets during the accumulation phase and keep purchasing rather discretely.
The declining prices eventually find support (due to the heavy yet discrete buying spurts) and start trading sideways.
Imagine an accumulation phase to be the zone between a shopping spree and an out-of-stock announcement at the time of a clearance sale. In the case of a market structure, the out-of-stock announcement is synonymous with the sudden price rise or the sustained uptrend that follows the accumulation phase — also known as the markup phase. This is the moment when the weak hands start ruing the decision of not holding onto the assets.
During the accumulation phase, price dips aren’t as deep, and most of the downward fluctuations are due to the weak hands exiting due to no or little movement at the counter.
What is the distribution phase?
This is the third stage or phase of a Wycoff price cycle. After the accumulation and markup phases are completed, a trading range comes after the sustained upside. At this point, smart money, or informed and experienced investors, start discretely dumping their holdings. The unwitting investors keep buying as the overall sentiment, post-markup, remains bullish.
The distribution phase is the clear opposite of the accumulation phase and is followed by a sustained price dip or markdown phase.
Picture the finale of a fireworks show where the smart sellers dump their fireworks on others — individuals willing to prolong the show. Little do they know that the best part of the show would already be over at this time, with people slowly leaving the arena.
And multiple Wycoff patterns exist, depending on whether the asset is in an accumulation or a distribution phase.
Three laws governing the Wyckoff Method
Now that we have some idea of the Wycoff phases, we can take a closer look at the three laws governing this trading strategy.
Law 1: the law of supply and demand
According to this law, price movements relevant to an asset are a product of its supply-demand balance. For instance, if the supply exceeds the demand, the prices tend to drop. In contrast, prices rise when demand outstrips supply. When supply equals demand, nothing much happens, and the asset/market continues with its sideways trades.
Law 2: the law of cause and effect
This law states that the effect or the price movement is made of smaller causes (buying and selling). For instance, the causes relevant to the accumulation phase slowly build up the premise for effect (price growth or the markup phase).
Law 3: the law of effort vs. result
Per this law, traders can locate potential trend reversals by looking at the misalignment between the effort (trading volume) and the result (price changes). In case the effort is low and the result is significant, there might be a trend reversal on the cards. For instance, if crypto is in an uptrend, you might expect it to show high volume and aggressive price changes. However, if the price changes slow down and the volume keeps increasing, you are better off preparing yourself for a reversal.
Laws 2 and 3 depend on the supply-demand premise or law 1 to make sense as both the cause (phases of the Wycoff method) and the effort (trading volume) take the supply and demand changes into consideration. At every point, an experienced trader should question the findings of the Wycoff method per three laws to locate the right trading positions.
Relevance of the Wyckoff Method
The Wycoff method is one of the few broad-spectrum trading strategies that work well with momentum indicators, moving averages, and oscillators. This makes it a versatile and highly adaptable way of trading. What separates the Wycoff method from other crypto-specific trading strategies is that it can work equally well in regard to the forex and the stock market.
Here are a few instances where Wycoff trade phases were encountered over the years:
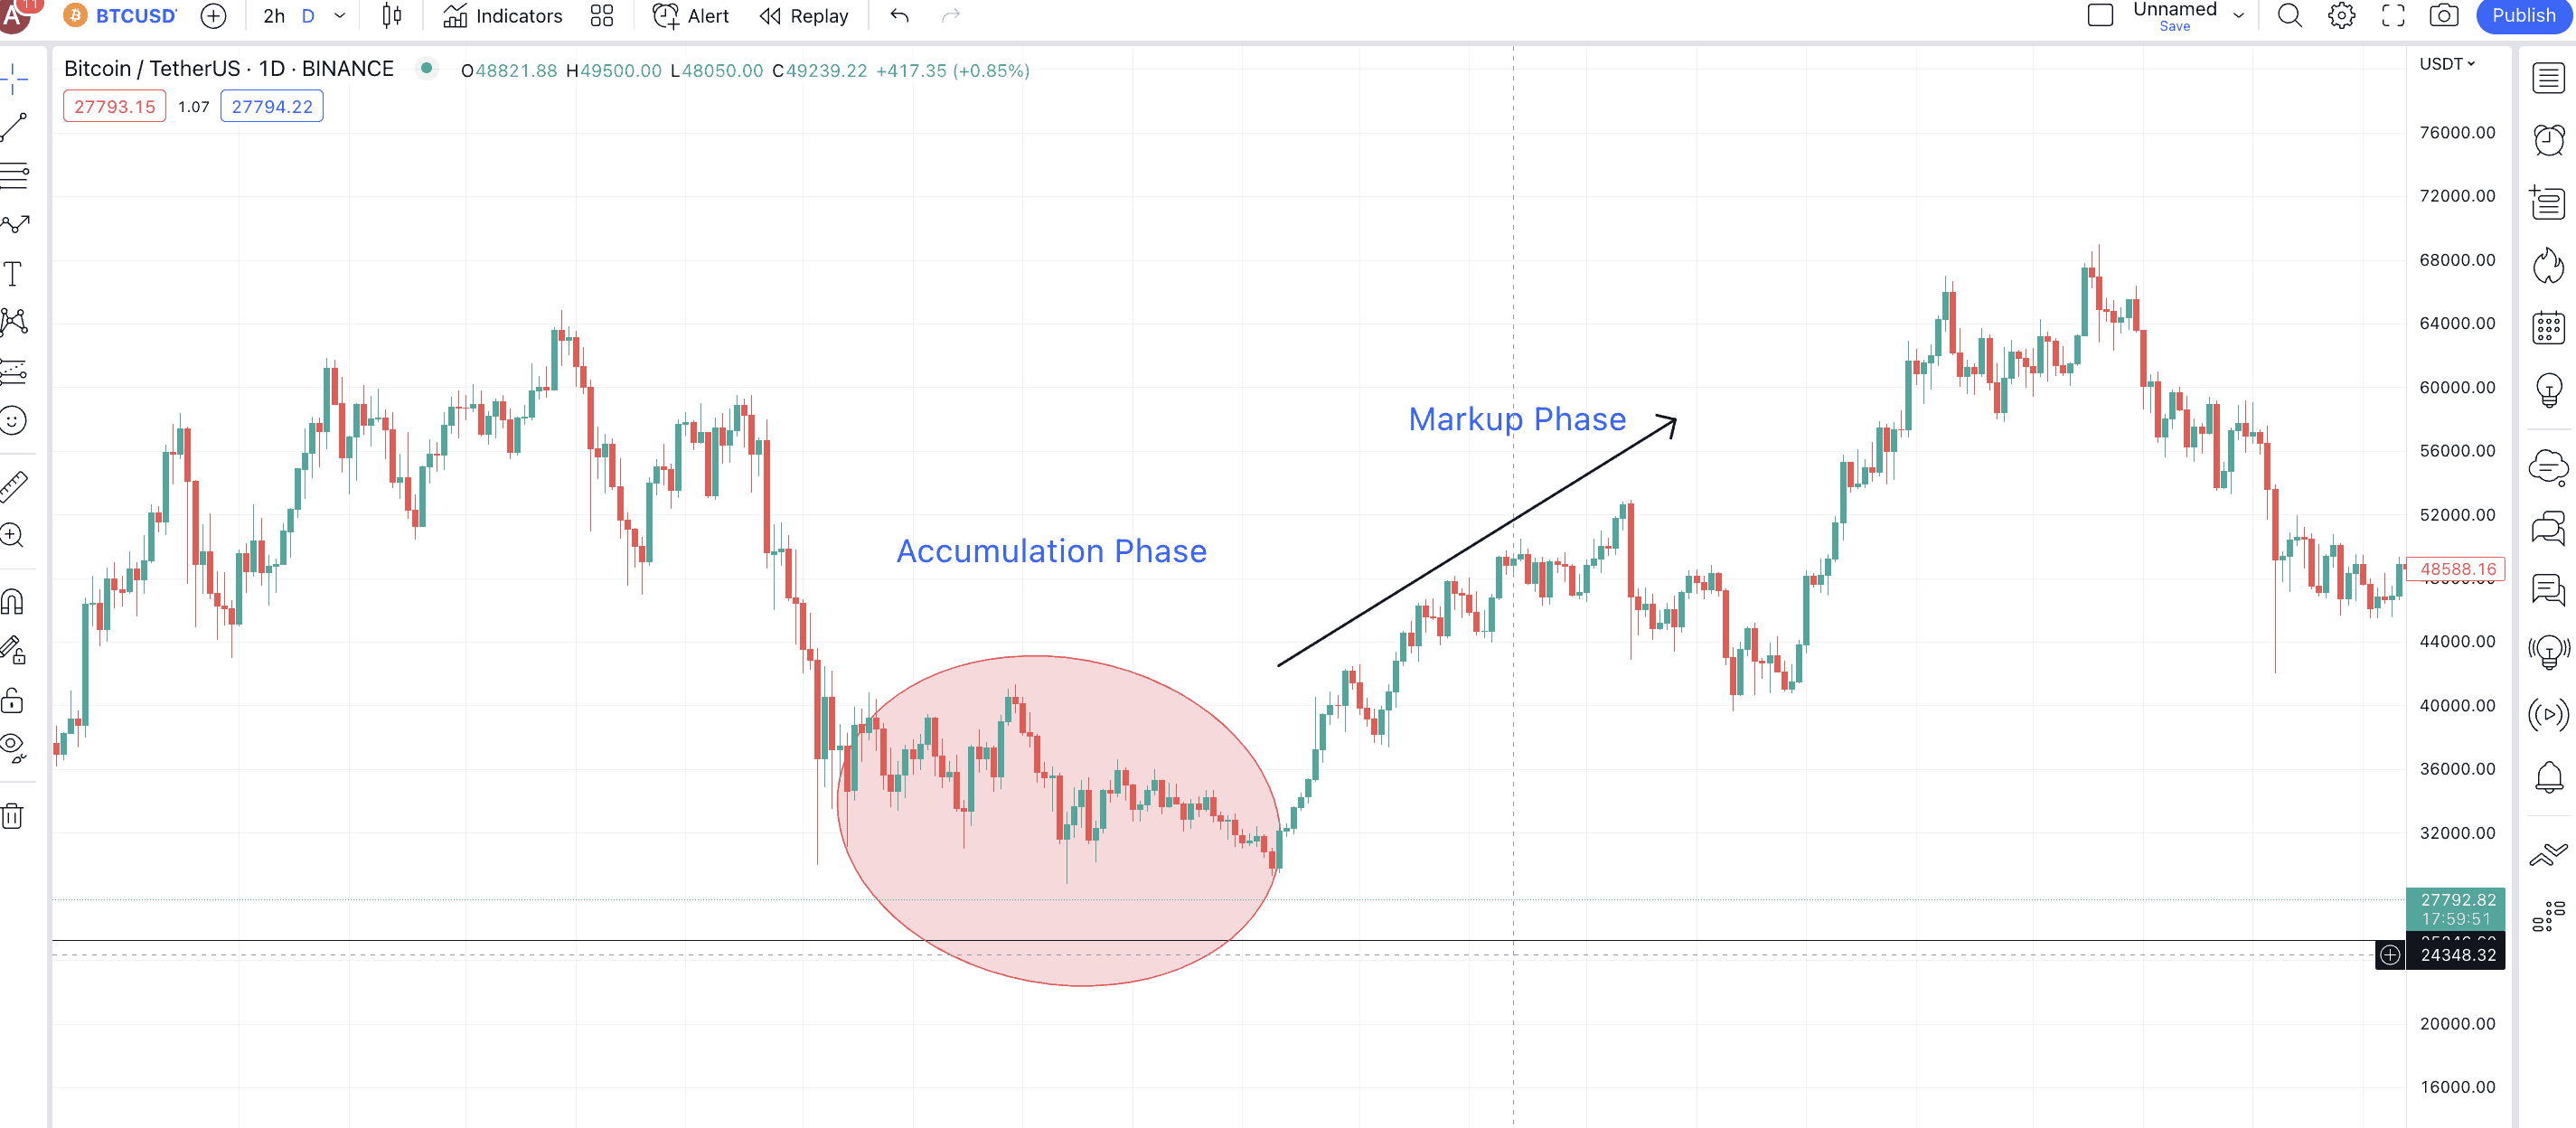
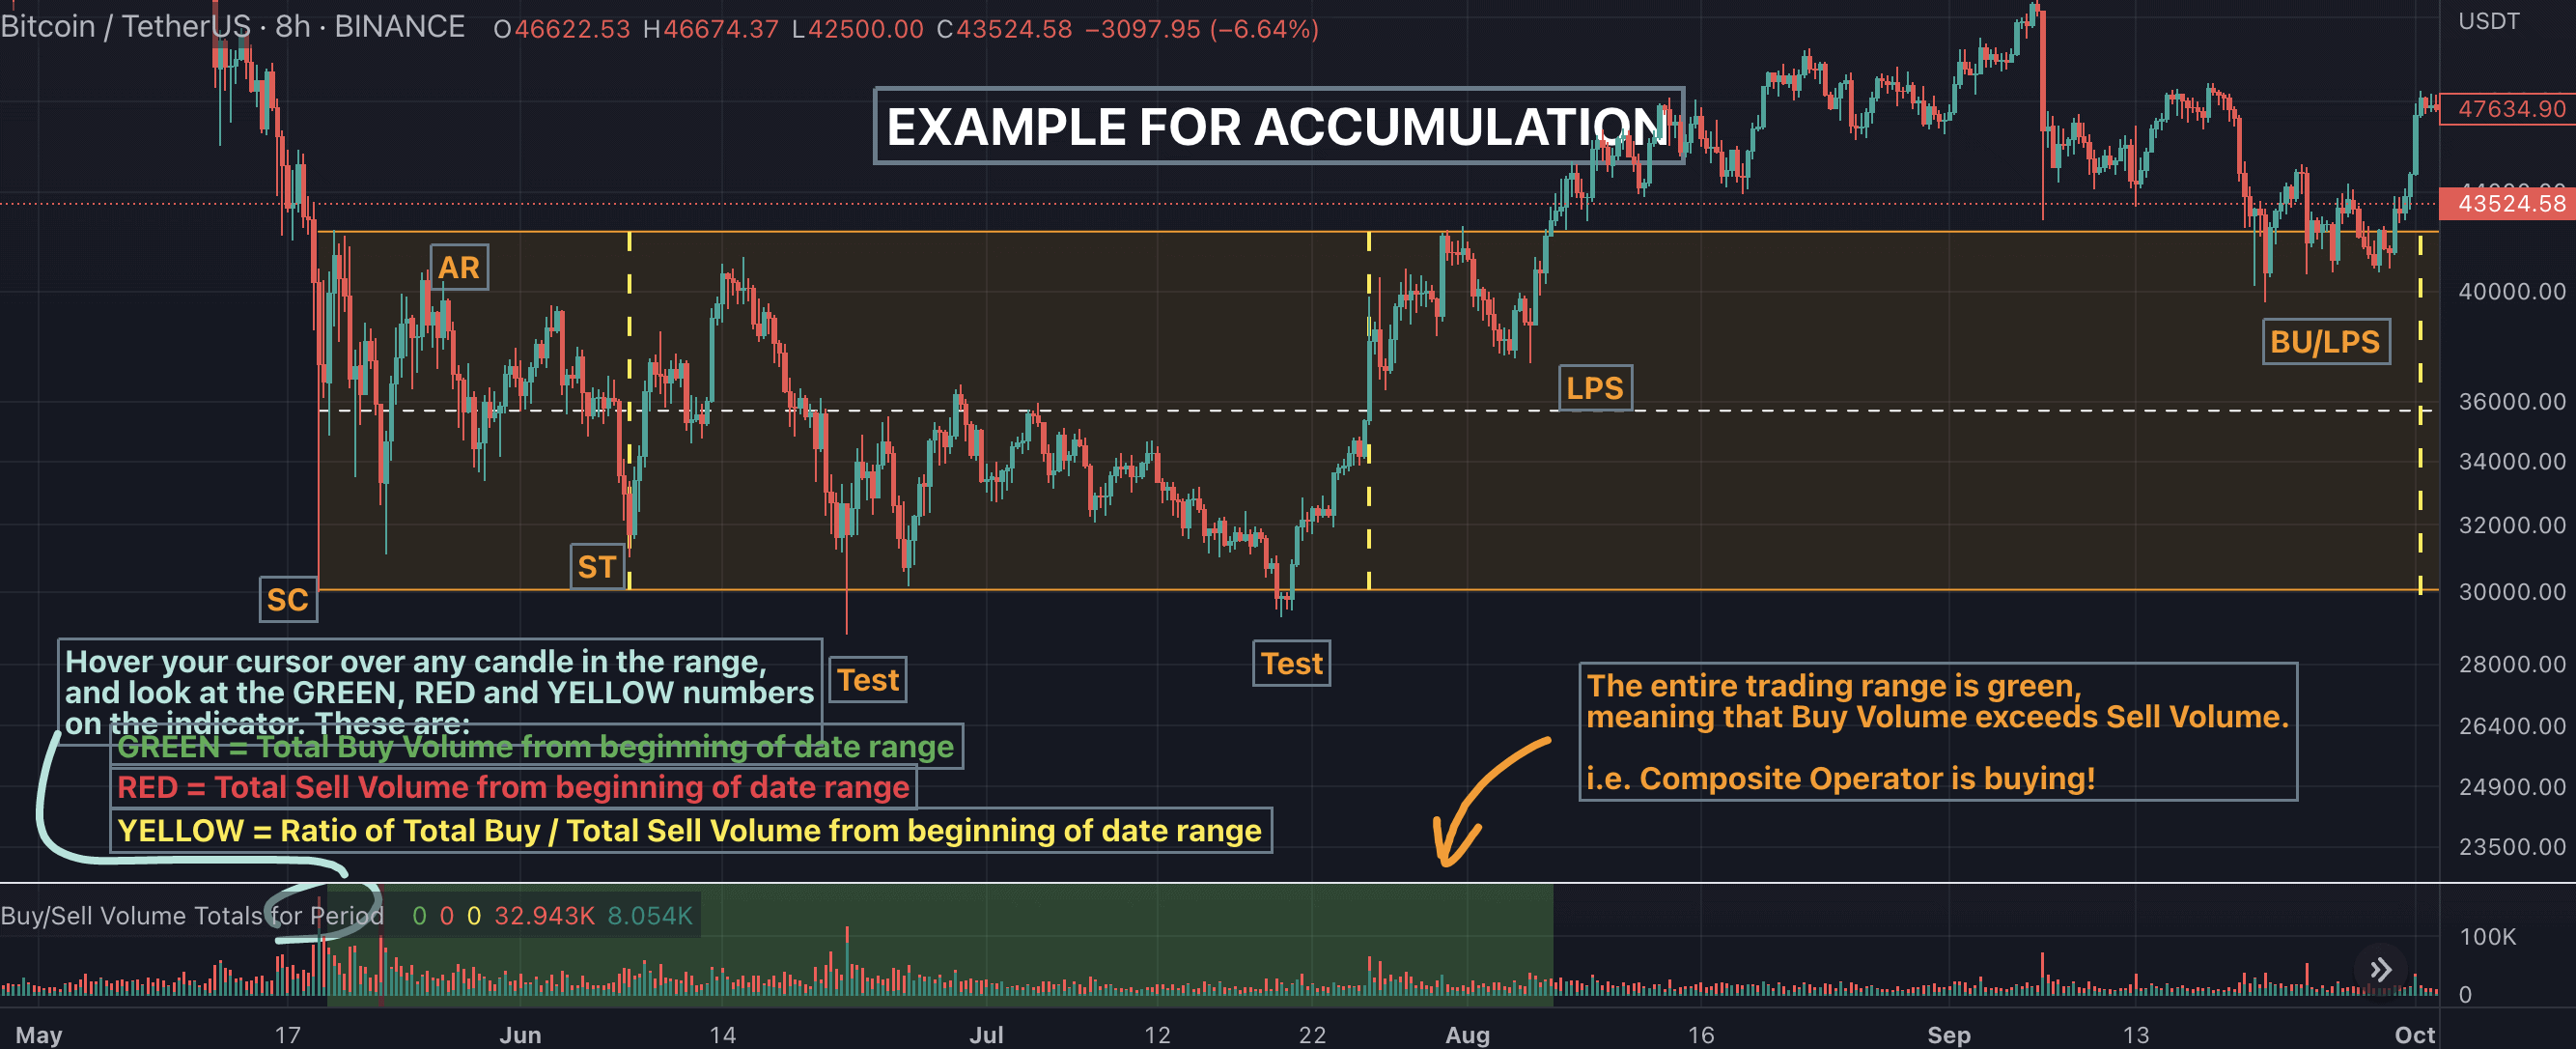
A BTC-USDT chart shows the accumulation zone right before the bull run pushed BTC to $67000 and above. We will discuss the conjoining indicators and other insights later in due course.
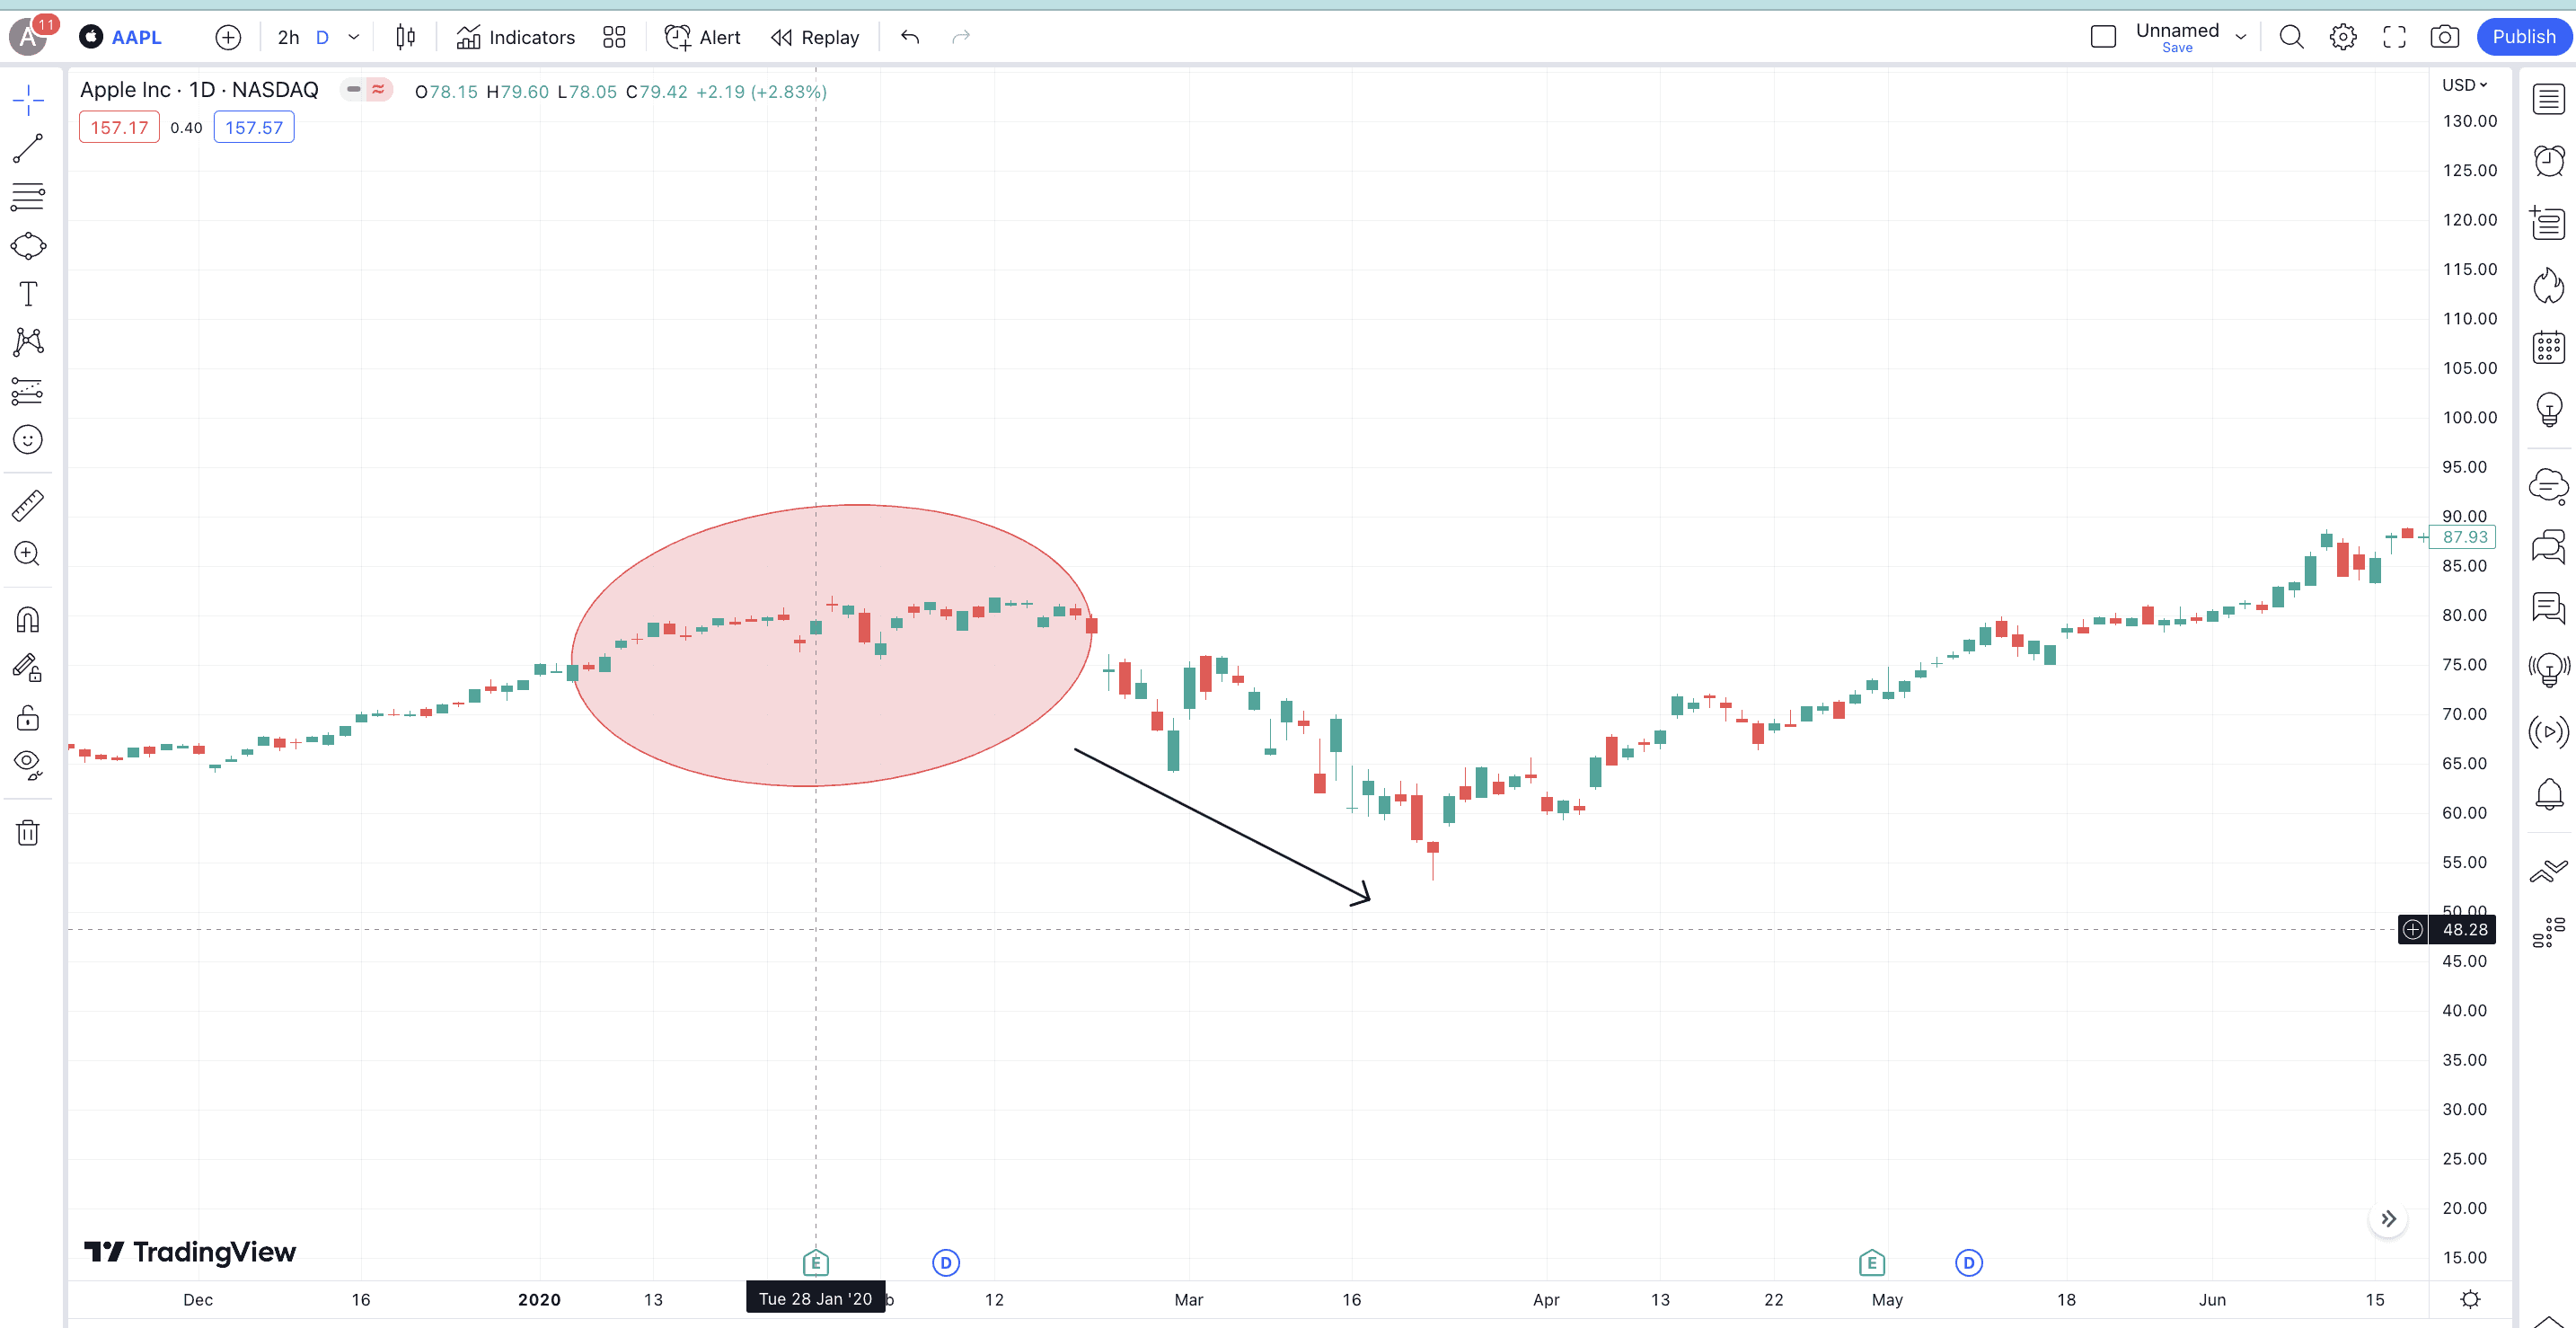
A noticeable distribution phase followed by the dip-specific markdown phase was seen at AAPL (Apple’s) counter in 2020.
The “Wyckoff” background: history, principles, and more
Richard Demille Wyckoff was a proficient trader who developed several market analysis strategies, including tape reading, chart reading, and — of course — the Wyckoff Method. Wyckoff believed that market activities are determined by the actions of institutional investors and market dynamics involving demand and supply.
In developing the Wyckoff Method, he closely watched market operators like JP Morgan and Jesser Livermore. Wyckoff identified the methods traders and institutions employed and observed the corresponding impact on price and volume-specific developments across the market.
Here are some of the key principles driving the Wyckoff Method:
- Every market structure comprises cycles: accumulation, markup, distribution, and markdown.
- The supply and demand relevant to an asset are what drive its price. Therefore, price and volume data should be read in unison.
- Institutional investors or “smart money” can impact market movements. Tracking their behavior can help predict the market trend.
- To identify potential trading opportunities relevant to an asset, you can compare it with any benchmark (like bitcoin for crypto) or an index (S&P 500 in the case of stocks). This will help you understand the strength and weaknesses of the concerned asset.
- Risk management and accurate trade timing are essential trading tools. Even with the Wyckoff Method, entry and exit points must first be identified, followed by position sizing via stop-losses.
The Wyckoff Method deep dive: stages, market dynamics, more
It is now time to get a bit technical in order to illustrate the stages of the method. On the surface, an entire Wyckoff trade can be set up in five broad-spectrum ways. These include:
- Determining market cycles or stage determination (involving any of the four phases).
- Analyzing supply-demand dynamics.
- Evaluating market conditions (strengths and weaknesses).
- Analyzing market readiness (looking at the signs and best points to enter or exit).
- Timing the trades
Stage determination
As mentioned, there are four phases associated with the Wyckoff Method — accumulation, markup, distribution, and markdown. While we already discussed the meaning of these phases in broad terms, here is a quick deep dive with additional insights:
Accumulation
Occurs immediately after a downtrend and is characterized by low-cost buying, steadily building buying volumes, and minor price fluctuations.
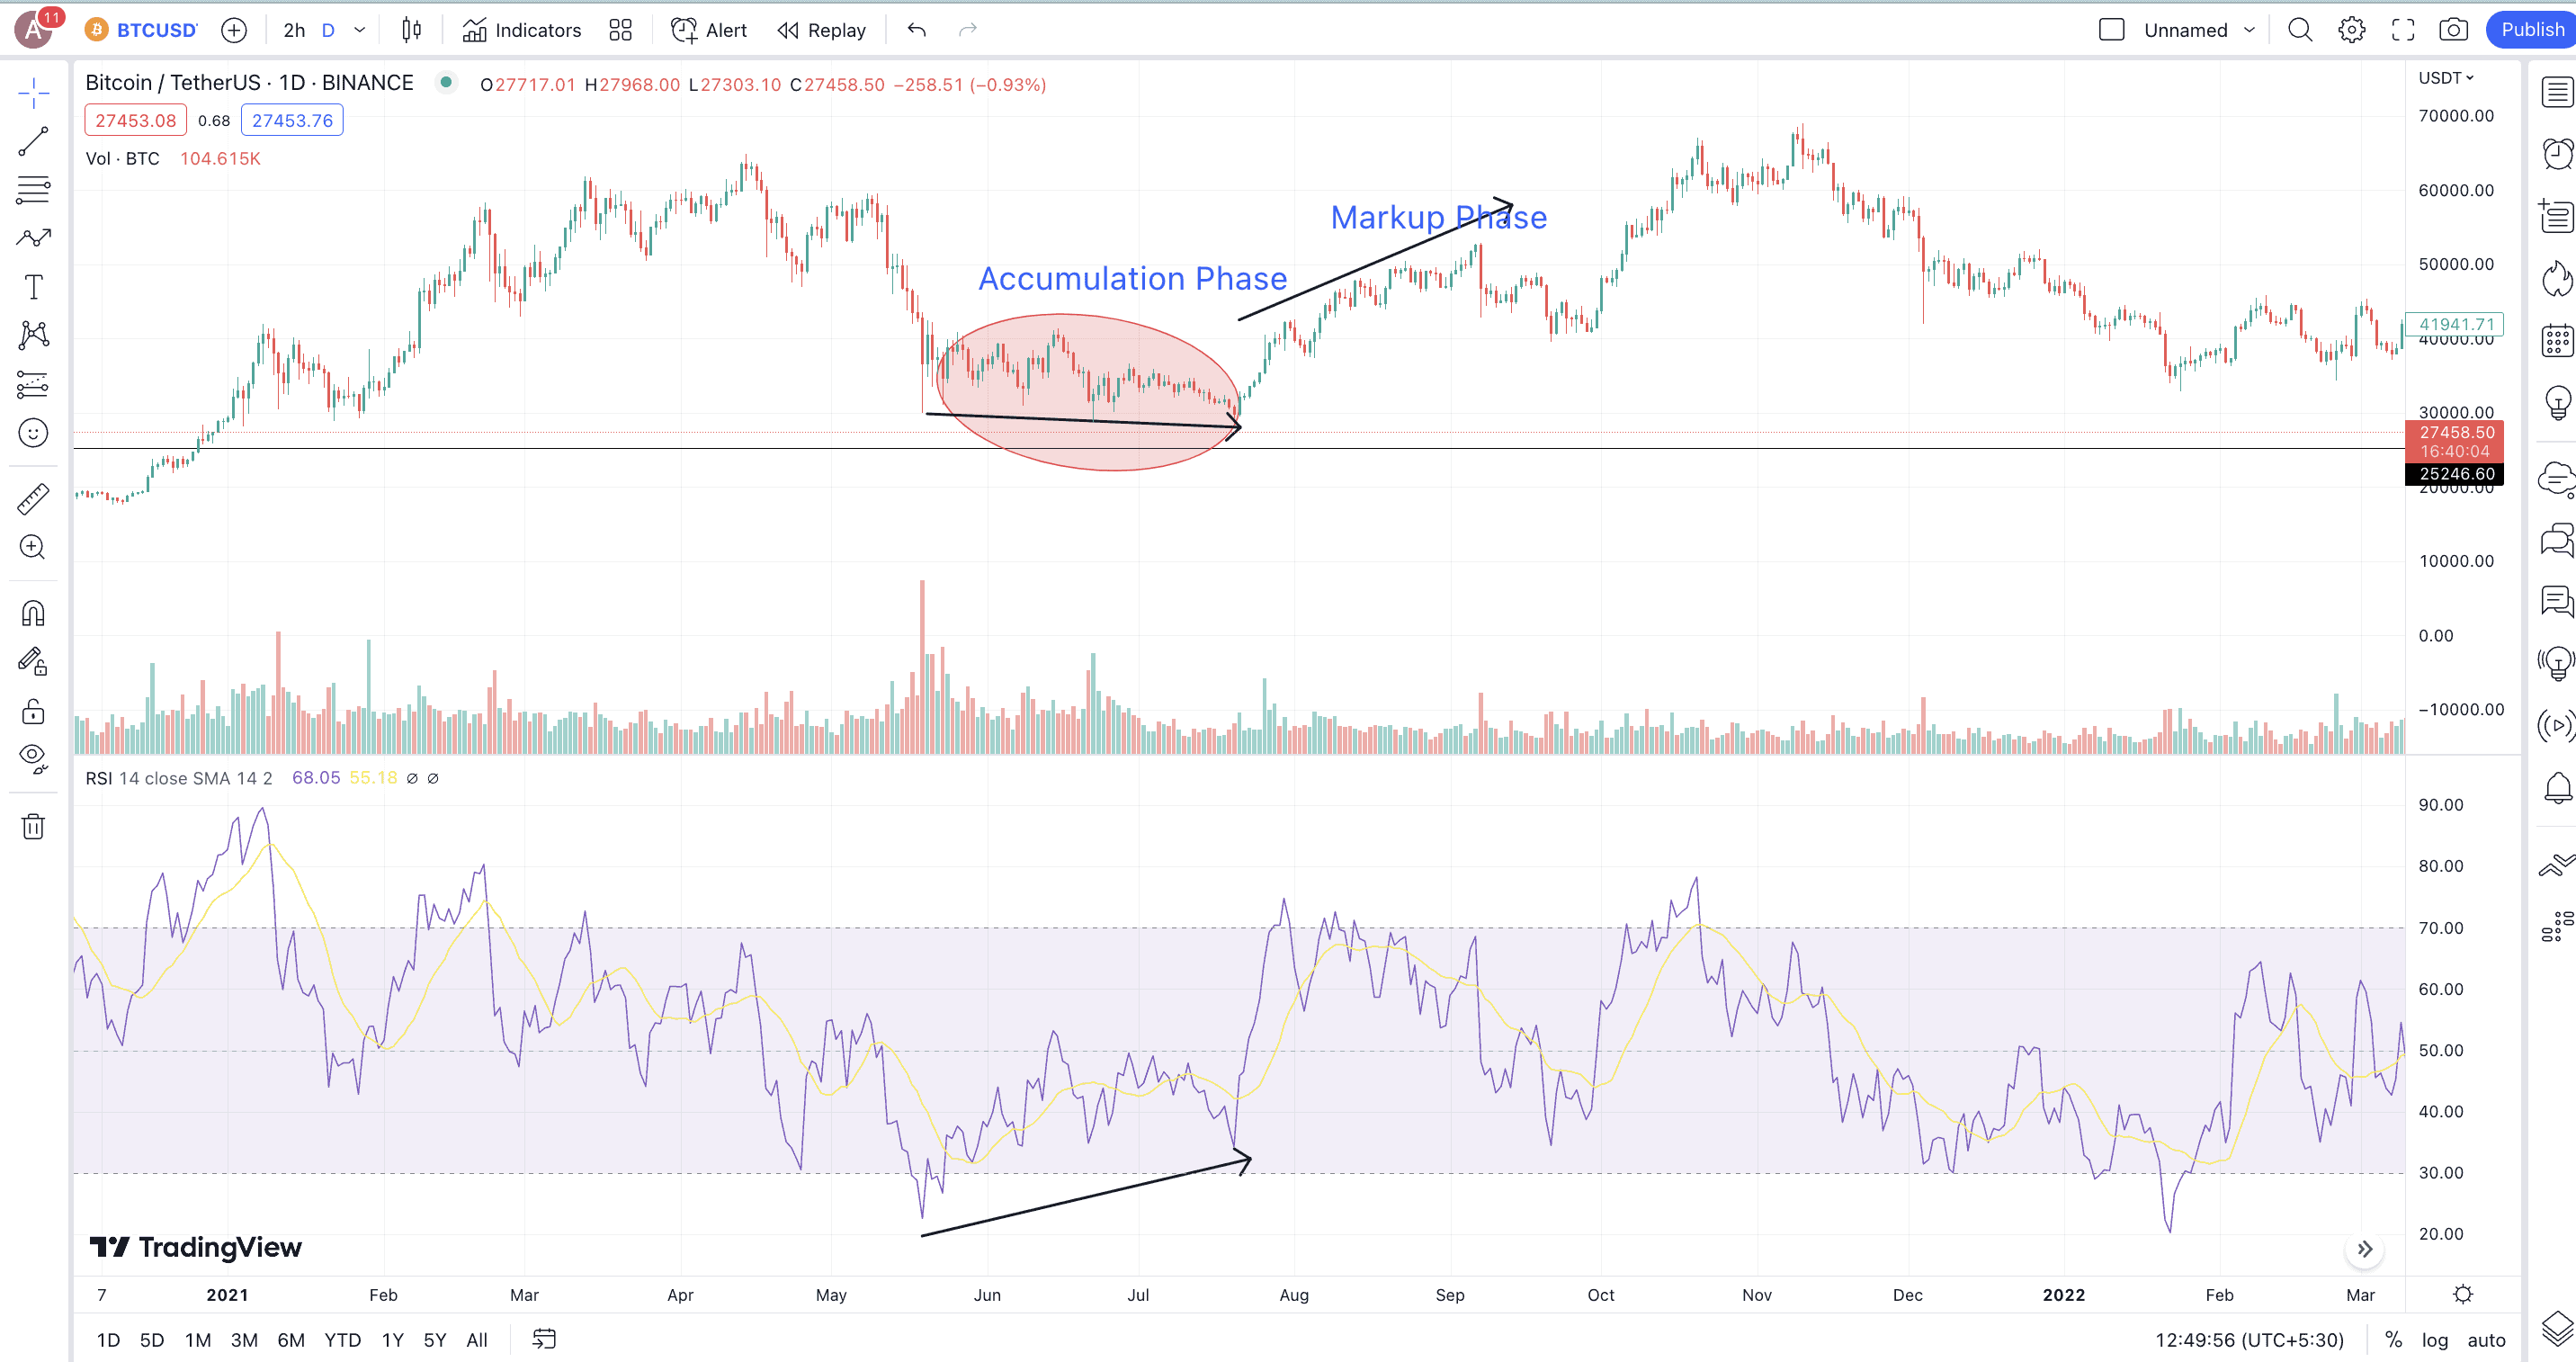
Below is the BTC accumulation phase chart we discussed earlier, with RSI and volume indicators added. Notice how the accumulation phase starts when the RSI levels associated with BTC drop under 25 — 22.67, to be exact. The oversold and undervalued zone is what pushes the Accumulation phase further.
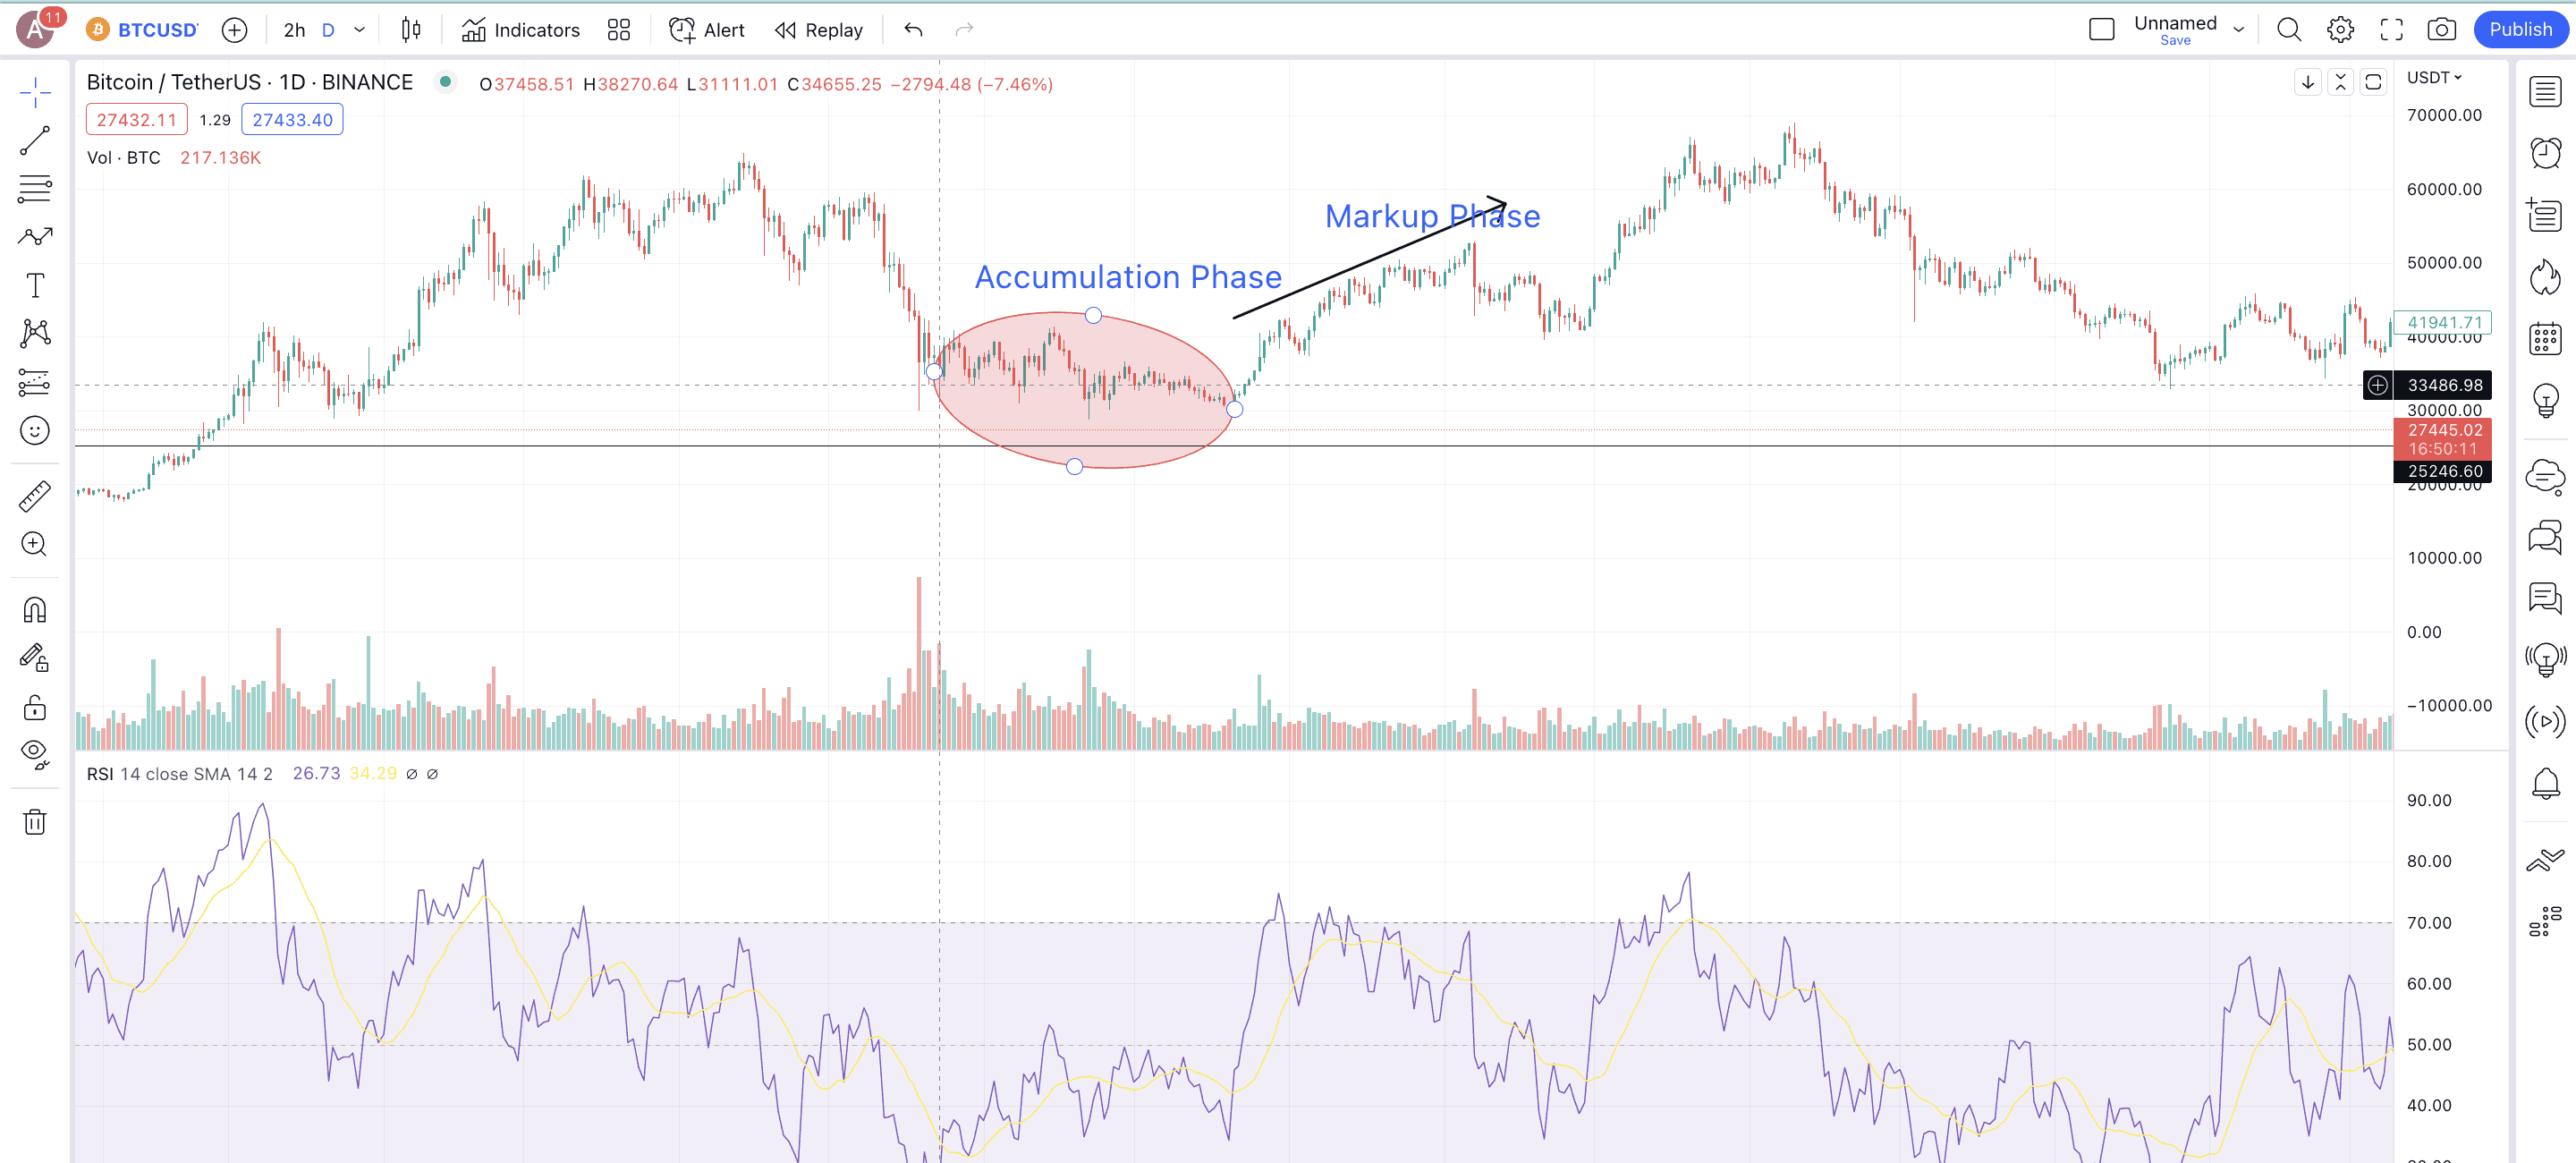
We can even see the build up of green pillars towards the end of the accumulation phase.
Markup
How do we know that this market structure relevant to BTC in 2021 was part of a Wyckoff trade? Well, the RSI clearly indicated a possible upward price trend. Notice how the RSI made a higher low formation, as opposed to the price action during the same phase. Therefore, the accumulation was expected to make way for a price rise.
Distribution
The distribution phase starts after a prolonged uptrend and is characterized by a high RSI and an increase in red or seller-specific pillars. The idea behind the distribution phase is the increased selling pressure.
Below is a BTC chart from late 2017, where BTC prices peaked at almost $20,000. Notice how the RSI, at that time, was in the overbought region, hinting at an upcoming consolidation. The volumes were also fizzling out, as seen by the chart. What followed was a distribution phase that eventually saw a significant dip in RSI.
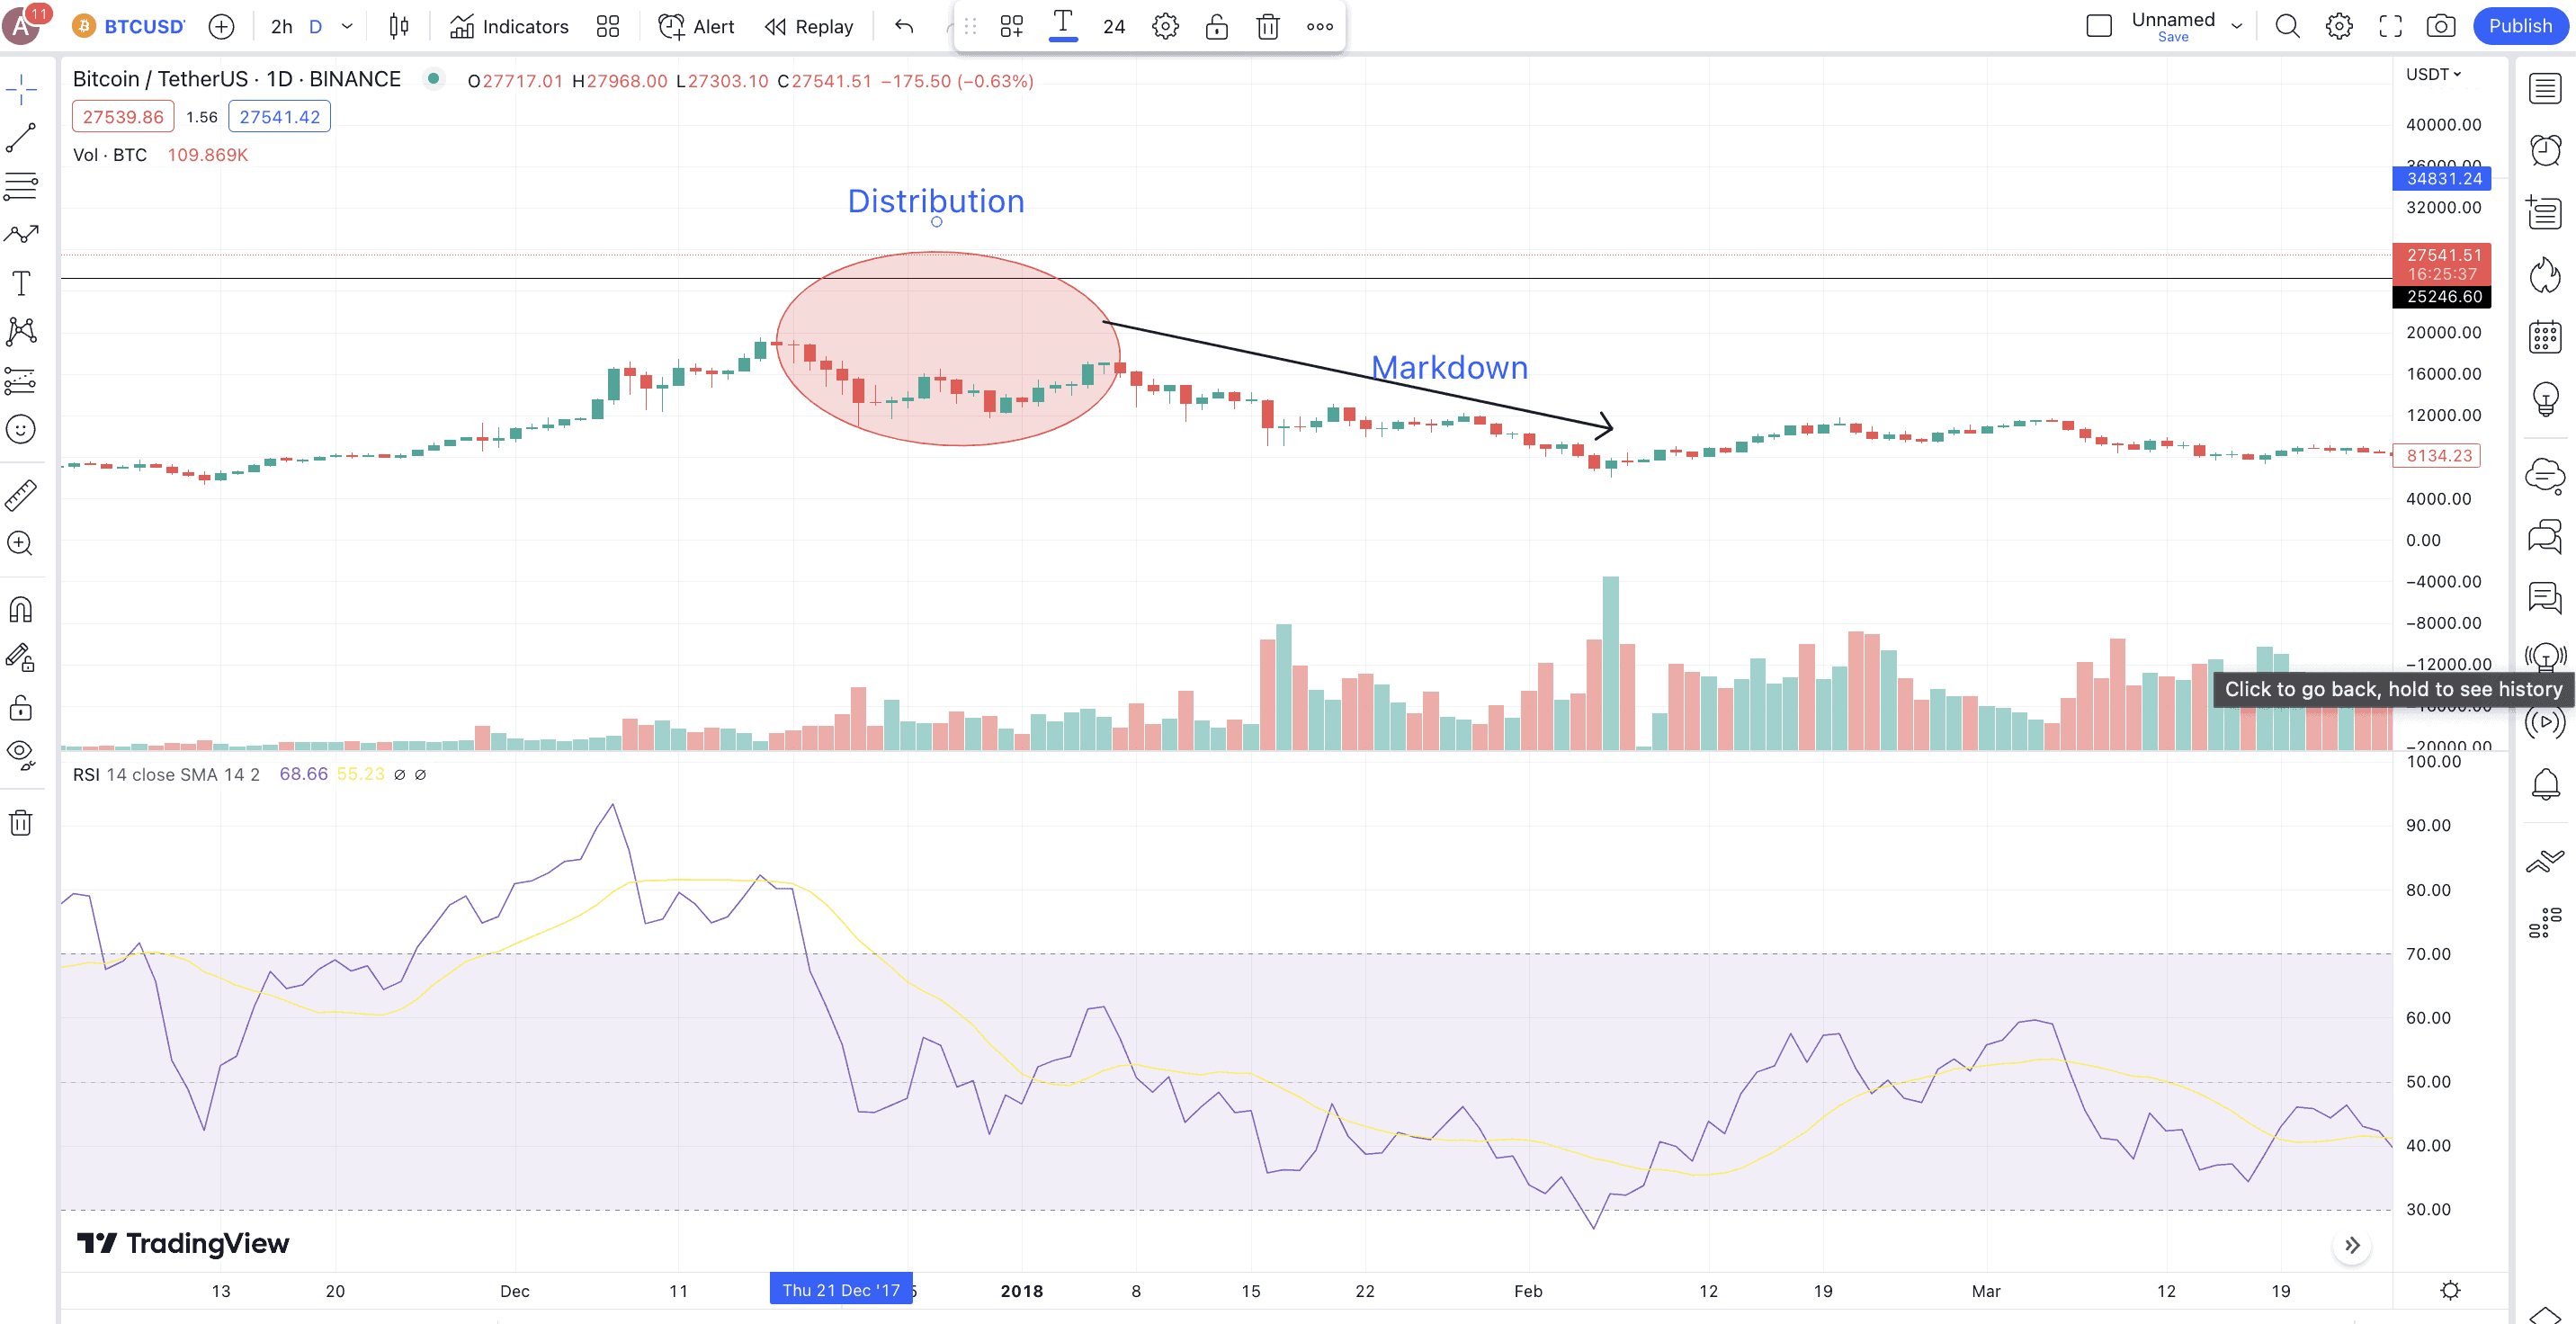
The gradual build up of red pillars right before the end of the distribution phase indicated an incoming correction.
Markdown
While the distribution phase is still rangebound, prices break during the markdown phase. This is the moment when the selling pressure becomes apparent, and even the unwitting investors start cashing out.
Once you understand the stages, it becomes easier to determine the market cycles.
The role of market dynamics in the Wyckoff Method
The price charts from above also include supply-demand considerations courtesy of the volume pillars. Let us explore these concepts in depth.
- A price rise with high volume indicates strong buying pressure, whereas a price drop with high volume (red pillars) indicates strong selling pressure. These points are keys to the formation of accumulation-markup and distribution-markdown phases.
- If an active accumulation and distribution phase is in progress, the candlestick boundaries can act as resistance and support levels. These can work as entry and exit points for your trades.
- Some Wyckoff patterns occur in between the phases. Understanding those can help locate the climaxes — significant price breaks.
- The timeframe of studying a Wyckoff market structure can vary and is more like a trial-and-error approach. For instance, a daily chart might not show a Wyckoff pattern, but a 4-hour chart of the same asset might.
Wyckoff patterns: key points for better predictions
We can now explore the patterns in-depth in order to understand the different sections of a Wyckoff trade. Let us start with the accumulation phase and mention the Wyckoff pattern elements that are usually in focus:
Preliminary support or PS
This is the support level of the downtrend that precedes the accumulation phase. This is the lowest the crypto or any other asset can drop in an accumulation phase. In the accumulation phase or the trading range, the PS is the point where the price starts to stabilize. This is the point where the “smart money” starts flowing in.
SC or the Selling Climax
Despite being counted after the PS, SC comes first on the chart and is the zone where the asset experiences huge selling pressure before falling into the accumulation trading range. The “smart money” at the PS or Preliminary Support starts absorbing the selling pressure.
This zone is often the panic selling zone that completely weakens the selling pressure and starts a new trading range.
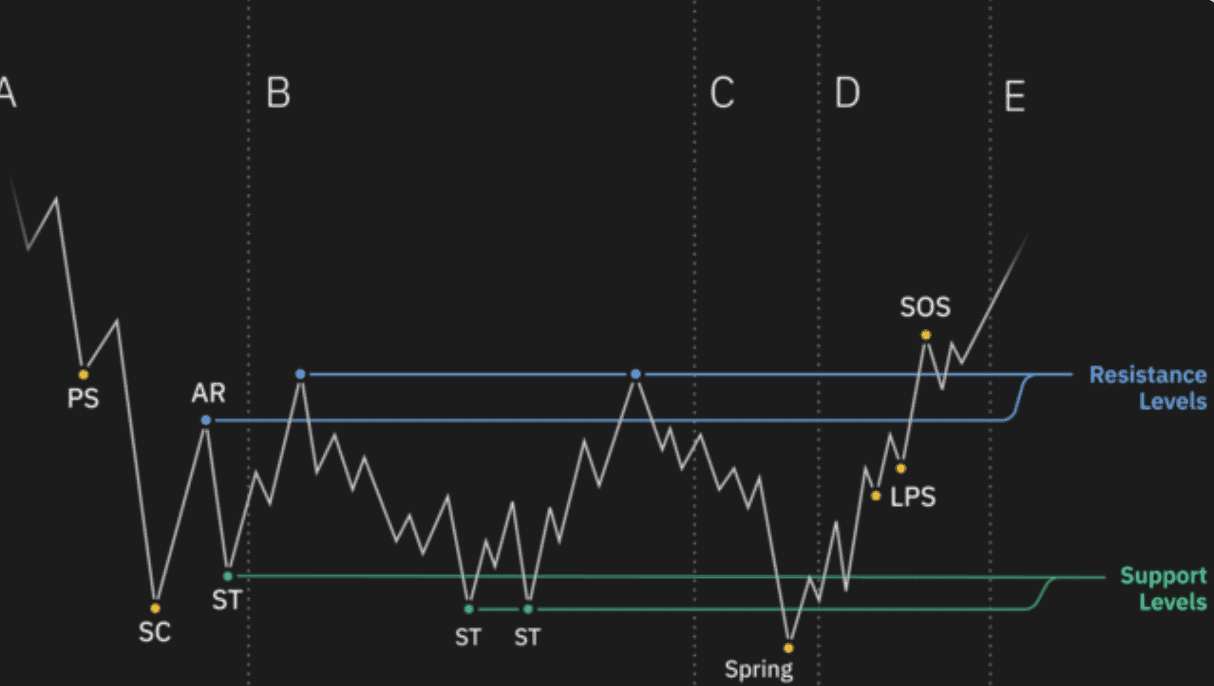
AR or Automatic Rally
AR often follows the selling climax once the price takes support at the preliminary support zone. This is caused by the sudden “smart money” or investor coming into the space. Despite being discreet, some upward momentum is seen. Once the price breaks the accumulation phase, this helps create resistance for the upcoming markup phase.
Secondary test or ST
This element of the Wyckoff pattern serves as a support-level test. It follows the AR as a price retracement, shows that the selling pressure is still around, and ends up somewhere close to the preliminary support. Some investors see this drop and resort to panic selling, giving the institutional investors some more buying scope.
There can be multiple ARs and STs leading to the markup phase.
Spring
During the accumulation phase, another weak-hand cleansing phase comes where the price drops lower than the PS. This approach shakes out the weaker hands and eliminates any selling pressure to the last bit. The good “Spring” indication is the lower volume following this price drip — showing that the sellers are losing steam.
LPS or Last Point of Support
At this time, the asset price tests the previous ST support levels all over again. Once done, there is an SOS or Sign of Strength where the AR resistance is breached, starting the markup phase once and for all.
That sums up the accumulation phase. Let us discuss the key points relevant to the distribution phase:
PSY or Preliminary Supply
We know that the distribution phase follows an uptrend. As the market structure for the given crypto enters the distribution phase, it encounters a resistance zone, which defeats the upward price trend and puts the market in the range. At this point, selling starts. This point is also termed PR or Preliminary Resistance.
Buying climax or BC
This point surfaces before the PSY or PR and involves a sudden inflow of buyers or buying pressure at the asset’s counter. There is a sharp price increase, which in turn is absorbed by the composite operator selling.
Automatic Reaction (AR) or Automatic Sell-off (AS)
This is the reverse of the Automatic Rally or AR seen during the Accumulation phase. AR or even AS is like a quick price correction due to “smart money” selling off their holdings. Unwitting investors consider this a regular correction and end up holding to their positions. This stage also helps set a strong support level for the concerned asset.
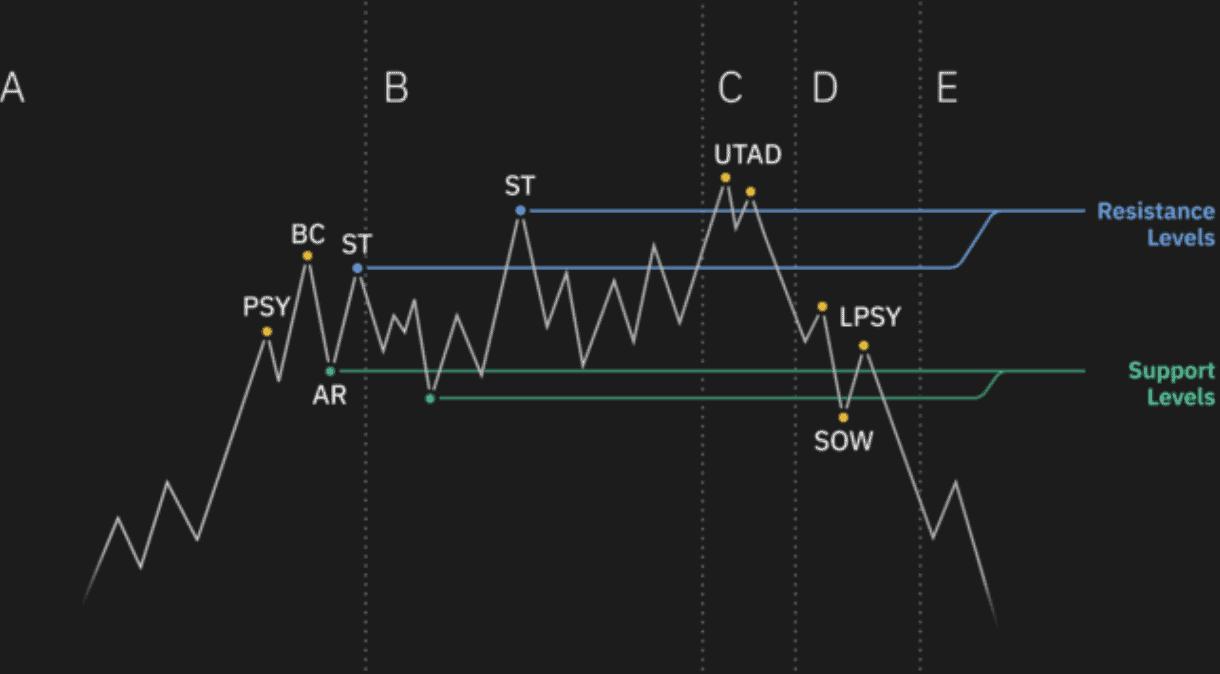
Upthrust or UT
Following the Automatic sell-off is a rally termed UT or UpThrust. At this point, more investors hop onto the price action bandwagon, which also creates a crucial resistance level higher than the Preliminary resistance. At this level, more retail buying happens, but the Smart Money sell-offs absorb the extra buying pressure. This element traps overeager investors.
ST or Secondary Test
This point can happen both before or after the upthrust, where the price of the asset retests the PSY or the PR (Preliminary Resistance), only to start correcting again.
UTAD
This is a rare event or rather a rare element, which happens to be the asset’s last-ditch attempt to send the prices higher. However, the price rise is paired with low trading volume, which shows that the buying pressure is weakening.
Last point of Supply or LPSY
The actual markdown phase starts at this point, as the price breaks lower than the AR support, only to correct aggressively. This point is also termed the “Sign of Weakness” or SoW. This is the perfect point for shorting the asset, provided you can identify it correctly.
And that sums up the distribution phase. Many Wyckoff patterns are in play, regardless of the phase, allowing the trader or the investor to take better entry and exit calls.
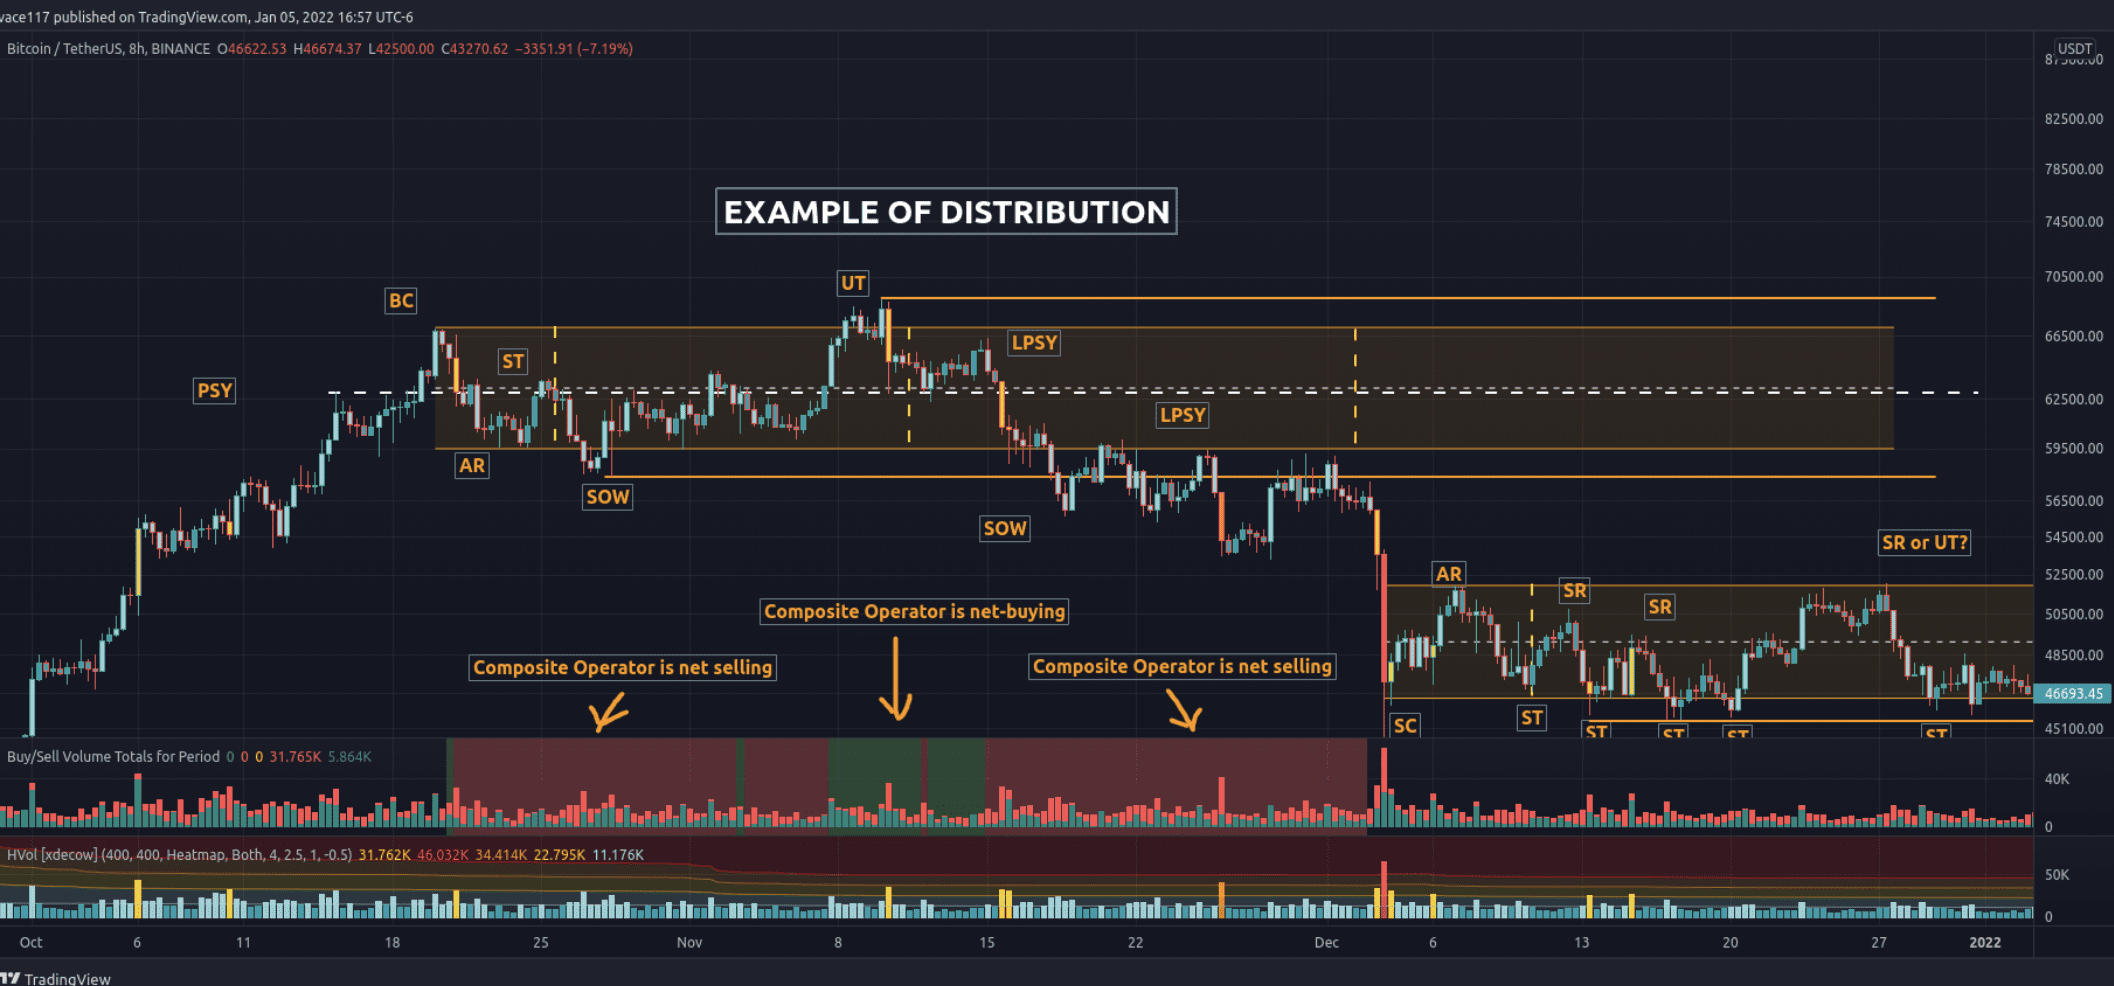
Below is a quick BTC chart that shows that the $69K high reached in November 2021 was a distribution phase upthrust, trapping unwitting investors.
Evaluating the market strength: complementing Wyckoff
Even though understanding the elements of the Wyckoff Method helps you locate key points, it is essential to evaluate the market strength to gain other specific insights.
For instance, checking the Bitcoin dominance and Fear and Greed Index makes sense if you are in crypto. These work as benchmarks that you can test the Wyckoff signals with.
Another way of testing the market strength is by looking at the price action in correlation with the RSI. If a bullish divergence shows up when the asset is in an accumulation phase, you might brace yourself for the markup phase or the upcoming long-term up move. Similarly, if, despite an up move (Upthrust), you need the RSI to form a bearish divergence with the price action, entering the market might not be the best possible option.
Pairing the Wyckoff patterns with benchmarks and momentum indicators can help you receive better trading signals.
Analyzing the market’s readiness
Market readiness is another essential aspect of putting Wyckoff patterns to good use. Check for the following signals:
- Accumulation and distribution: Price and volume analysis is the best way to get insights into accumulation and distribution. While indicators like ADX can always help, a pro tip is to be on the lookout for high trading volumes near the support and resistance levels. If you are only interested in prices, moves like automatic selling and upthrust — from the Wyckoff patterns we discussed earlier — are the ones to look at.
- Breakouts: Another good way of tracking price readiness is to check for pattern breakouts. If the price of an asset moves above or lower than specific trendline levels, you might be able to get some more validation for your Wyckoff trades.
- Confirmations: If you know your way around technical analysis, it might be a good practice to look for golden crossovers and death crossovers — types of moving average crossovers — to confirm Wyckoff patterns corresponding to the accumulation and distribution phases.
Timing the trades right with the Wyckoff Method
Even though timing the market can be risky, following Wyckoff patterns, albeit with confirmation signals, can be rewarding. The best way to trade is to look for high-reward, low-risk setups. This means identifying buys at the early stages of the markup phase or shorts at the early stages of the markdown phase.
In case you plan on exiting and entering the market at specific points, key resistance and support levels relevant to the Wyckoff patterns make sense. You can always refer to the Wyckoff patterns for the accumulation and distribution cycles from our discussion earlier.
And finally, like any other trading strategy, using the Wyckoff Method also requires a quintessential risk management strategy. These include setting up stop-loss orders.
How to apply the Wyckoff Method?
You can apply each of the strategies mentioned above to make the best use of the Wyckoff Method. But here is a quick assimilation to help you form a step-by-step process.
- Identify market phases: The first step to implementing the Wyckoff Method is always to examine and confirm the market/asset’s current phase.
- Analyze price and volume: Confirm that all the Wyckoff patterns corresponding to a phase are being followed with the right price and volume analysis. This can also be termed the effort vs. result way of applying the Wyckoff Method. A quick hack is to look for high volumes at resistance and support levels.
- Recognize the events clearly: A few crucial Wyckoff events or patterns require special attention. These include selling and buying climaxes, upthrusts, and springs. You should be able to understand these patterns and confirm them with other technical analysis tools if needed.
- Apply supporting tools: You can use tools like trendlines, oscillators, moving averages, and volume indicators to get phase confirmation in relation to the Wyckoff Method.
Once these aspects are taken care of, you can put forth relevant stop-loss and limit orders to exit and enter the market accordingly. Understanding each of the steps above can help with better risk management.
Limitations of the Wyckoff Method
Here are some of the not-so-great things you might want to know about the Wyckoff Method:
- Time-consuming: The Wyckoff Method comprises several steps to perfect the trading experience. Landing the right trading signals can be time-consuming.
- Not a holistic system: The Wyckoff Method isn’t a wholesome trading setup. You still need to pair it with the right trading tools, like oscillators and moving averages, to locate the right trading moves.
- Still prone to fluctuation: Traders must know that an asset can immediately defeat the markup or the markdown phase, depending on the market sentiments. In crypto, sentiment might still best the Wyckoff patterns on any given day.
Therefore, to eliminate the misapplications of the Wyckoff Method, you are always better off combining it with other resources and tools. This will help you broaden the scope of technical analysis.
Is the Wyckoff Method a means to an end?
The Wyckoff Method is not the most enjoyable and effortless implementation of technical analysis, but it gets the job done. Needless to say, the method is time-tested and focuses on broader market dynamics — supply/demand, price/volume, and accumulation/distribution. If you pair a Wyckoff pattern with key technical analysis tools like moving averages, indicators, and oscillators, you can make better use of this trading strategy.
Notably, this systematic approach to trading is more than a century old and yet still relevant. And the right implementation of the method can work equally well for the stock market, crypto market, and even the forex market in both the short and long term.
Where can I use the Wyckoff Method?
You can use the Wyckoff Method on various cryptocurrency exchanges, such as:


