


Your crypto trading strategy requires only the best navigation tools. And the Volume-Weighted Average Price or the VWAP indicator is one of them. Often used as a reliable benchmark to ascertain market conditions, especially in the short term, the VWAP indicator is effective at identifying trading opportunities and market trends. As much as it fits perfectly in your technical analysis repertoire, understanding every aspect of the VWAP indicator can become tricky — courtesy of the finer elements like the formula, VWAP crossover strategies, VWAP deviations, and more.
In this guide, we cover everything there to know about VWAP — from the concepts to implementations to real-world implementations and even distinctions with something called the TWAP. By the end of this piece, you should be able to use VWAP seamlessly as a standalone indicator or in cohesion with the likes of MACD, 30-day timeframes, and whatnot.
Top Crypto Trading Exchanges
Best for interest rates

Best for spot trading

Best for altcoins trading

What is the VWAP indicator?
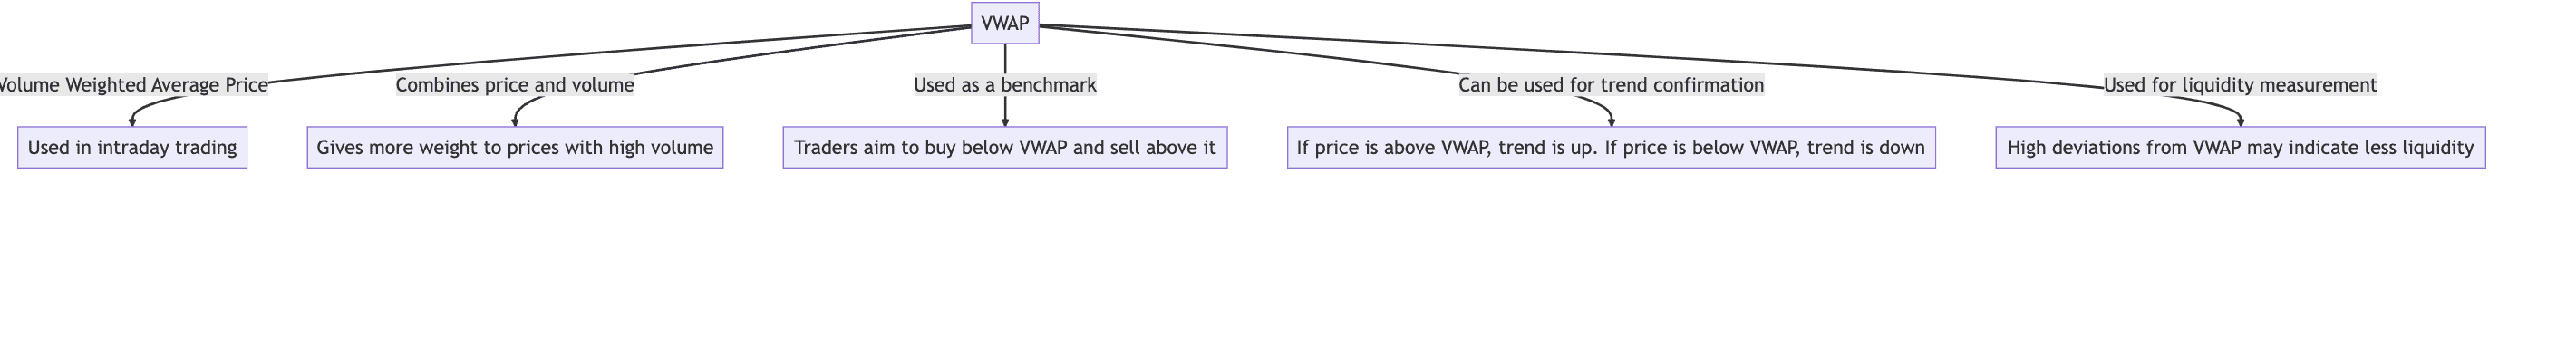
The VWAP indicator shows up as a standard trading benchmark that tracks the average price of any asset during the course of a day. The price tracking scenarios involve both price and volume. Simply put, the VWAP tracks the price and volume of the assets traded throughout the day, helping set a buying benchmark for traders.
What is VWAP? real-world example
Imagine there is a school fair with students selling handmade cookies. Different students are seen asking for different prices for their cookies. As it is a school, the more affordable cookies seem to be getting sold faster. However, if you now want to find the average price of the cookies sold, you might be tempted to go easy, add up all the cookie prices, and divide the same by the total number of students selling them.
However, that approach wouldn’t be accurate as it wouldn’t take the number of cookies each student sold. This is where we must shift our attention to the concept of weighted price. Using this approach, the average price will be a more direct function of the more popular cookie prices. Students who sold more cookies will have a bigger impact on the average price of the cookie at the fair. Notice how revisited price calculation considers the volume of cookies sold for a given price.
Something similar happens in the world of trading with VWAP. The VWAP indicator accounts for the volume of trades and the price of trades simultaneously. The trading momentum is thereby gauged and pointed towards the more voluminous trades — the ones that were popular. VWAP, therefore, gives a more accurate representation of the asset’s “average price.”
Did you know? The VWAP strategy is also used by institutional traders to distribute large market orders into smaller chunks. This way, the market doesn’t get disturbed by hefty trades, and the average price of order execution remains closer to the VWAP, eliminating market impact.
VWAP isn’t just a standalone indicator. Instead, you can use it to develop VWAP trading strategies, aligning expectations with market trends and short-term momentum. It is worth noting that with VWAP, you get access to market knowledge like no other, allowing you to make better-informed decisions.
“The secret to being successful from a trading perspective is to have an indefatigable and an undying and unquenchable thirst for information and knowledge.”
Paul Tudor Jones, billionaire hedge fund manager: From PBS-produced documentary, Trader
Unpacking the VWAP indicator: what is VWAP?
The best thing about the VWAP indicator is that it is as simple as it is informative. Even though it is a calculation-specific indicator, making sense of it only hinges on two variables: volume and price. Let us see how this is calculated.
How is VWAP calculated?
VWAP calculation involves multiplying the shares trading at a given price by the price and eventually dividing the result by the total number of traded shares. Based on our “school fair cookie” VWAP example from above, the idea is to sum up the trades for every transaction precisely to get a weighted average price.
The VWAP calculator
As for the formula, VWAP follows:
VWAP = ∑ (Price * Volume) / ∑Volume
*Price is the trading value of an asset at any given point
*Volume refers to the number of shares trading at any given point
Timeframes for VWAP
You can procure surprisingly enlightening insights by looking at the VWAP formula from above. As the price volume summation is obvious, it is noteworthy that the VWAP indicator is more responsive to immediate bursts in volume — something that only intraday trading brings to life.
Simply put, intraday trading is the most volume-sensitive phase of trading, and with VWAP, it becomes easier for traders to understand the price momentum for this short term. However, there are multiple timeframes in play, even for intraday trading, especially the ones where you can use the VWAP indicator. These timeframes include:
- 1-minute: meant for very active traders.
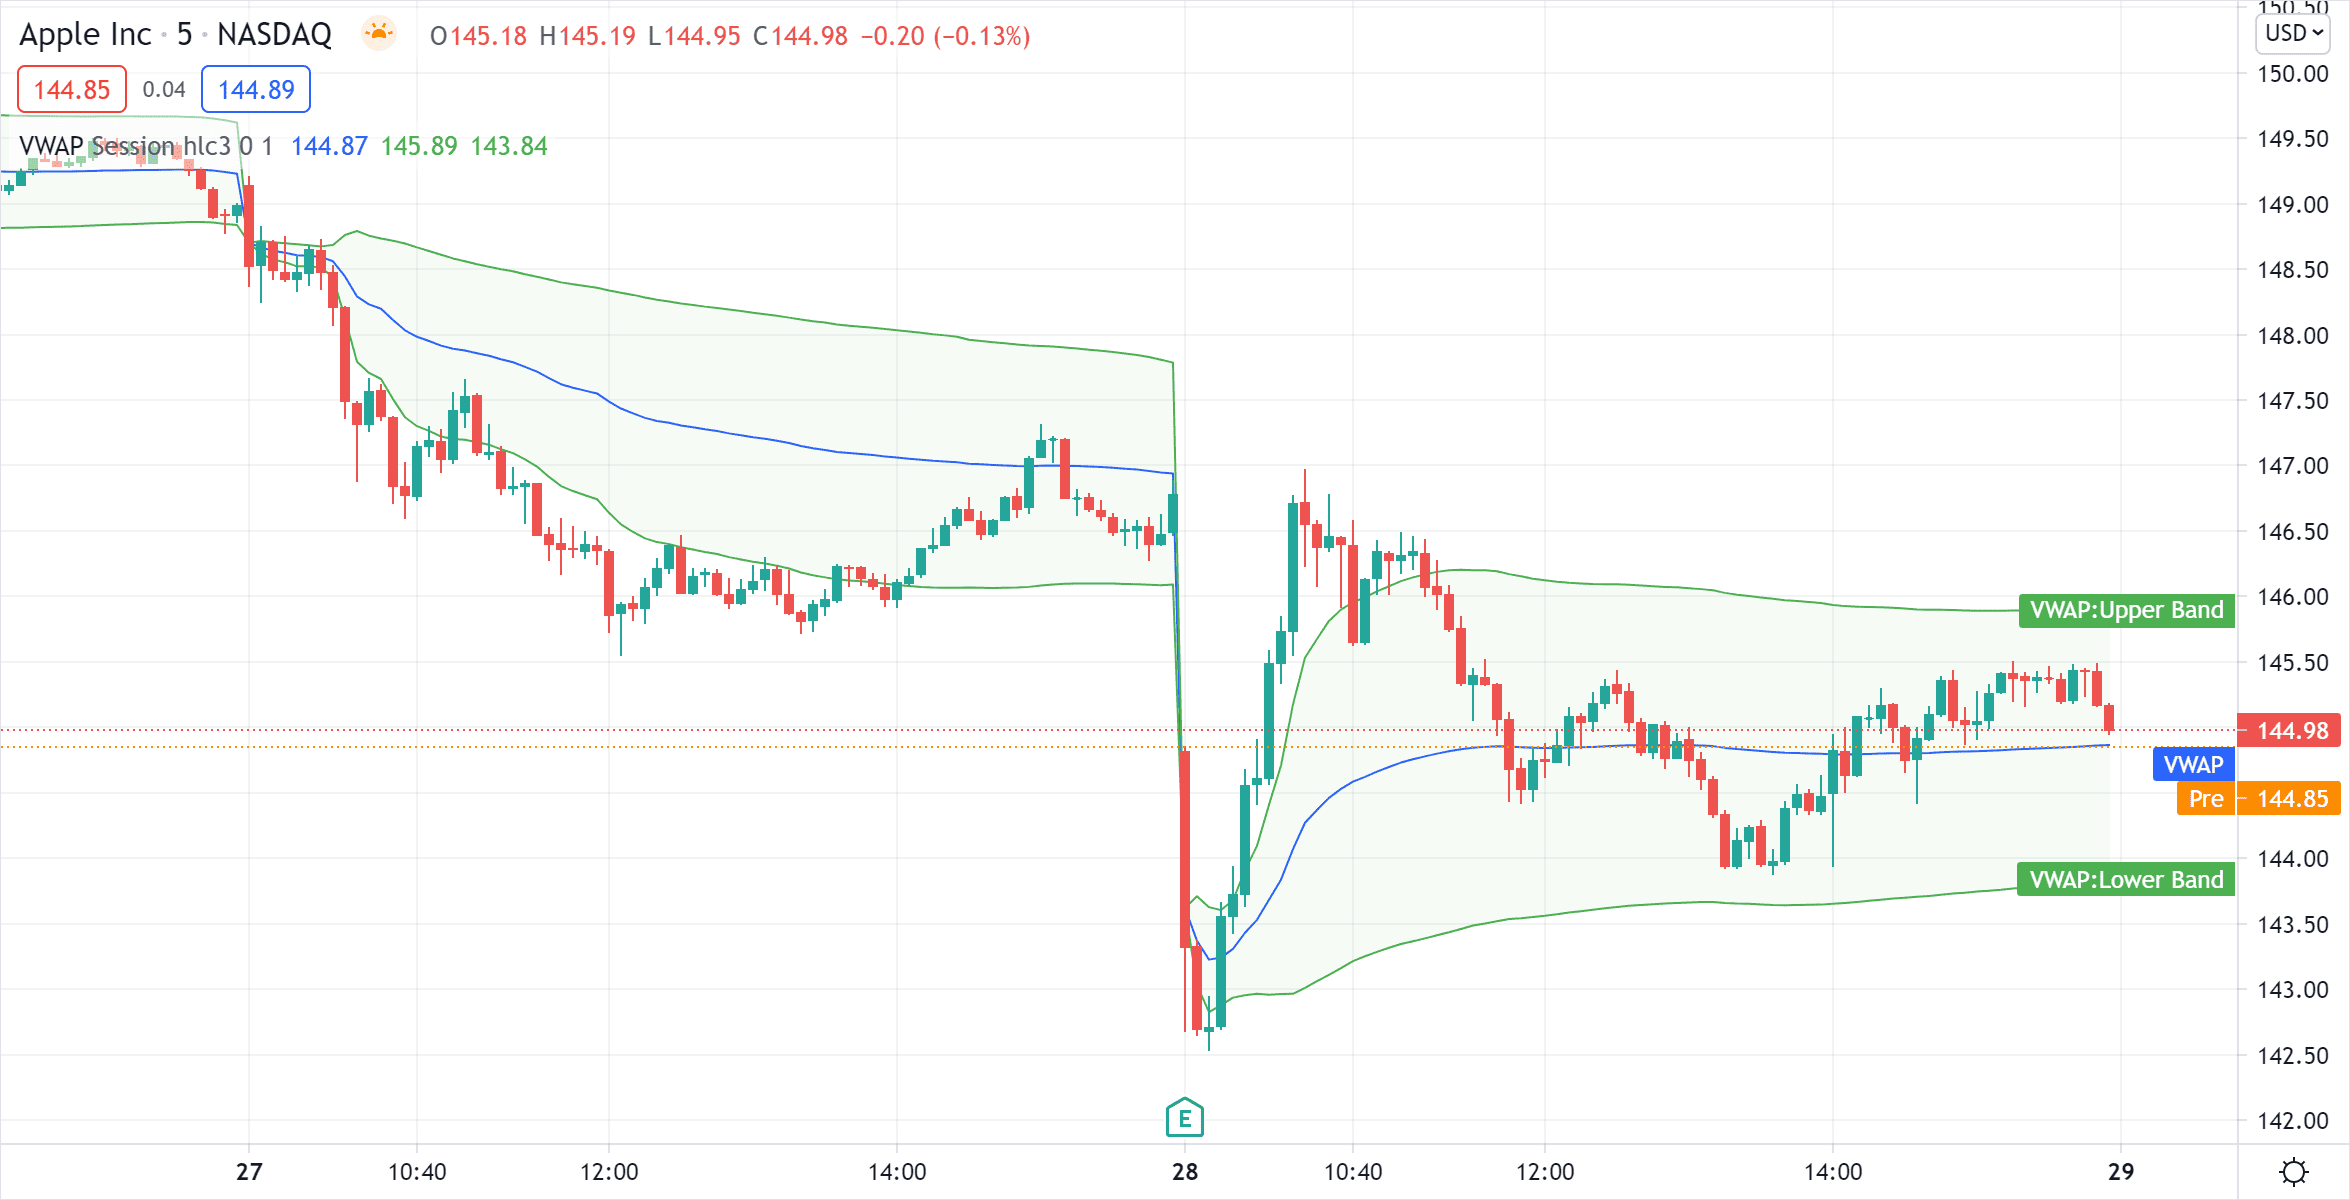
- 5-minute: offers a less granular and a more smoothed-out market view.
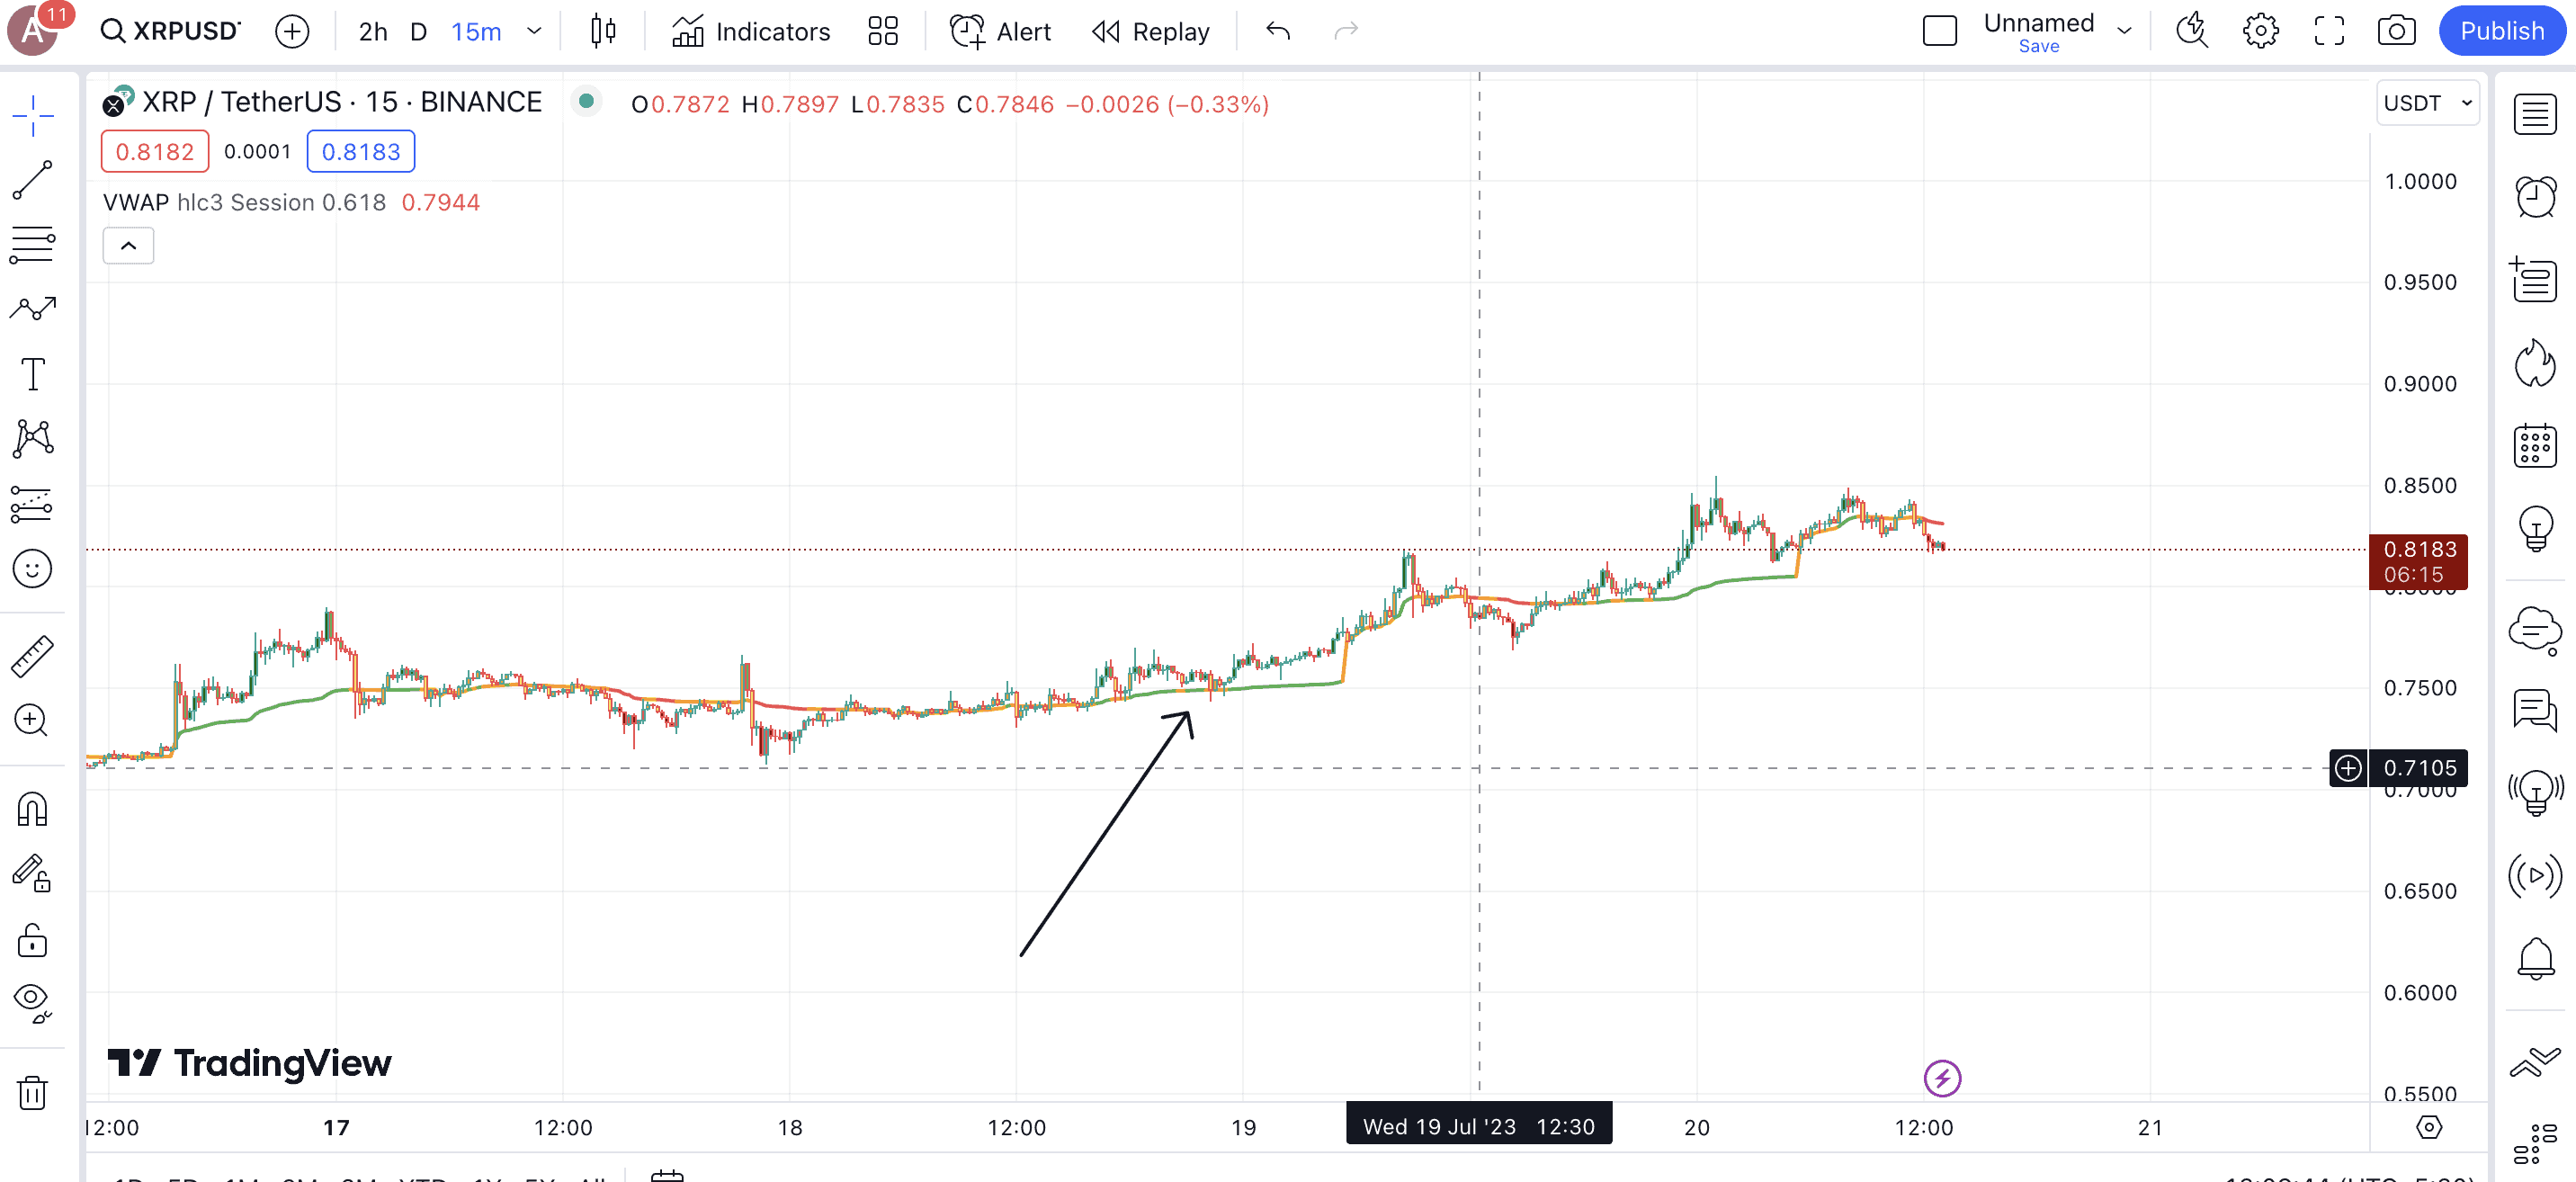
- 15-minute: meant for gauging the broader VWAP or price trend.
Different traders have different ways of exploring the VWAP formula for scaling and other short-term trading strategies:
But the question here is, why is VWAP good enough for shorter timeframes?
- As the volume is in the denominator — the number of units traded — an increase in the number doesn’t necessarily impact the overall price that much.
- The VWAP indicator resets every time the market opens, offering a clean sheet for the traders to work with. Regarding crypto trading, this idea can be used to analyze the movement of an asset across any short timeframe.
However, regarding the crypto market, VWAP can also be used for larger timeframes — hours and days even. Unlike the standard equities market, crypto doesn’t shut shop at the end of the day. Instead, it is a continuing trading phase with different VWAP timeframes working as support and resistance levels.
Did you know? VWAP levels work like unspoken support and resistance levels. If the price of an asset is trading above the VWAP, it might be working as a support and could potentially mark an exit if the asset price breaches the VWAP. In case the price trades lower than the VWAP, the indicator might work as resistance and could trigger a potential entry if the price moves above the VWAP.
Step-by-step VWAP calculation
We shall now use a hypothetical VWAP example to assess some example insights the tool can provide.
Suppose you start calculating the VWAP progression at 10.00 am and take 1-minute timeframes into consideration.
10.00 am: 100 units of X at $10 each (volume is 100 and VWAP is 100 x 10 / 100 = $10)
10.01 am: 500 units of X at $11 each (volume is 100 + 500 = 600, and VWAP is 10 x 100 + 11 x 500 / 600 = $10.83)
10.02 am: 400 units of X at $10.5 each (volume is 100 + 500 + 400, and VWAP is 10 x 100 + 11 x 500 + 10.5 x 400 /1000 = $10.70)
While these are hypothetical figures, you can extend the same across multiple one-minute timeframes. We can draw insights from the VWAP calculations, considering that the trader plans to buy a few units at 10.02 am.
Case 1: Trading above the VWAP
If, at 10.03 am, the trader wants to buy a few units of X at $11. The VWAP at 10.02 am is registered at $10.70, meaning that even though the short-term trend is bullish, the trader is paying a premium as compared to what other traders paid for the same asset. The VWAP of $10.70 becomes the support line in this case, and a stop loss can be put lower than $10.70 as part of the risk management strategy. You can use grid trading strategies to initiate such incremental trading ideas.
Case 2: Trading lower than VWAP
Anything under $10.70 can be considered a value-buying opportunity in the short term. This is where the VWAP acts as the resistance level, offering decent entry options once breached.
In addition to these cases, VWAP levels can also be used to assess short-term trend strength and track market sentiment. For instance, if, at any level, the trading price continues to trade below the VWAP, you can be sure about the bearish sentiments. Do note that VWAP keeps changing with time, and it is advisable to have a VWAP reference point in mind to track the price moves across the day.
How VWAP fares against other indicators
VWAP is a useful indicator for technical analysis. Yet, it isn’t the only one around. Novice traders often confuse it with the likes of TWAP or Time-Weighted Average Price and even Moving Average indicators. But no fear: here are the differences.
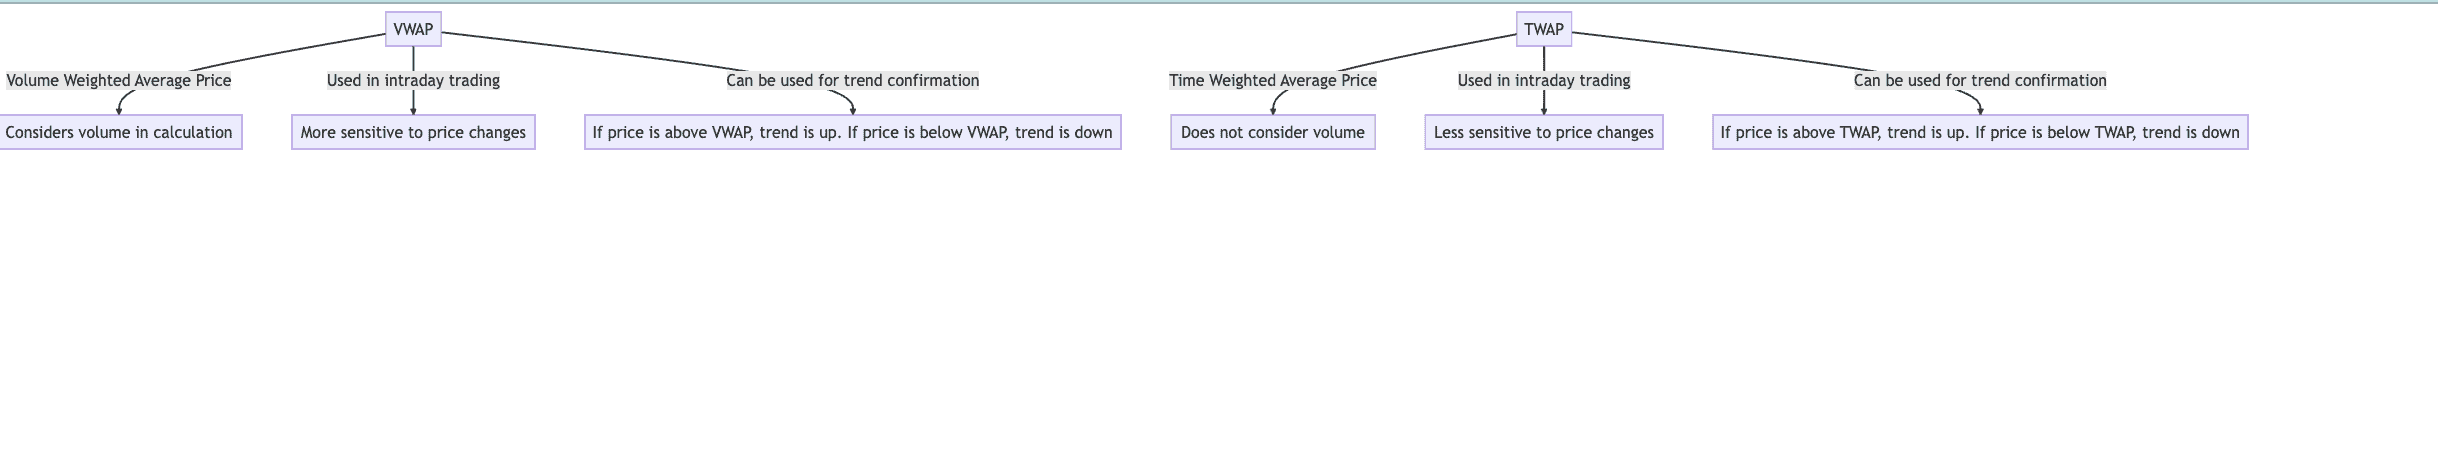
VWAP vs. time-weighted average price (TWAP)
Unlike VWAP, where the calculation involves adding up every trade and then dividing by the number of units traded for a given crypto or share across the given day, TWAP is more focused on time. It takes the average of candlestick instances — the high, low, opening, and closing prices. Simply put, TWAP feels like a more smoothed-out average of the prices, not a function of the traded units.
Here is what the TWAP formula looks like:
TWAP = ∑ (High + Low + Close + Open)/4 for each period / Total number of periods
Also, here are the trading scenarios suitable for VWAP and TWAP indicators, respectively:
VWAP is useful for:
- Intraday trading
- High-volume crypto trading
- Checking out crossovers
- Algorithmic and institutional-grade trading
TWAP is useful for:
- Large order executions
- To mitigate the effects of market volatility
- Low volume trading
It is important to clearly understand the VWAP vs. TWAP concept to ensure you use the right indicator per your particular needs.
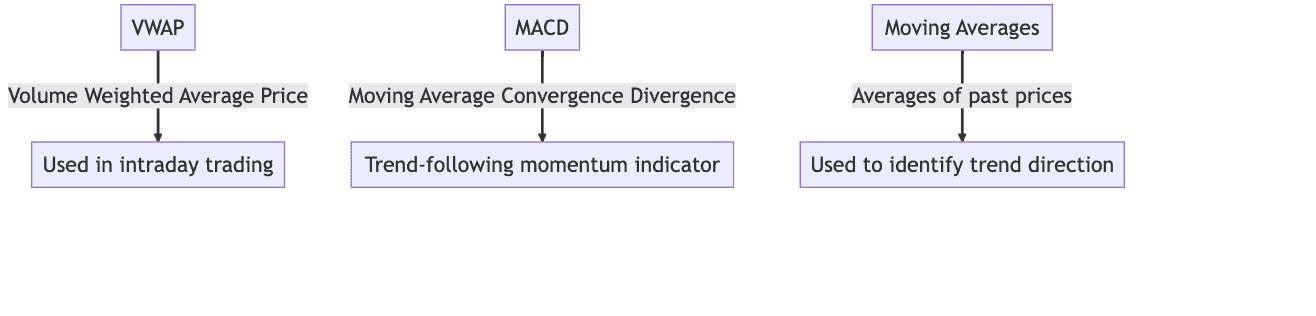
VWAP vs. moving averages
It is common for a new trader to confuse the VWAP line or level with a moving average line. While even an MA line hints at a price average, it is distinctly different from the volume-weighted average price. Here is how it fares against both simple and exponential moving averages:
VWAP vs. moving average: how VWAP fares against SMAs
VWAP weighs prices based on the trading volume. However, in the case of the simple moving average, every data point for the given period is given the same level of importance. For instance, a 50-day SMA takes the data from the past 50 days and averages out the same without any bias. A VWAP, on the other hand, emphasizes volume-based trades at any given instant.
This is the reason why the VWAP indicator is a more reliable tool for tracking high-volume trades. As SMAs are standard price-based averages, they might be slow to react to trades that happen in bulk or have volume-specific consequences.
Comparing VWAP to exponential moving averages
Unlike SMAs, EMAs assign more weight to the current data points. However, EMA, or the Exponential Moving Average, is still a function of price and not volume. Therefore, if you are seeking an indicator to track volume-based trades, VWAP is the better choice.
However, as EMAs are faster to react to price changes, experienced traders often use the VWAP with EMA to achieve two things: locate the most active trading zone using VWAP and locate the price sensitivity using EMA.
Using EMA and VWAP is possible, provided you are using smaller timeframes and the most appropriate EMA values.
Did you know? Nine and 21-period EMAs are typically used by short-term traders for receiving quick confirmations.
Advantages of using VWAP
There is a lot more to the VWAP in technical analysis than just ease of usage. Here are some of the most obvious perks of using this lagging trading indicator:
Filters out market noise
As the VWAP gives the volume-weighted average price of an asset, it represents the broader market sentiments more accurately. Unlike other indicators that are simple and exponential moving averages that focus solely on the prices, VWAP takes the units of an asset sold into account, making the premise more solid and info-rich.
Identifies support and resistance
As a scalp trader, you might want to locate chart-based resources that are more accurate than the standard support and resistance lines. This is where VWAP comes in handy as it is precisely ideated for smaller, scalping-like timeframes, like one-minute, five-minute, or more.
VWAP as the test line:
Using VWAP as a support line can also help you implement the short-term falling knife strategy, where a sudden, sharp correction occurs. Yet, to use it to the fullest, you must use other key chart-based support lines with the VWAP.
Confirms breakouts
VWAP can be useful when it comes to confirming short-term breakouts. If you plan on trading a 15-minute timeframe but aren’t sure as to which indicator would be the right fit, look for the price to move above or below the VWAP line. That can help you find the right point to enter or even exit.
How do you use the VWAP indicator?
Even though the concept driving the VWAP indicator — trading volume — is pretty straightforward, implementing it can become a challenge if you do not understand how the line works. As part of a standard application, you should note that the VWAP indicator is simply a line — like a moving average line.
A few VWAP variations exist, like deviation bands, which, like Bollinger Bands, consider the VWAP deviation from the main line. We shall look at the usage of both these forms throughout our discussion.
Using VWAP crossover signals
The way the price of a cryptocurrency interacts with the VWAP line says a lot about the momentum. For starters, if you see the price crossing above the VWAP line, you can term it a bullish crossover. This might indicate that prices might keep rising, provided other indicators are welcoming.
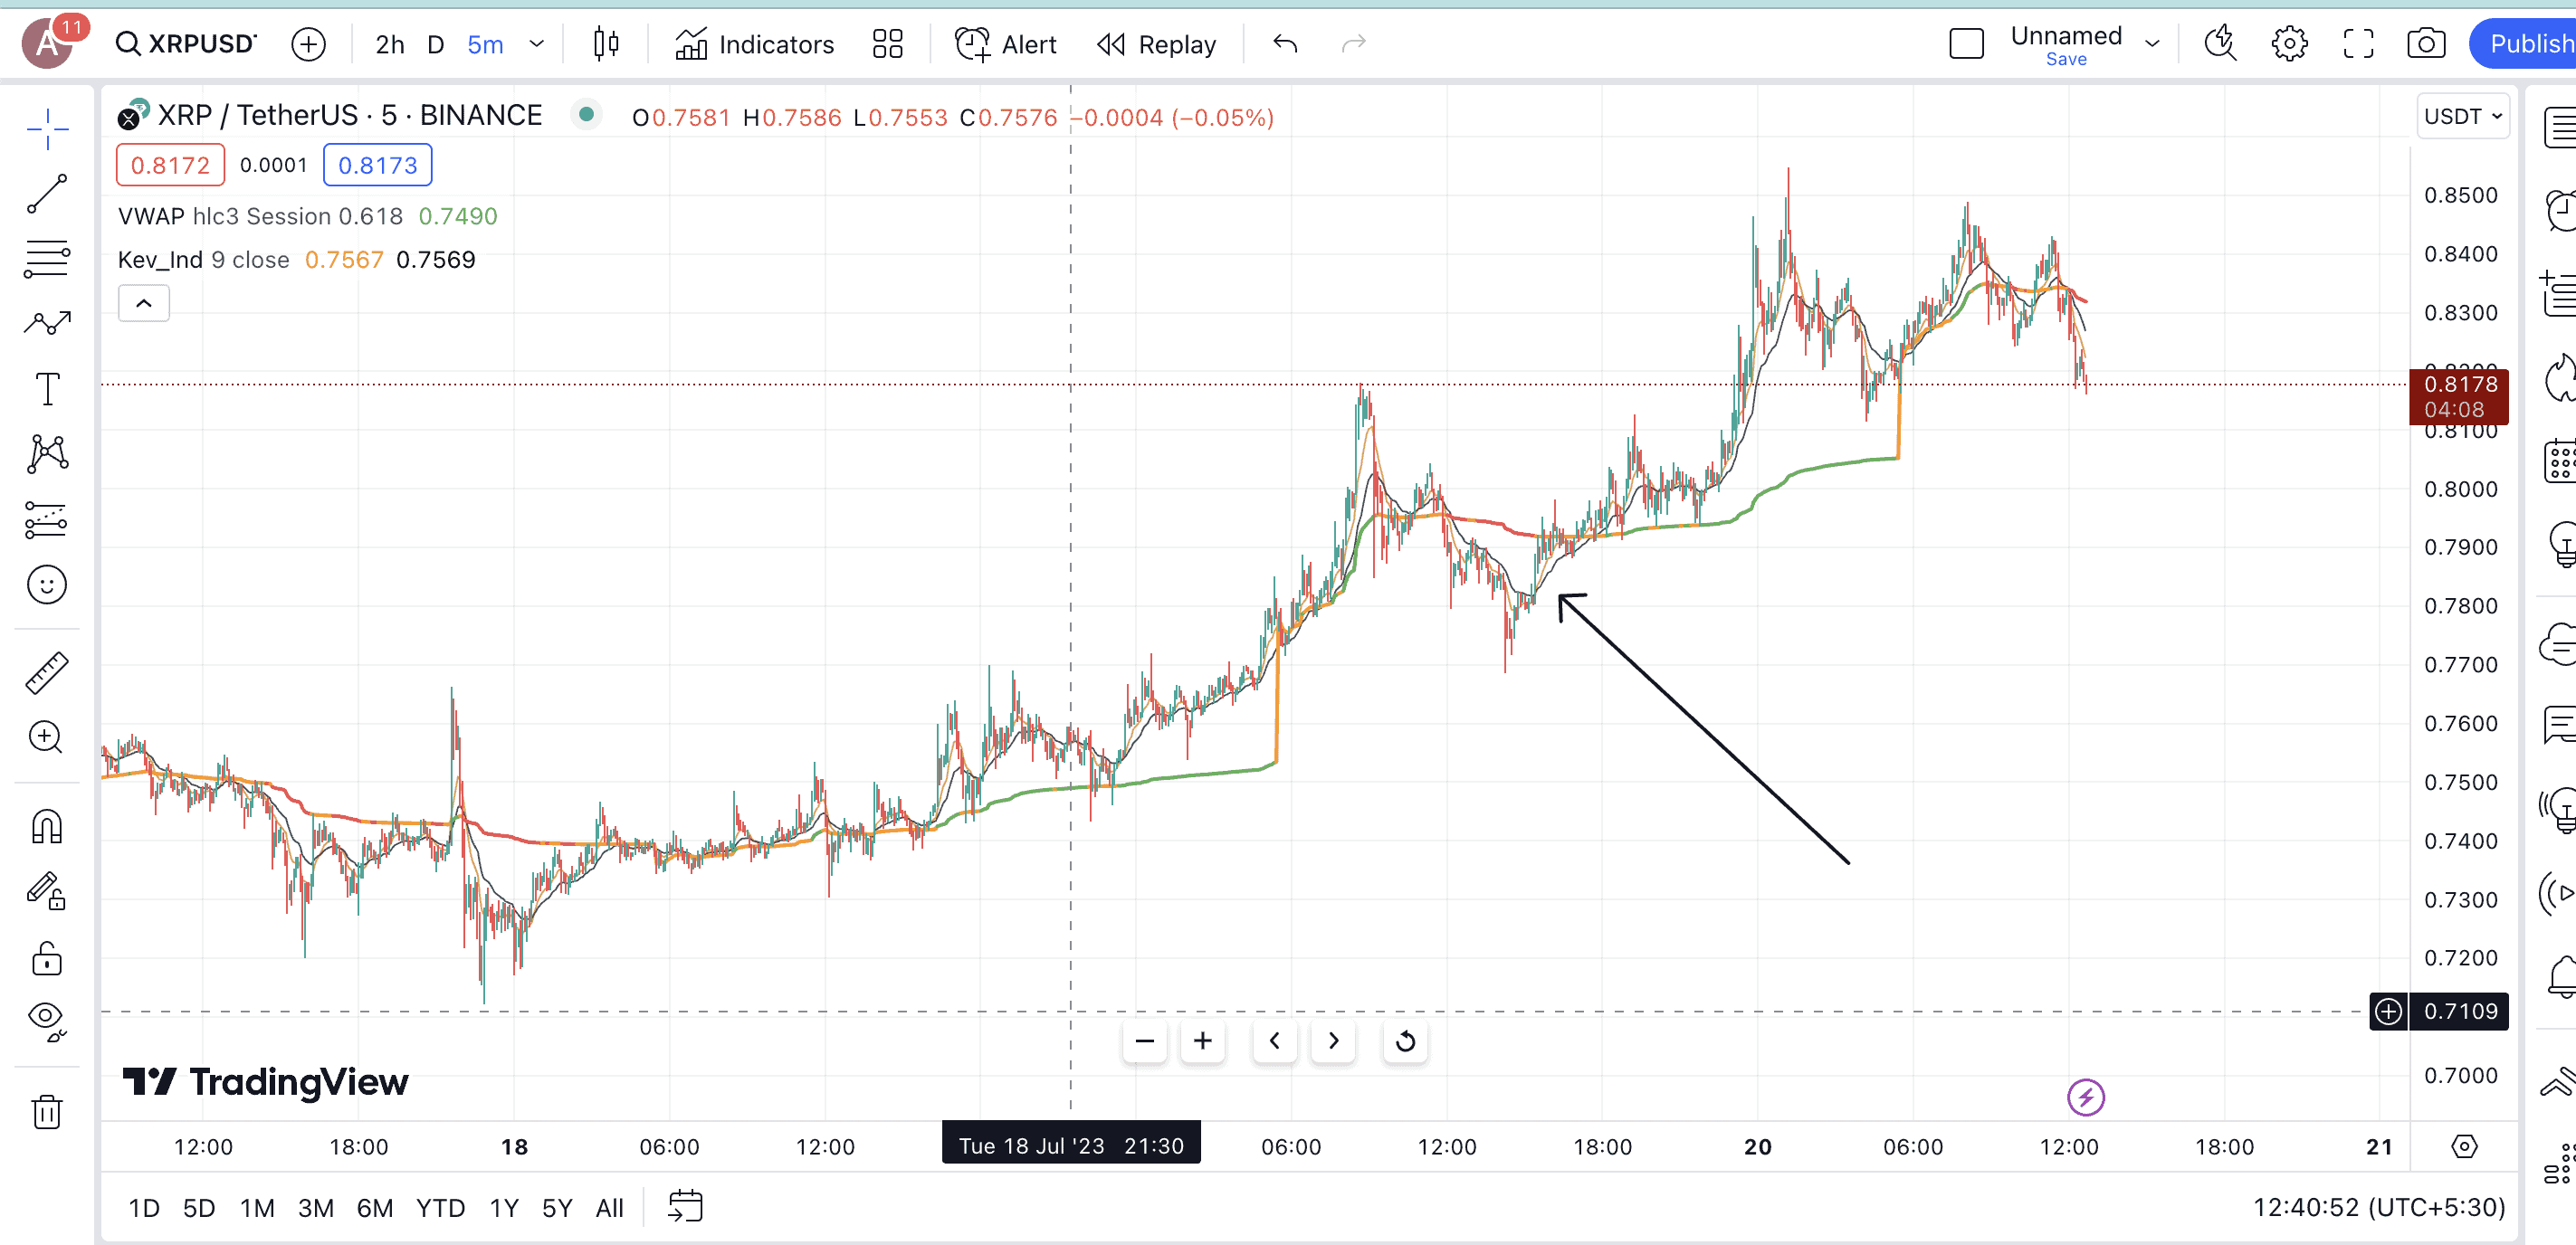
A bearish VWAP crossover happens when the price breaches and moves lower than the VWAP line. This signals a weakening price momentum and a possible correction.
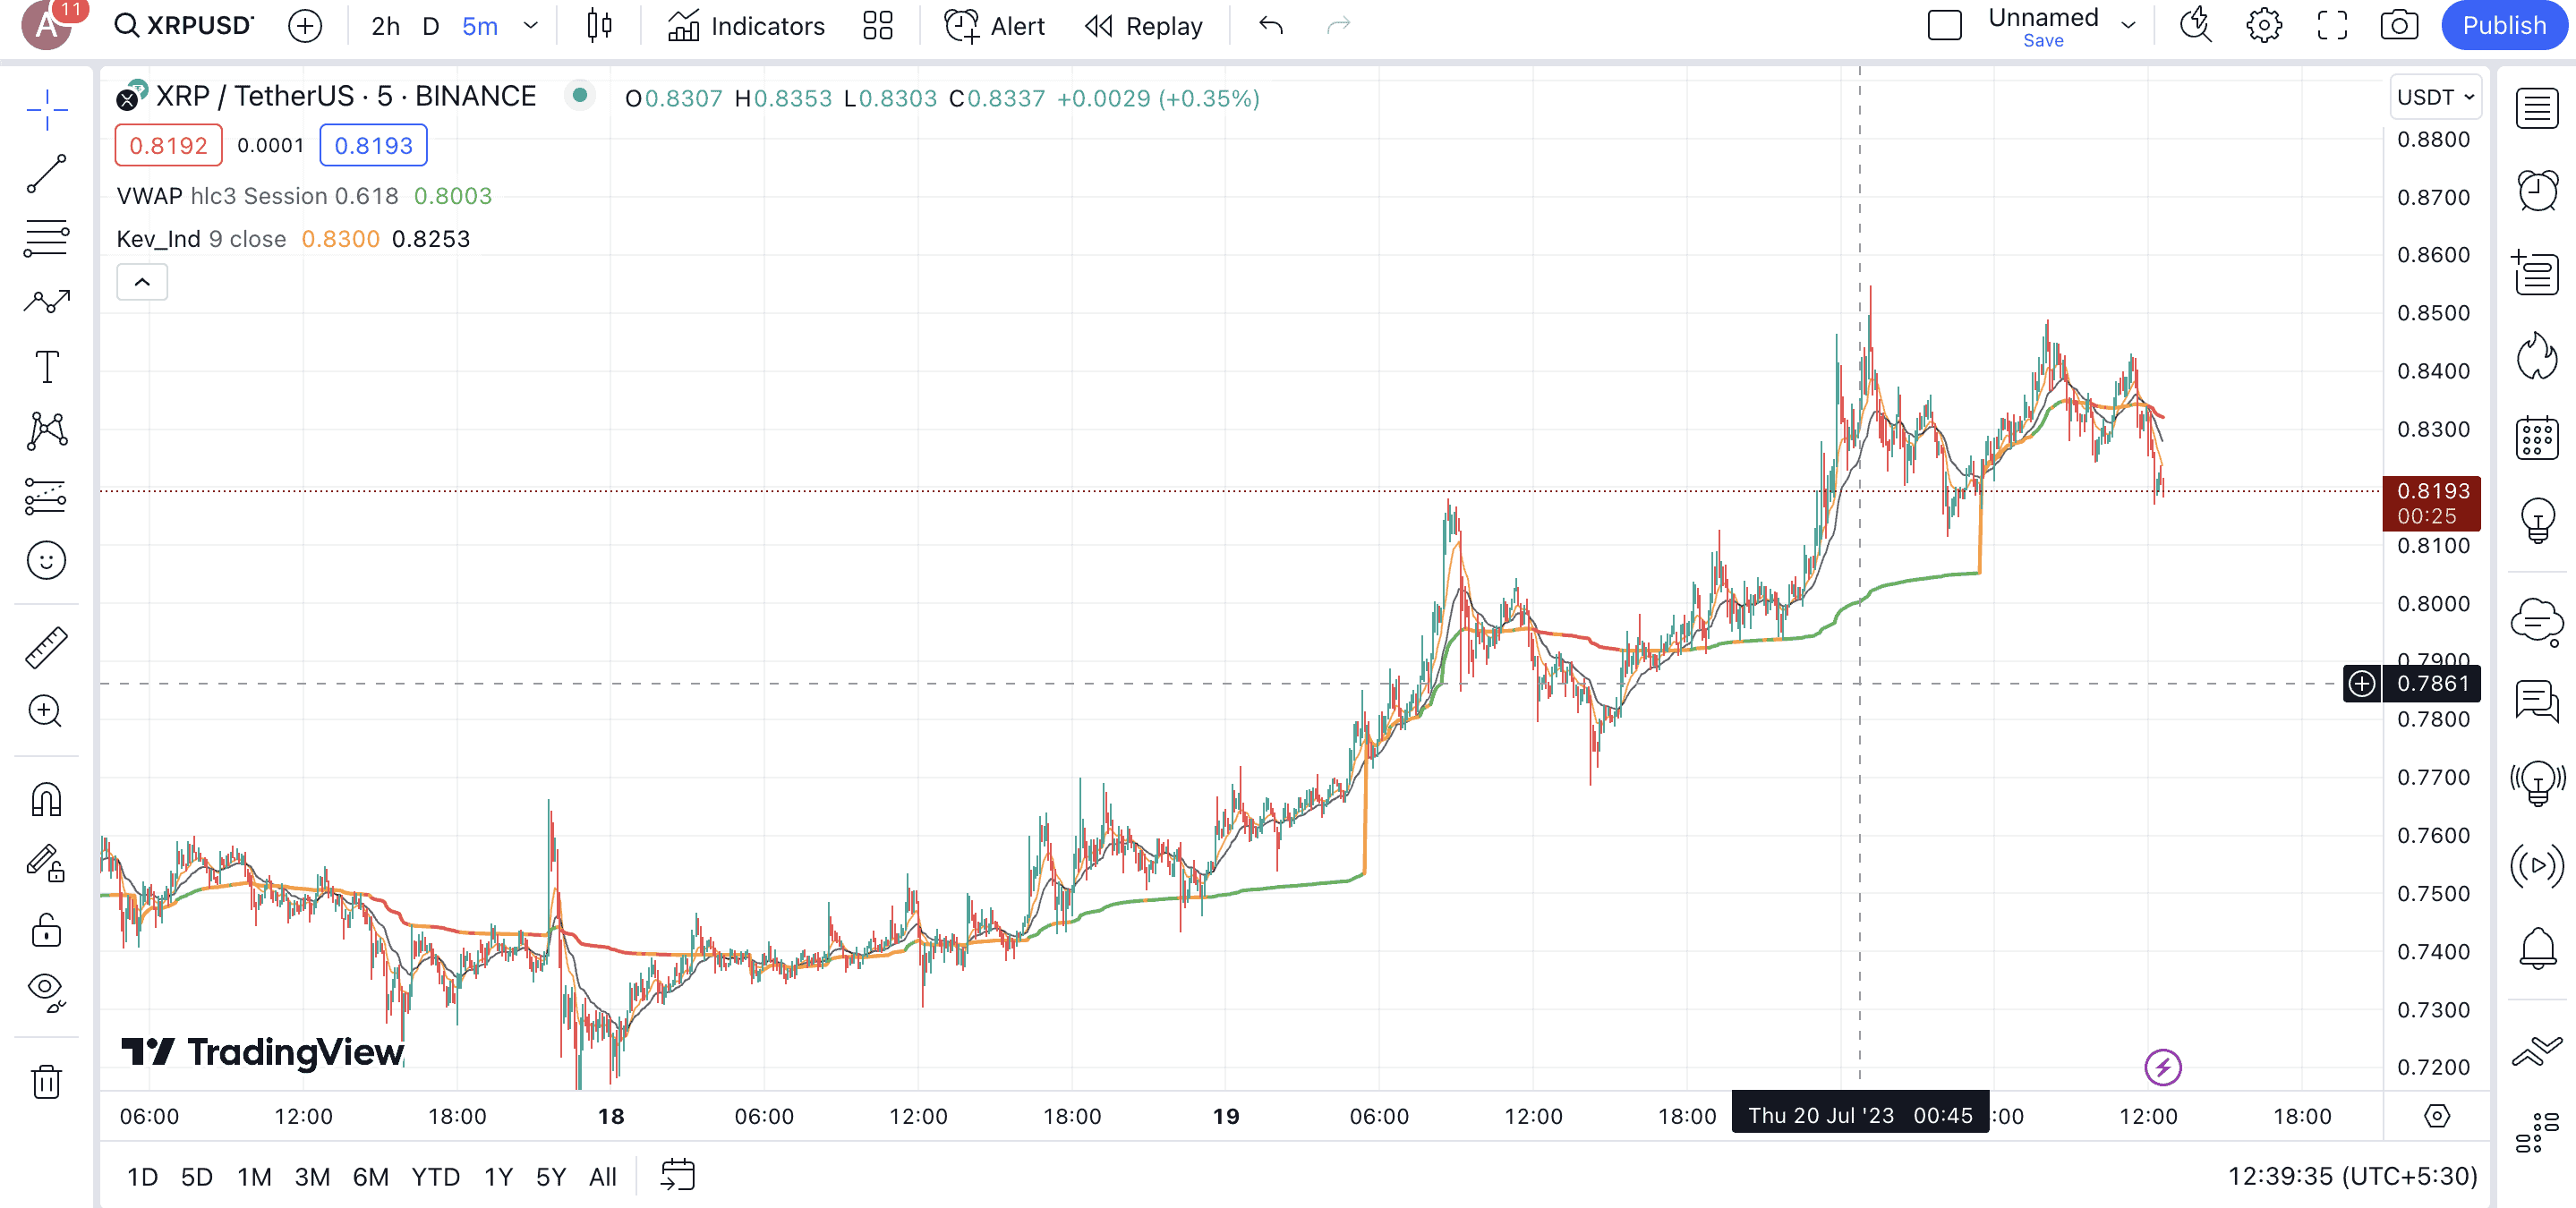
However, if you plan to use the VWAP indicator on trading platforms like TradingView, you can set VWAP crossover alerts. For crossovers, you can choose “Crossing” as the alert, and you will get the notification every time the crypto asset moves the way you want it to.
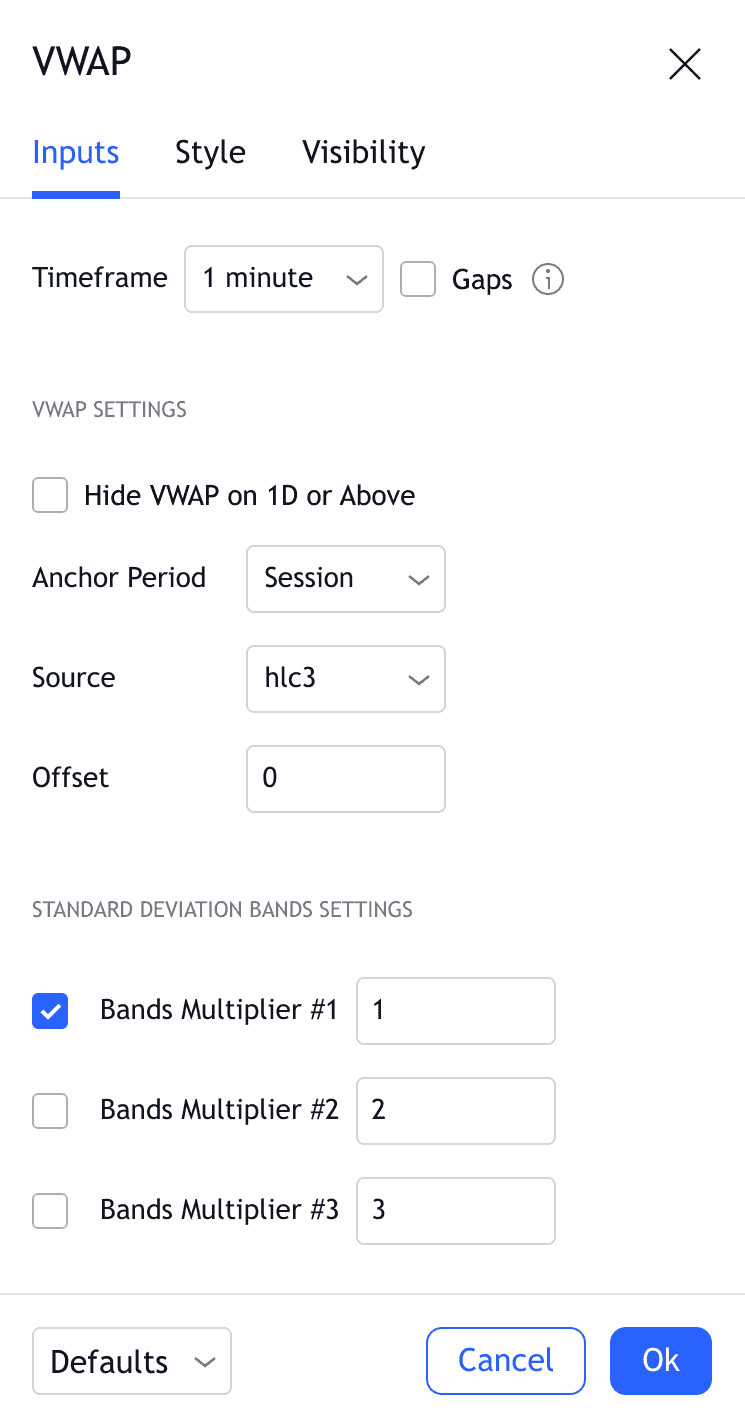
Note: While activating the VWAP indicator on platforms such as TradingView, you might come across different inputs like open, close, hlc3, and more. For the sake of simplicity, it is better to plan hlc3 or “Typical Price” as the reference indicator.
Combining VWAP with other indicators like MACD
The VWAP is great at revealing the short-term trend of an asset. However, if you are an experienced trader, you might even want to consider pairing VWAP with the likes of MACD or the Moving Average Convergence Divergence indicators. This will give you get better confirmations.
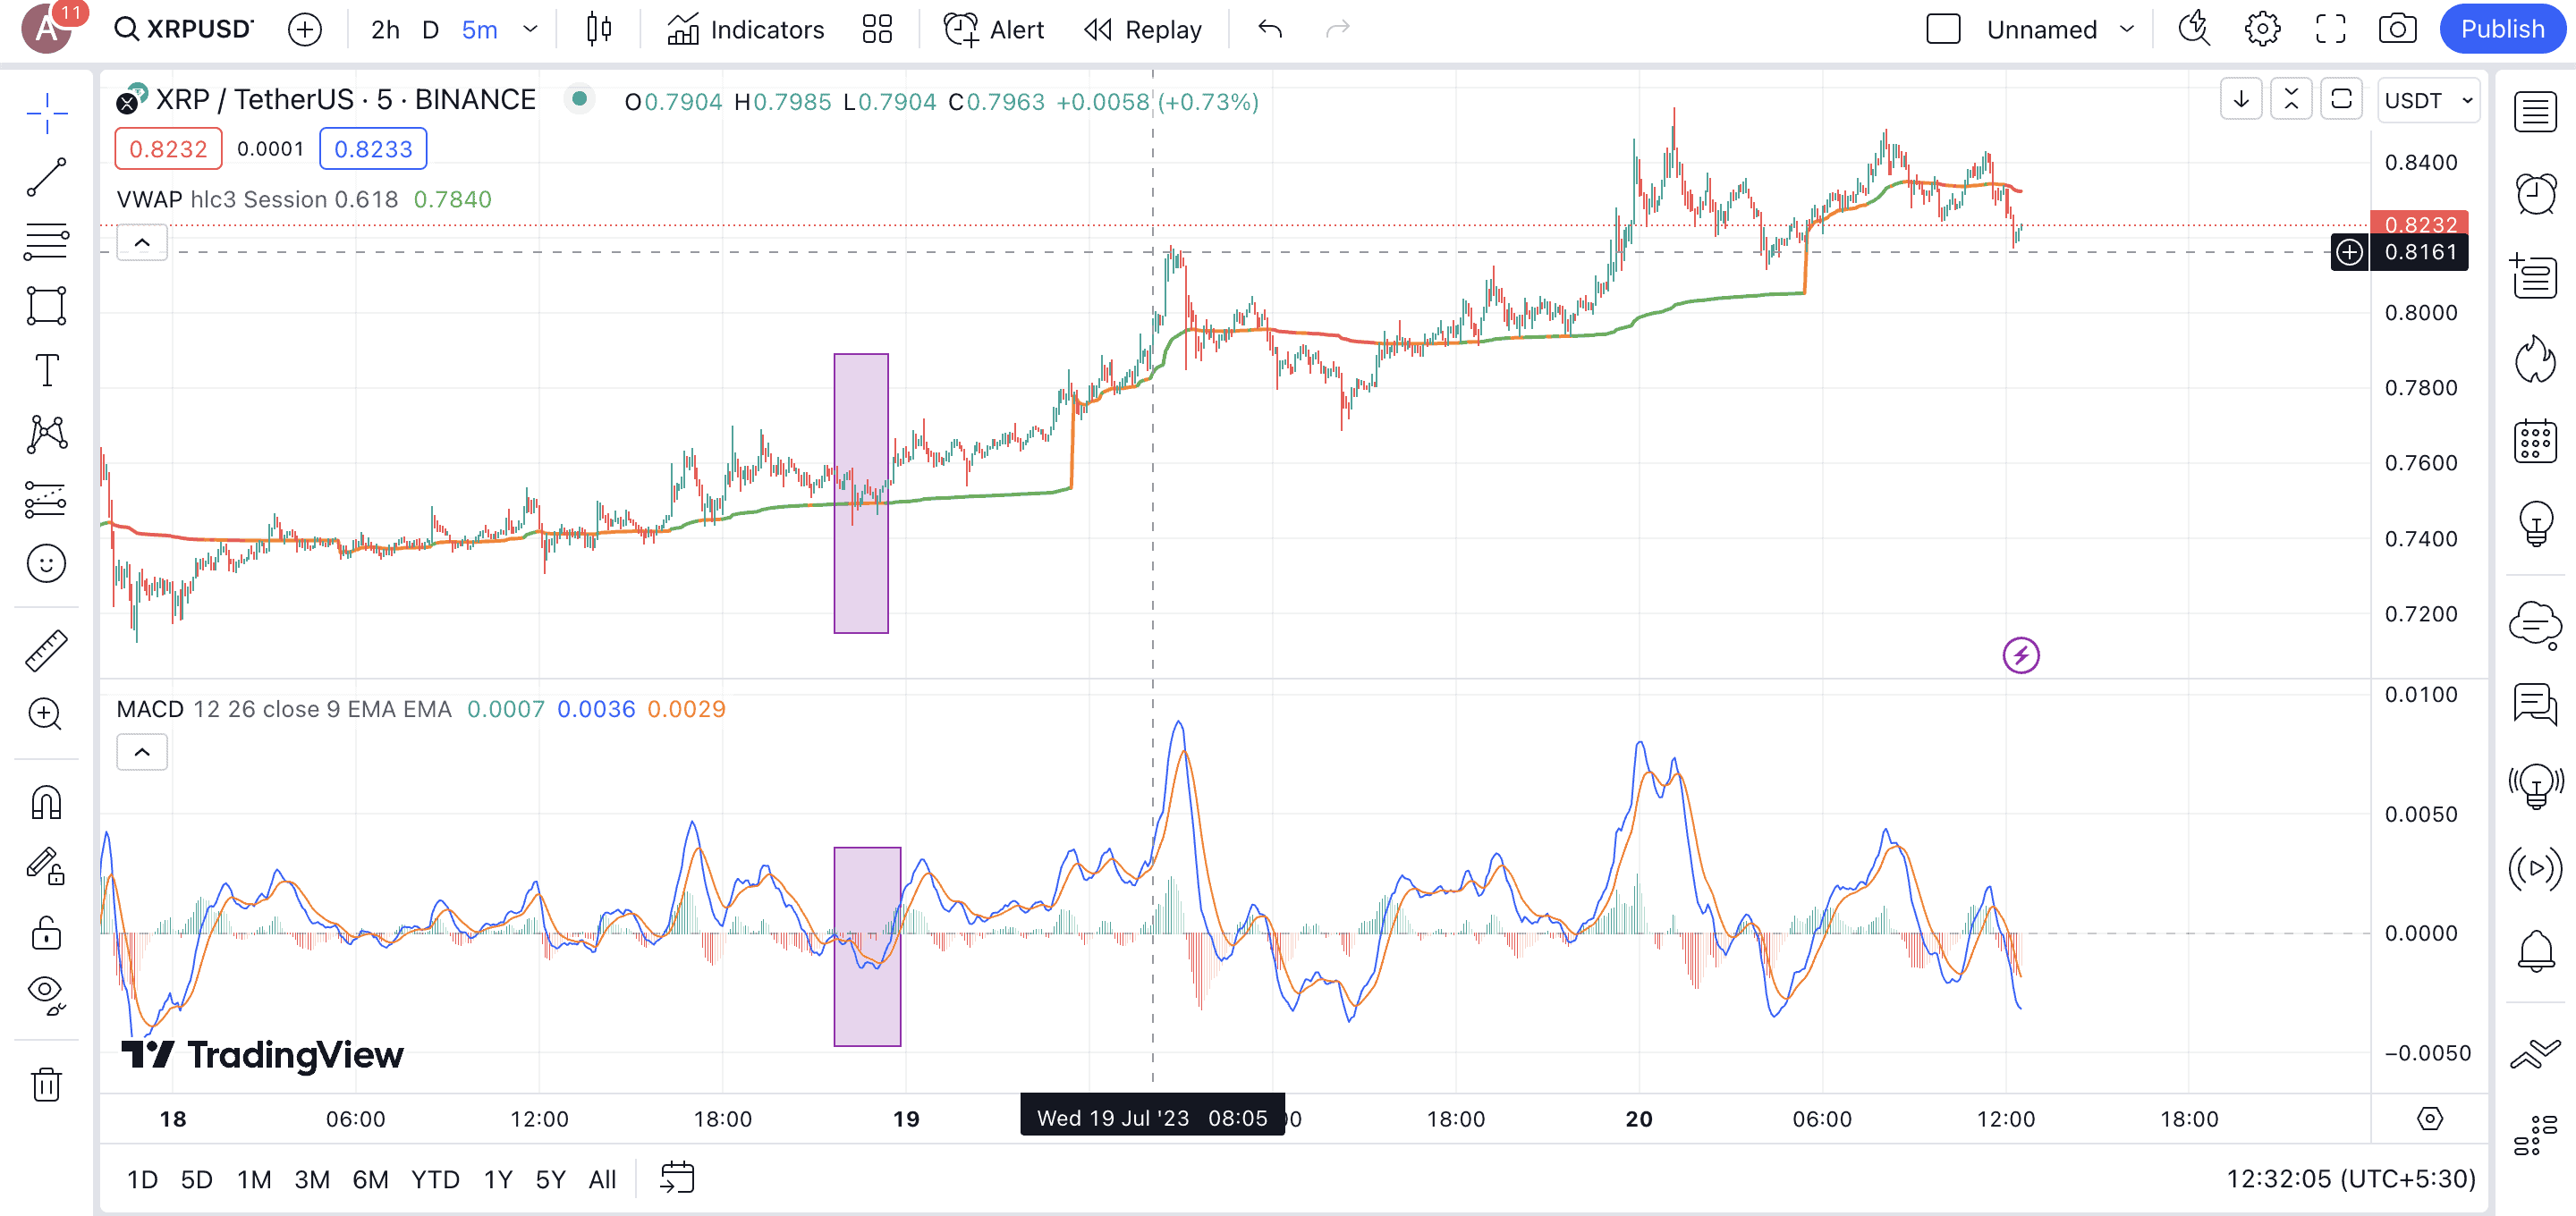
Combining VWAP with MACD is easy. The idea is to open the MACD indicator in the same timeframe as VWAP. Every time you encounter a VWAP crossover, bullish or bearish, you must confirm the strength of its by looking if the MACD line is crossing above or below the signal line.
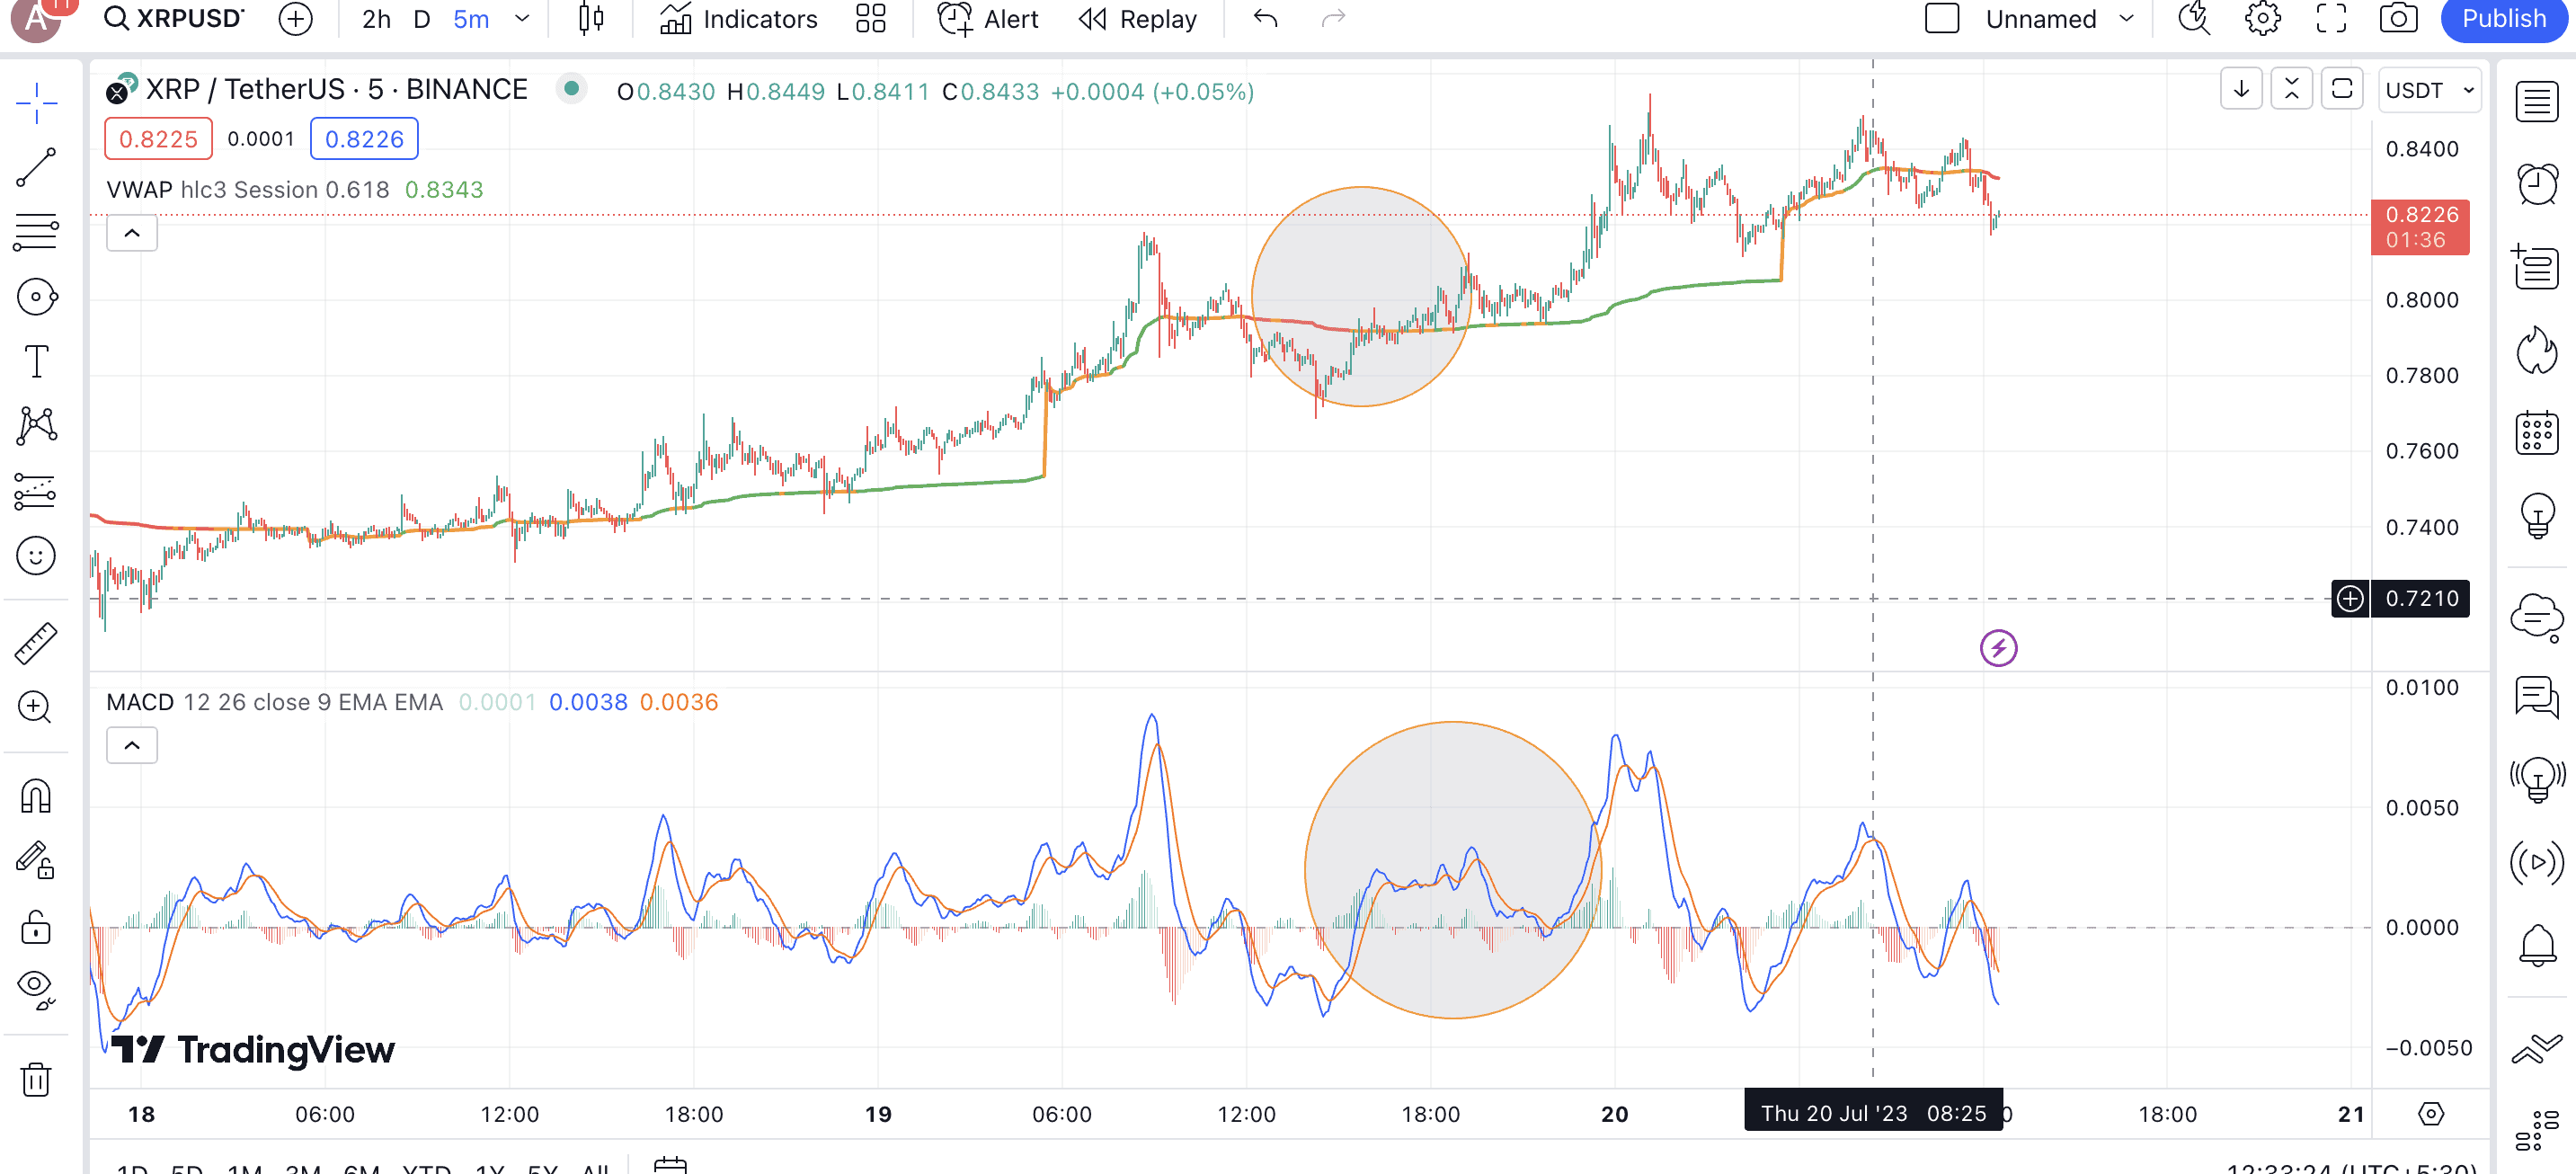
VWAP, EMA crossover, and MACD indicators can work together to give you the best confirmations. Also, to use the VWAP trading strategy correctly, you must optimize parameters, timeframes, and other specifications to get the best output. However, using the RSI indicator with VWAP might not be the best option as even the former offers the same set of insights — overbought and oversold zones — making a case for redundancy.
Other indicators that might work with VWAP
If you plan on using the VWAP indicator for crypto, using it along with Bollinger bands also makes sense. This is due to the high volatility of the crypto market. To use this strategy, you need to focus on the VWAP bands, which are the price deviations from the standard VWAP line.
An example of using Bollinger Bands with VWAP bands:
As the upper band of the Bollinger works as a resistance level, you can use the upper VWAP band as another layer of confirmation. Once the upper VWAP deviation band is breached, it is possible to enter the asset.
VWAP trading strategies
Let us now take a closer look at the trading strategies that you can use leveraging VWAP and its inherent concept of volume tracking:
Day trading strategies with VWAP
Day trading is all about fast-paced decision-making. The VWAP indicator can be very useful in this case, and the best way to go about it is to use the “Pullback Strategy.”
The VWAP pullback strategy is all about tracking the price of the asset relative to the VWAP line. Once the price surges above the VWAP line, the pullback strategy is all about waiting for it to come back and hit the VWAP line as the support. We can expect a good value-buying opportunity if the support is strong and the price respects the VWAP line.
In this case, the stop loss or the risk management play should be immediately under the VWAP line. Also, intraday trading using VWAP relies on the potential of this indicator as a key support or resistance line. From a mere glance, you can infer whether the price action is bullish or bearish in relation to the VWAP.
Another important thing to consider is the best VWAP settings for day trading. Even though reading a VWAP indicator primarily remains the same, there are a few considerations related to the best VWAP settings for day trading:
- If you plan on charting VWAP on platforms like TradingView, it is better to stick to the default settings using Typical price as input.
- For day trading, you can consider pairing VWAP with the likes of moving averages and MACD.
- The ideal timeframe for day trading could be between one minute to 15 minutes.
Swing trading strategies with VWAP.
Even though the VWAP indicator works really well with a day trading strategy, it can even work for swing traders. To make use of a VWAP-powered swing trading strategy, you should focus on VWAP breakouts over anything else.
Here is how to make it work:
Start by locating the key zones above and under the VWAP line that can coincide with other possibilities, like a channel breakout, a bullish/bearish MACD move (MACD crossing above the signal line), or something as basic as a golden/death MA crossover.
Once the breakout happens and wait for a retracement to make a move. Also, make sure every VWAP breakout is followed by a spike in trading volume. In the case of a VWAP-powered swing trading strategy, it is advisable to enter and exit trades only when the trading prices have successfully closed above or under the VWAP line.
In the case of swing trading, you might have to use 30-day VWAP or even 60-day VWAP levels to get a good grasp of price movements for an extended period of time.
Is VWAP only for day trading?
We need to understand one important thing about VWAP before trying to implement it as part of our trading strategy. Even though the daily reset factor of VWAP makes it ideal for intraday trading, you can even use it for swing trading. The idea is to monitor the price-to-VWAP levels across days only to determine a clear bullish or bearish trend.
VWAP and other use cases:
VWAP can also be a handful if you plan on using it with higher timeframes, like weekly, monthly, or anything else. You should only be mindful that the VWAP indicator might look like a stepped line and not a smooth curve for higher timeframes — 30-day VWAP and similar timeframes, due to multiple resets. Yet, it is worth noting that longer VWAPs lack the same precision as intraday VWAP timeframes.
Tips for using VWAP effectively
VWAP in technical analysis is a handy tool. It doesn’t complicate things and even offers visual cues to studying trends. Yet, there are a couple of tips and tricks to optimize its usage. These include:
Customizing VWAP settings
A standard and widely accepted representation of VWAP is to use the typical price or (high + low + close/3) value as the input. However, you can tweak the input value to just the high, low, or even the opening or closing prices, depending on how you want to see and use VWAP. The secret to making tweaks in VWAP representation is by customizing input values in settings.
Using price deviation from VWAP
Another way of optimizing the VWAP trading strategy is to check for the VWAP deviation — price change from the VWAP line. A deviation on the higher side means that the asset is in the overbought territory, whereas a deviation on the lower side shows that the asset is in the oversold zone. The VWAP deviation strategy is often used as a mean-reversion plan by experienced traders who buy in the oversold zone and sell in the overbought zone.
Drawbacks of the VWAP indicator
Like any other technical analysis tool, even the VWAP indicator is fallible at times. Here are the challenges you can run into while using it:
- Still preferred as an intraday indicator
- It doesn’t work all that well for illiquid markets, where voluminous trades aren’t common
- A lagging indicator that might not accurately capture future price movements and expectations.
- Its usefulness reduces as we move later into the day as the accumulated trading volume acts as the denominator, and a higher value doesn’t do much for the VWAP levels.
- Too dependent on volume data
- Not the best tool to use in trending crypto markets as, in that case, price surges can be based on emotions even.
VWAP indicator: an essential trading tool?
The VWAP indicator offers valuable trading insights. However, to maximize its potential, you are better off using it with the likes of MACD, moving averages, trendlines, and other chart-specific resources. Regardless of that, VWAP is a particularly straightforward trading resource to master, owing to its volume-based premise. And what makes it particularly useful to crypto traders is its ability to supplement quick, intraday trades.


