


Crypto traders need to be wary of many things: market sentiments, price levels associated with individual cryptos, trading indicators, and more. Yet, nothing ever prepares you for an event called the “falling knife.” In trading — asset class notwithstanding — a falling knife refers to a rapid “price drop” phenomenon.
A falling knife is a trading pattern or rather a trading reality synonymous with high beta assets like crypto. The trader should never try catching a falling knife; that would mean trying to defy gravity and opening doors to bloodshed. This detailed piece looks at the causes, asset-specific examples of falling knives, why you shouldn’t try to catch them, ways to read a falling knife, indicators that work best with this pattern, and more.
BeInCrypto Trading Community in Telegram: discuss trends of the market, read technical analysis on coins & get answers to all your questions from PRO traders & experts!
- Unpacking the falling knife: what does it signify?
- What more can a falling knife tell you?
- Factors leading to a falling knife
- Falling knife: what are the fake support levels?
- Dissecting a falling knife pattern: the Terra-LUNA crisis
- How to determine how deep the knife will fall: locating the market bottom
- Reasons why you should avoid trading a falling knife
- When can you trade a falling knife: strategies for the same
- Terms that you might confuse with a falling knife
- To trade or not to trade a falling knife?
- Frequently asked questions
Unpacking the falling knife: what does it signify?

A falling knife isn’t exactly a pattern. Rather, it is a scenario where the price of crypto nosedives, only to keep dipping past multiple support levels to bottom out eventually. For a trader, the idea is to identify the point where the falling knife finally hits the ground. This might be their chance at buying the crypto.
The name “falling knife” isn’t just a colloquial representation of danger. Instead, it serves as a massive warning to traders that buying an asset at a lower price can be risky if the downward momentum is too strong.
Unlike market consolidations and corrections, where rebounds often follow dips, a falling knife is more of a purist. On onboarding the “Dip Train,” prices keep dropping until one of two things happens: an eventual rebound or a permanent value erosion. Regardless of the outcome, safety should be paramount when even looking at a falling knife.
What more can a falling knife tell you?
We know now that a falling knife is a rapid drop in the price of crypto (or any volatile asset) that’s sustained by negative sentiments, piled-up selling pressure, and several other factors.
Here are some of the other insights that you can get from falling knives:
- Identifying a falling knife early in its track can help plan the right exit strategy.
- As the crypto price continues to drop, it might indicate a gargantuan build-up of negative sentiments involving the asset.
- A falling knife can appear in any timeframe, but longer ones accurately represent the market scenario. In crypto, hourly chart patterns that look like falling knives are common and shouldn’t be blown out of proportion.
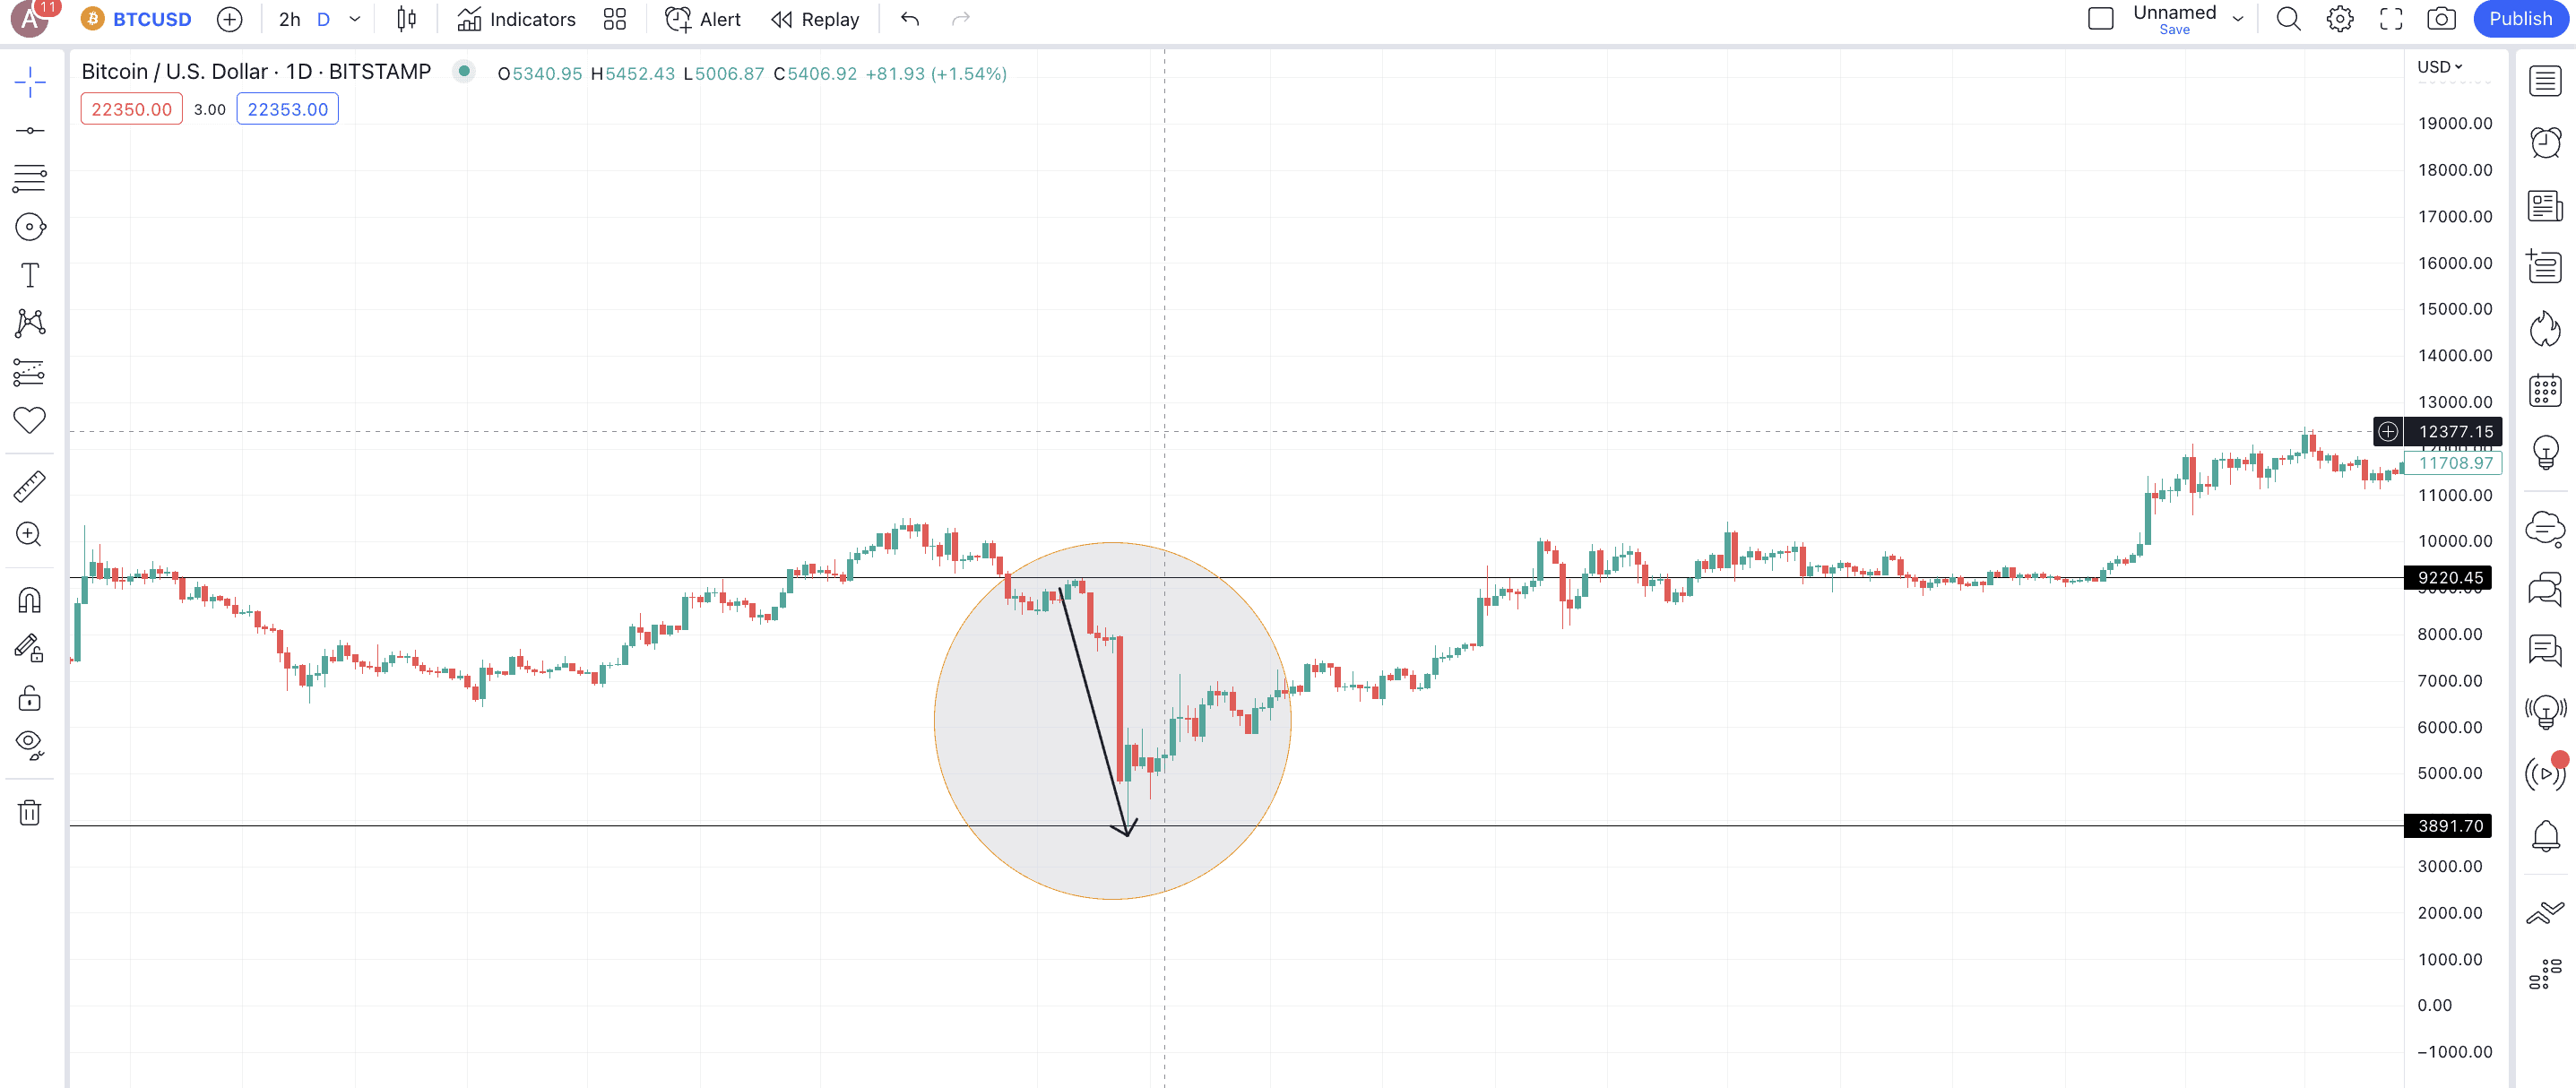
Here is the latest BTC-USD chart, showing a huge dip. The price action of BTC quickly turned on its head, dipping from $23,400 levels to under $22,000 in a small time frame.
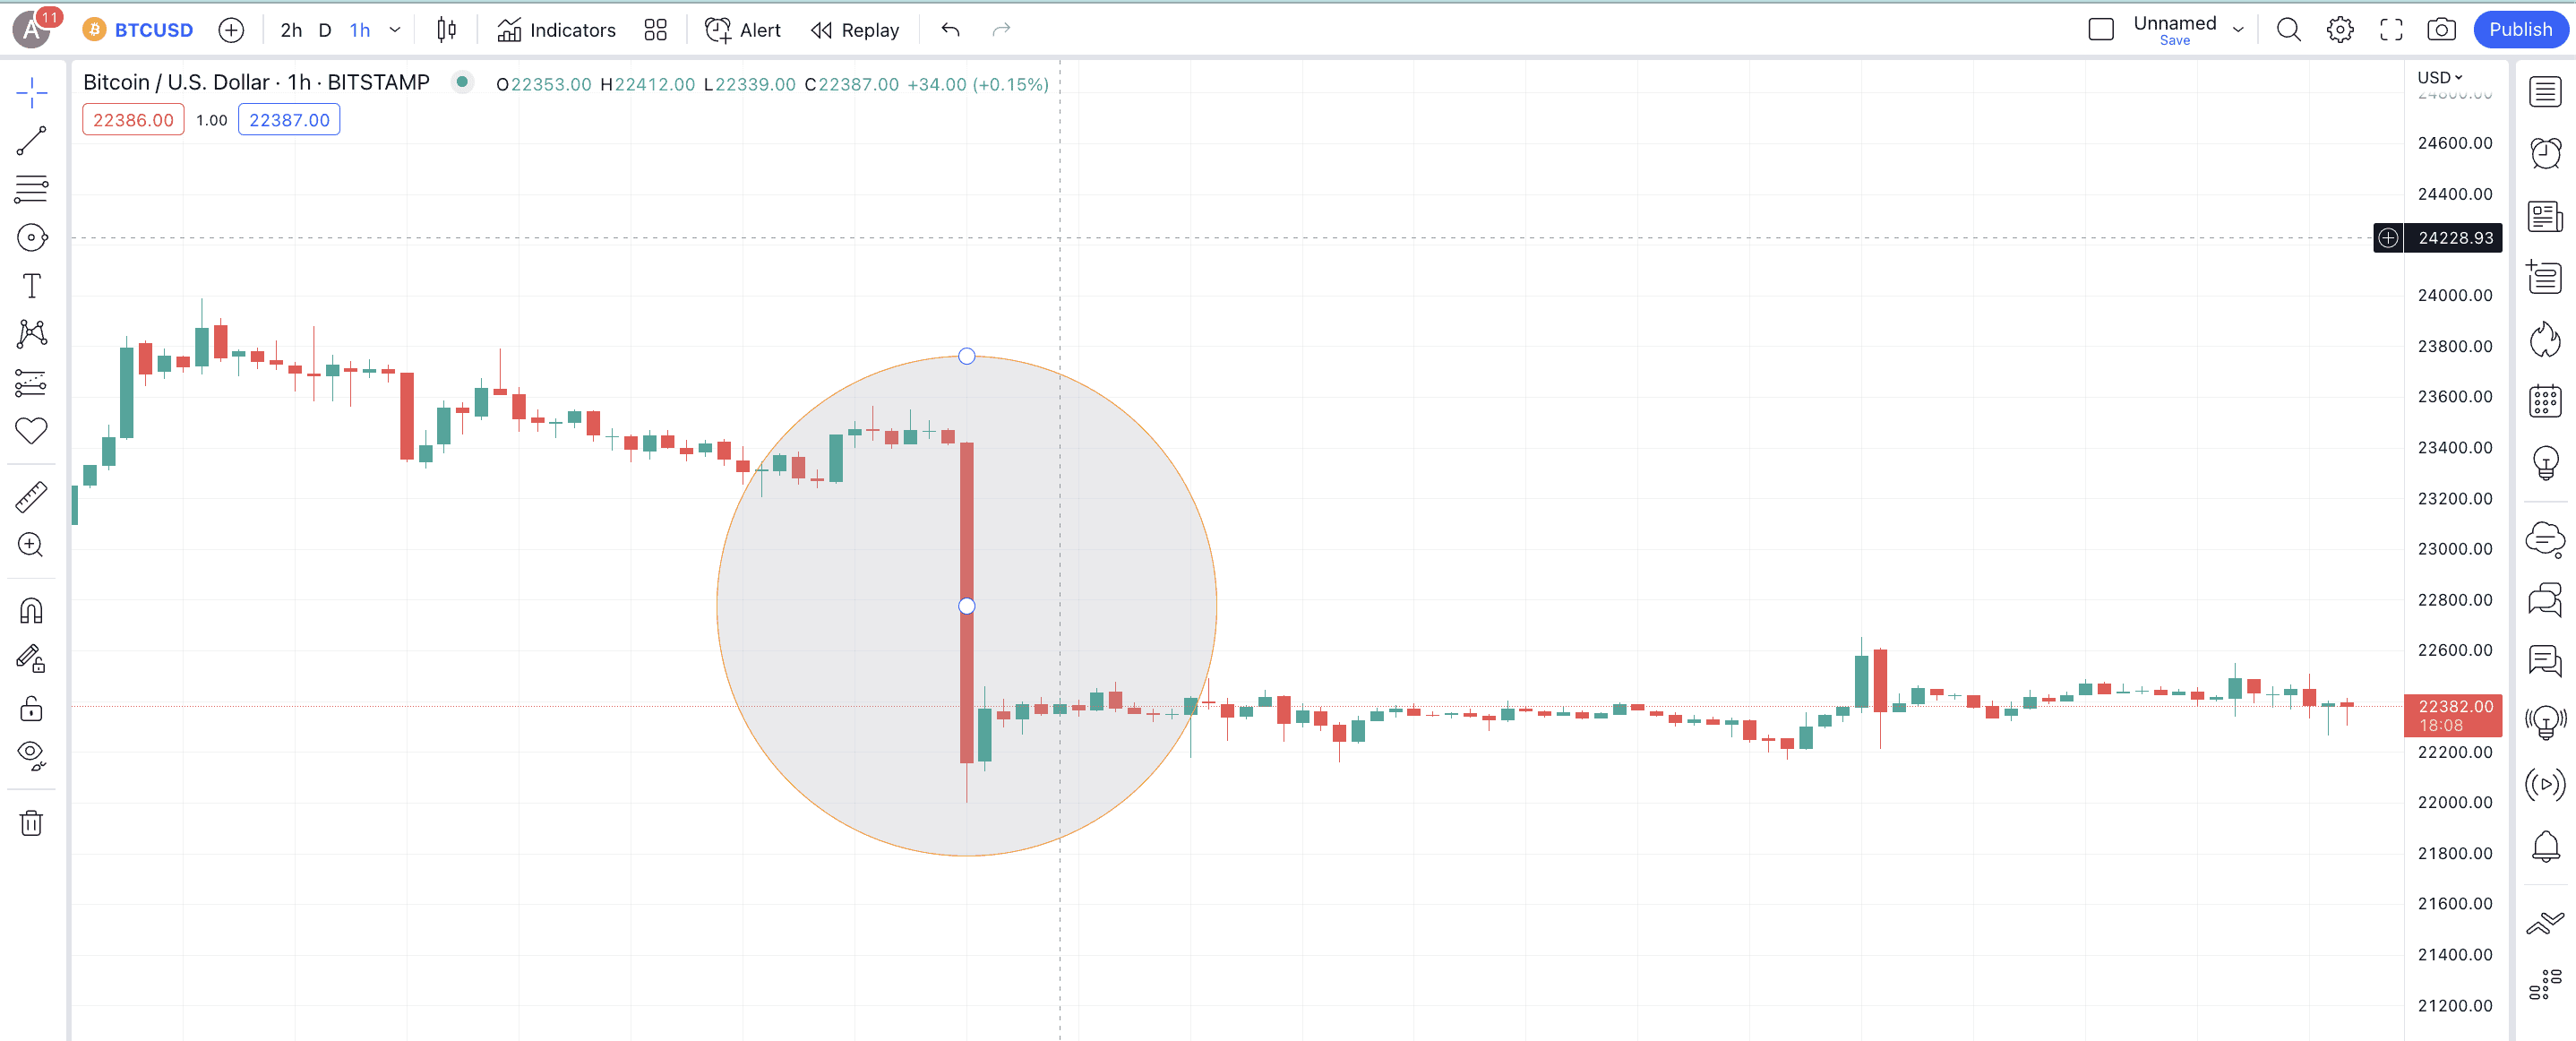
However, as it is an hourly chart, we might consider it a quick correction, not a falling knife.
Factors leading to a falling knife
Price corrections happen when credible chart patterns, indicators, and broader market signs are in play. However, the factors causing crypto prices or even stock prices to fall freely (like a falling knife) are more complex. Let us take a look at a few.
Technical factors
As trading evangelists ourselves, we shall always prioritize the chart-specific factors over other causes for invoking a falling knife. For some crypto assets, support levels (levels that stop the prices from falling further) are packed way too close. Therefore, if one level gets breached with high selling pressure, the chances of other levels getting overwhelmed become way too obvious.
Once breached, the support becomes the resistance. And if it’s a strong level, the chances of a rebound are minimal. Multiple Resistance-Support flips of the R/S Flips can therefore accelerate the move to the downside, eventually bringing a falling knife scenario to fruition.
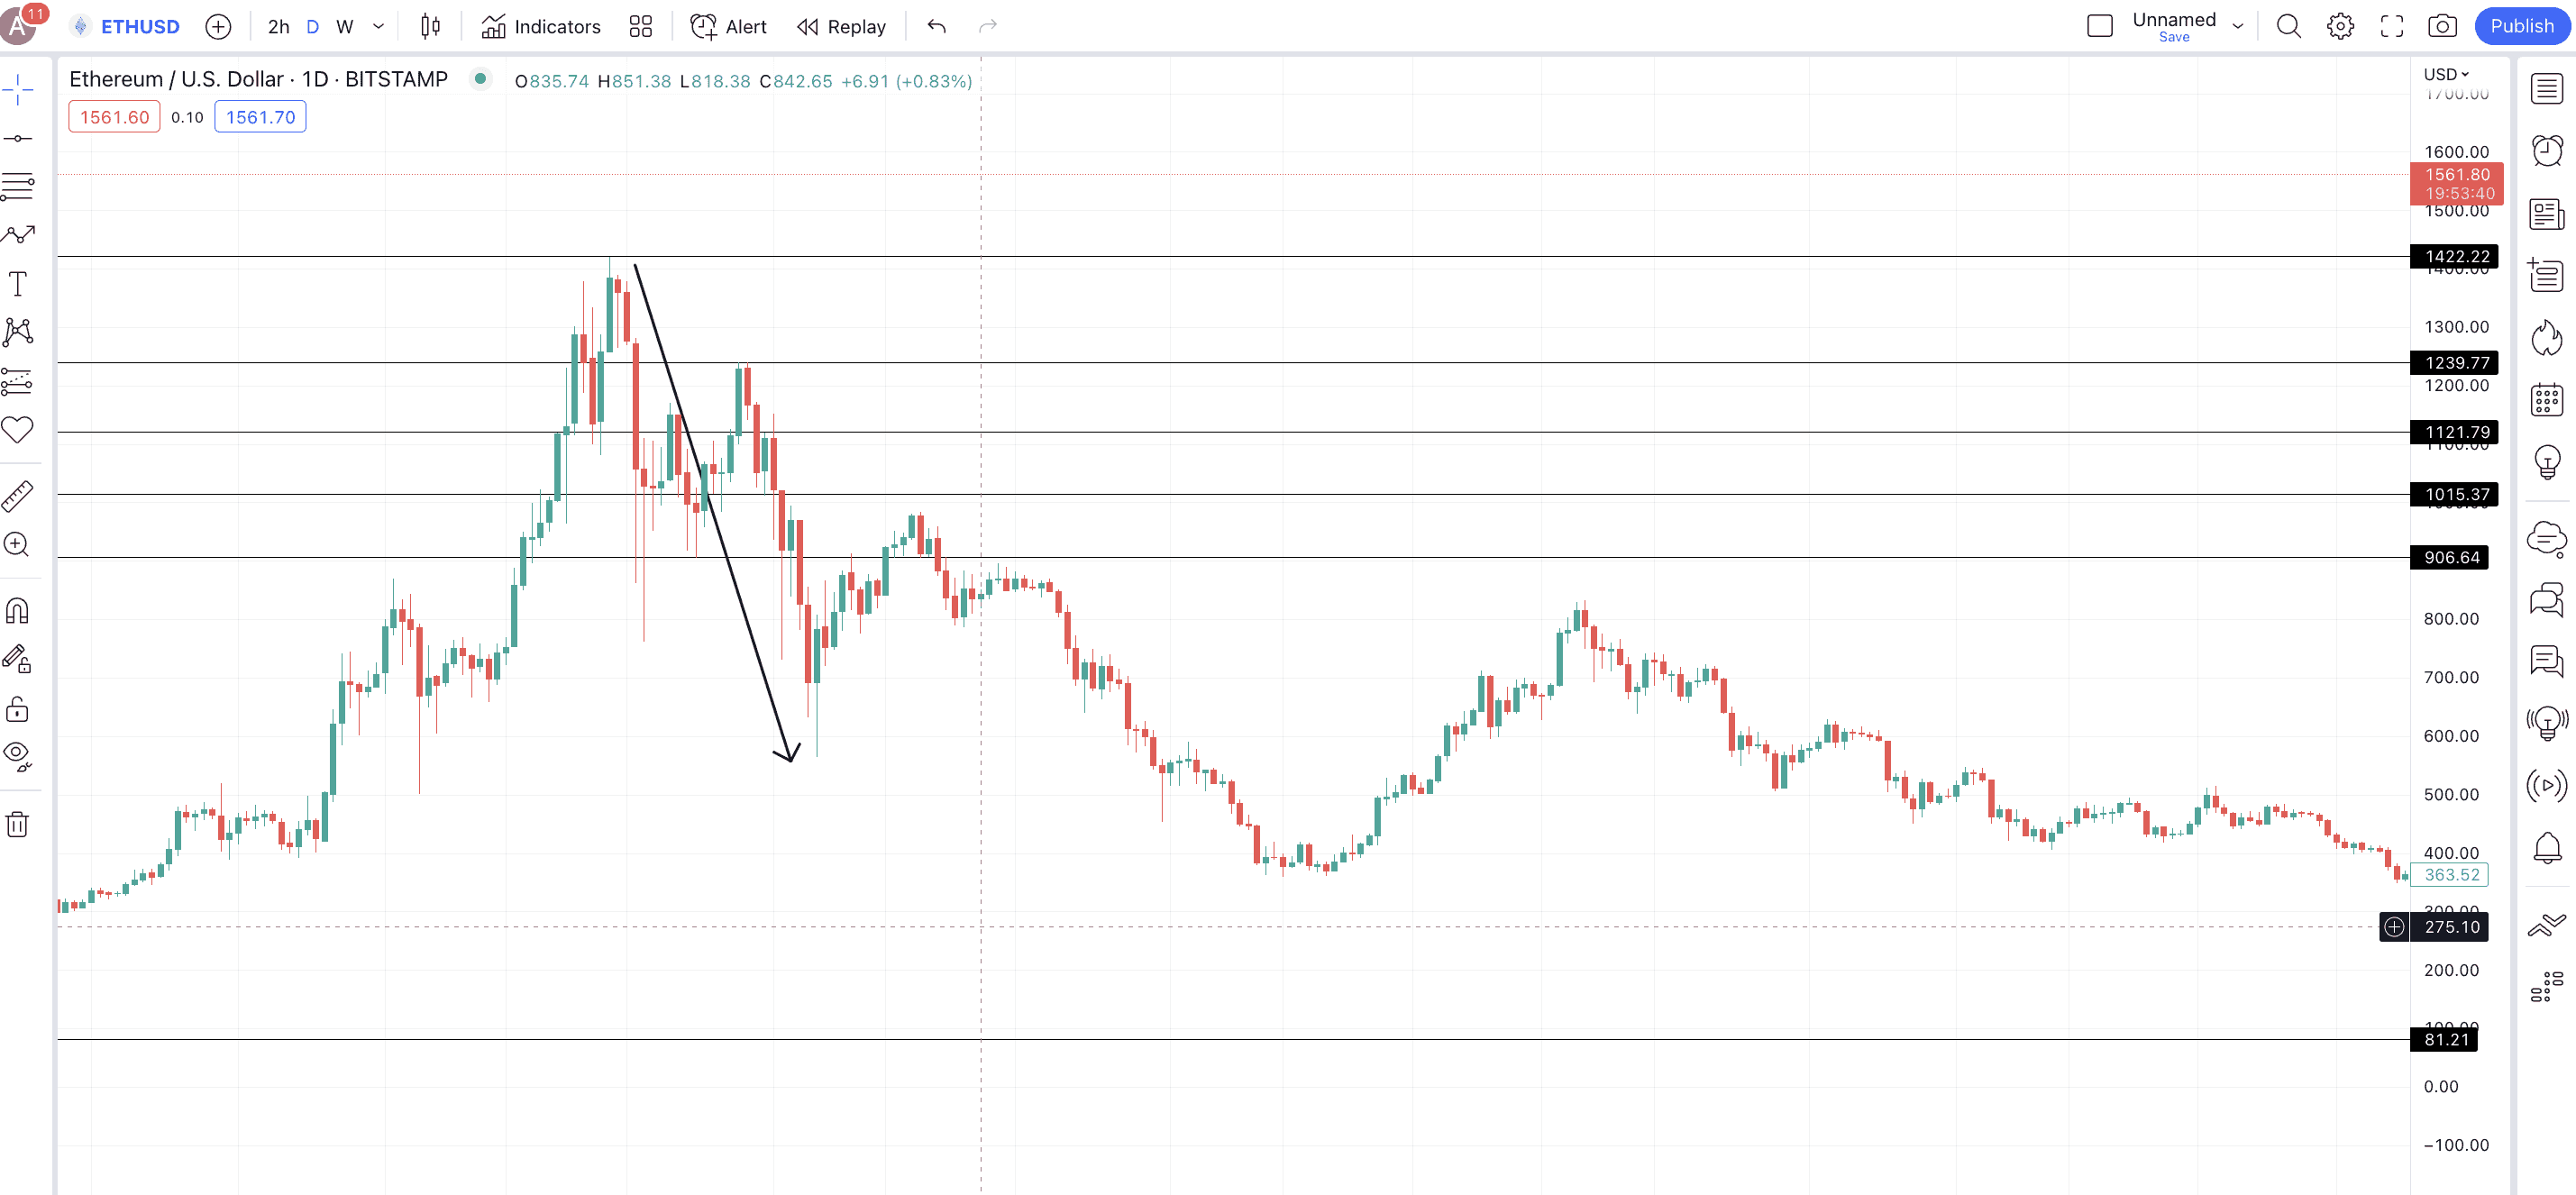
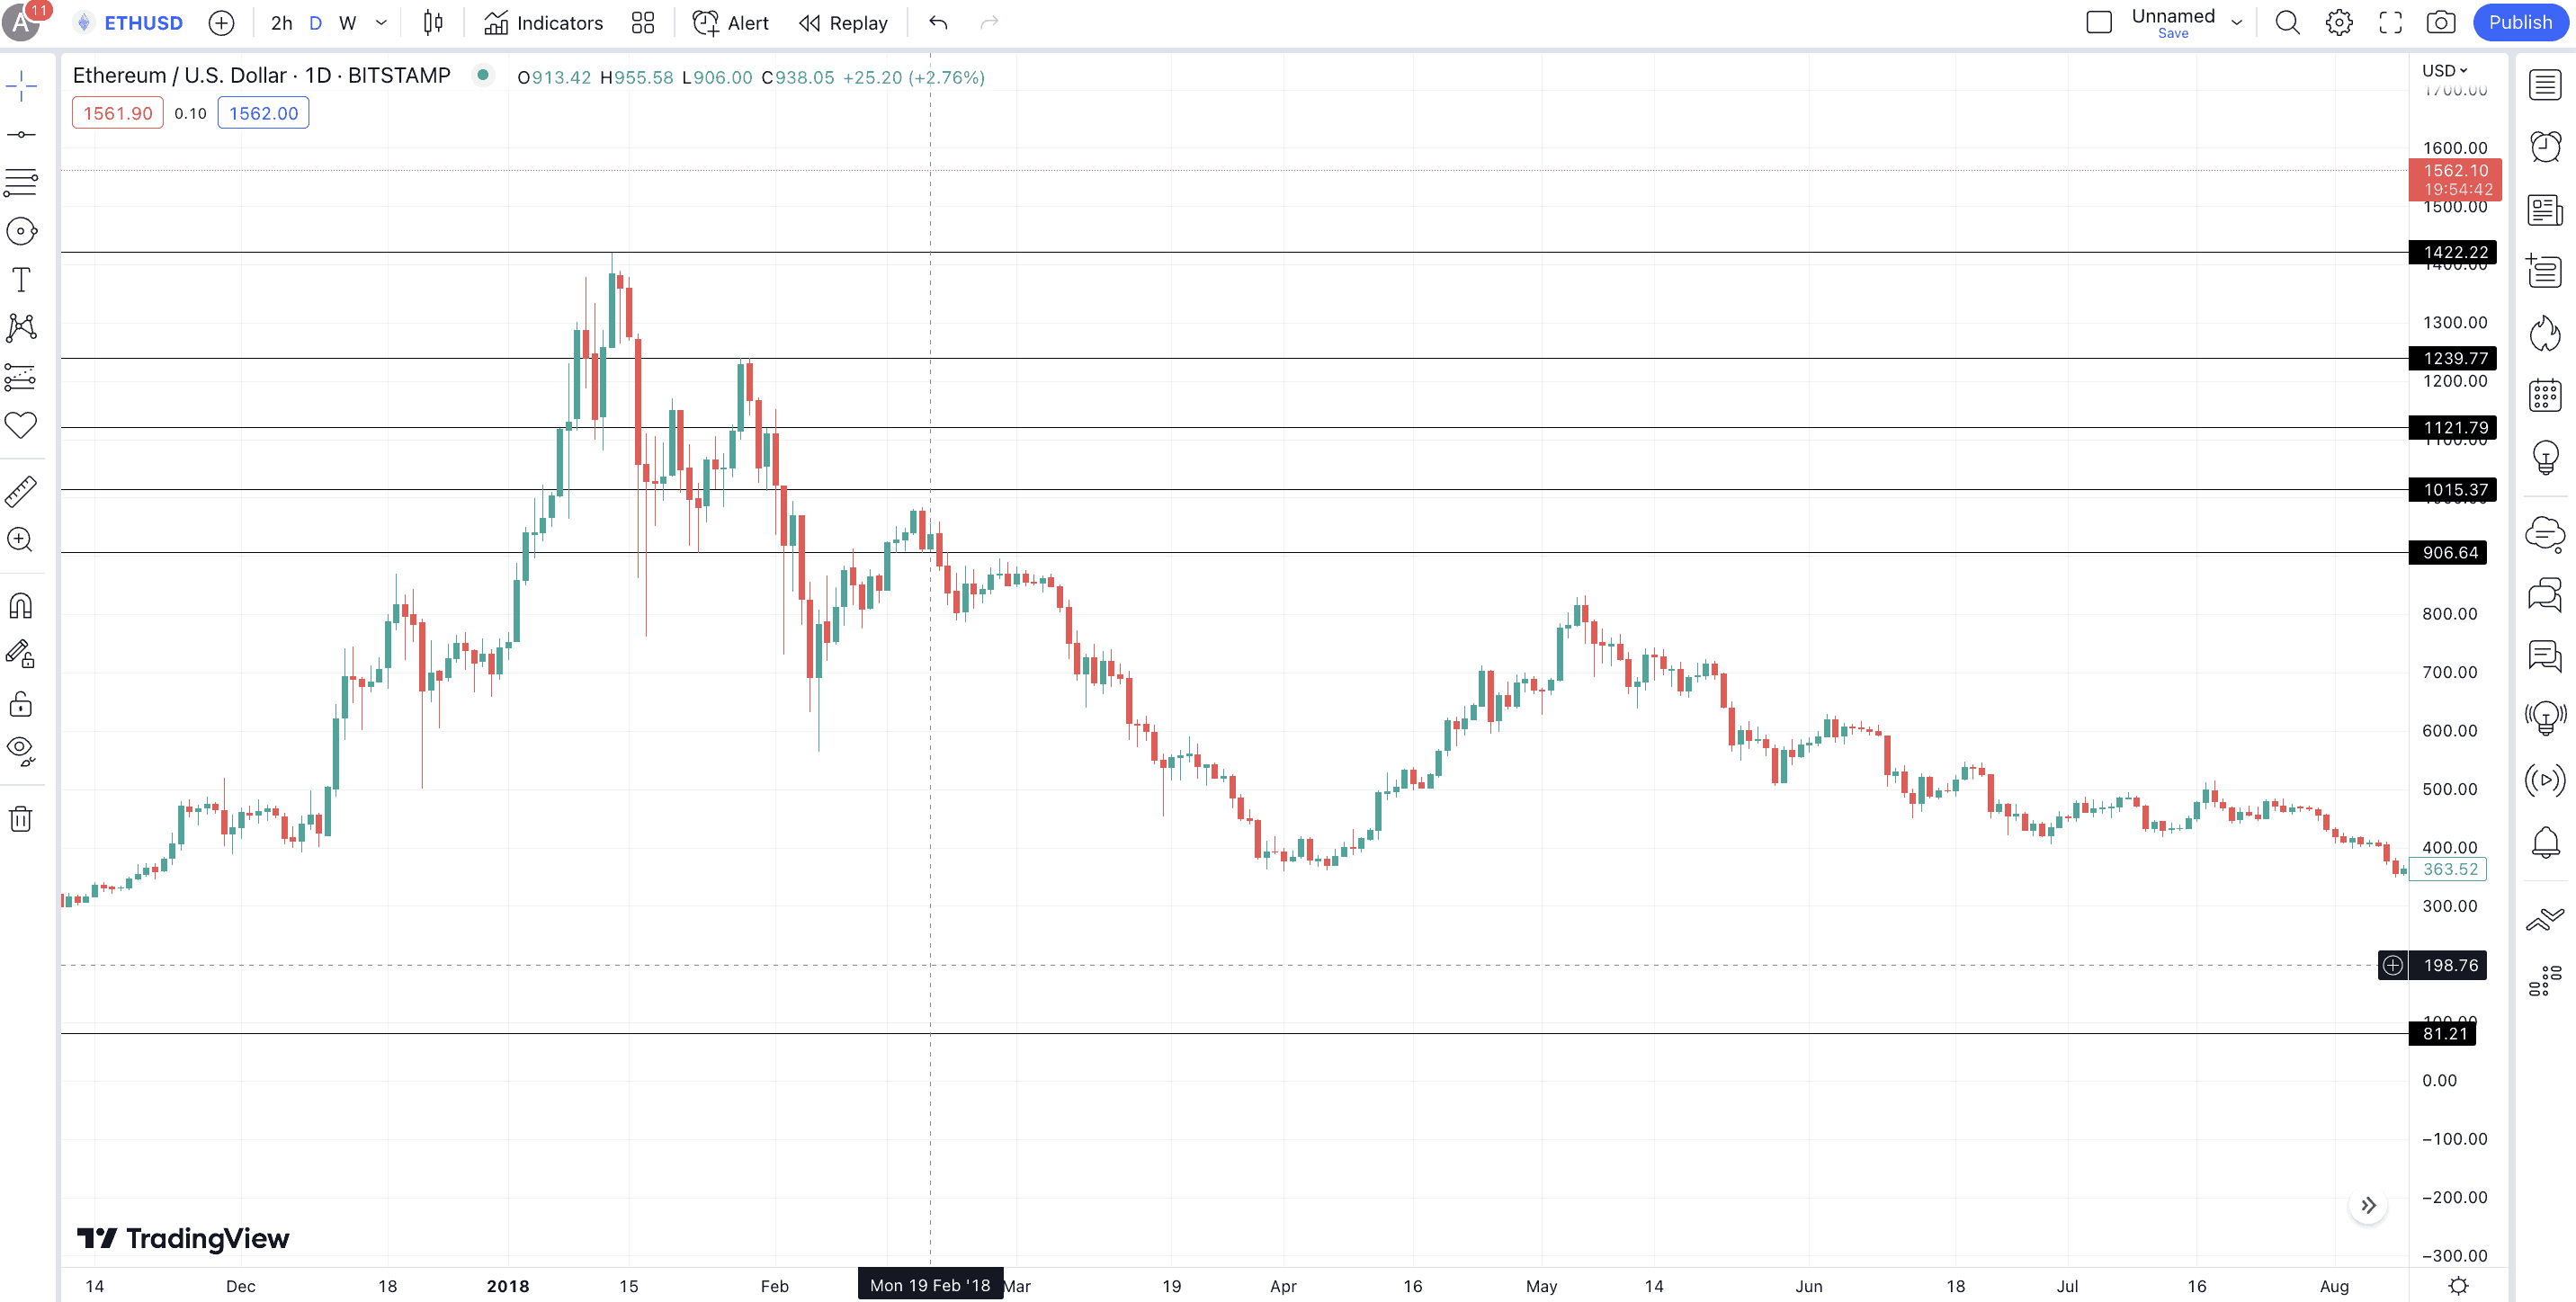
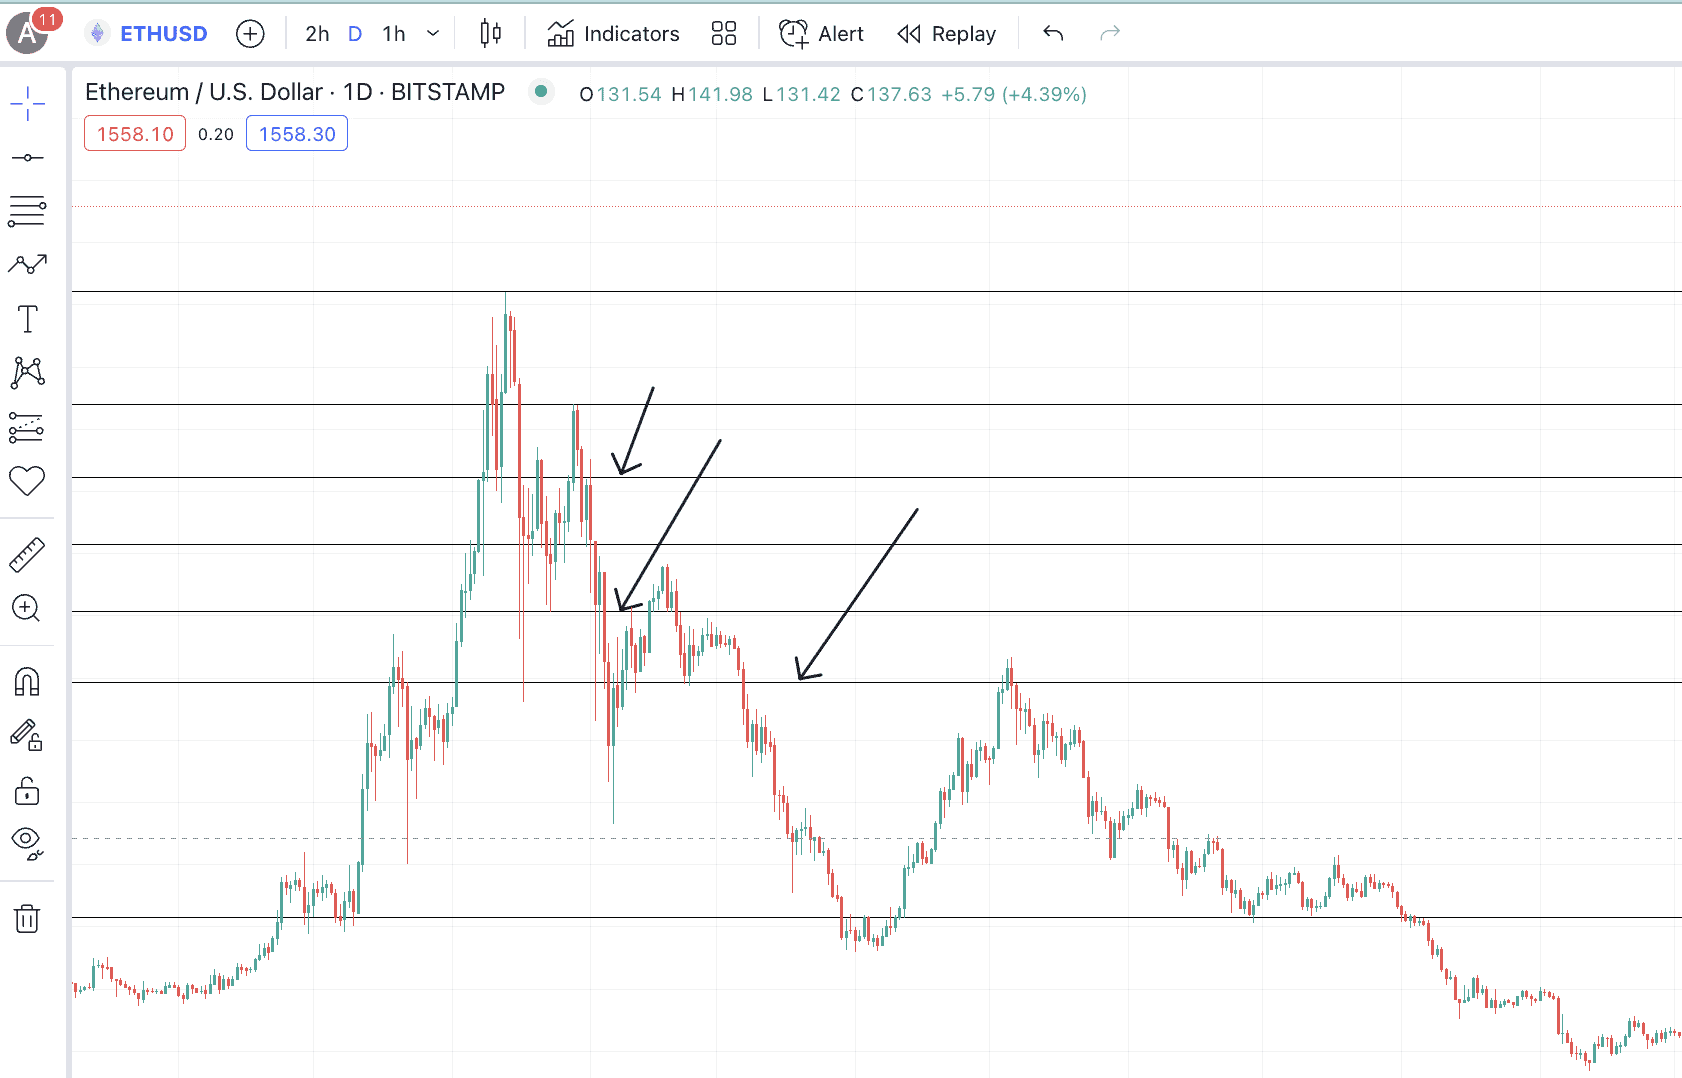
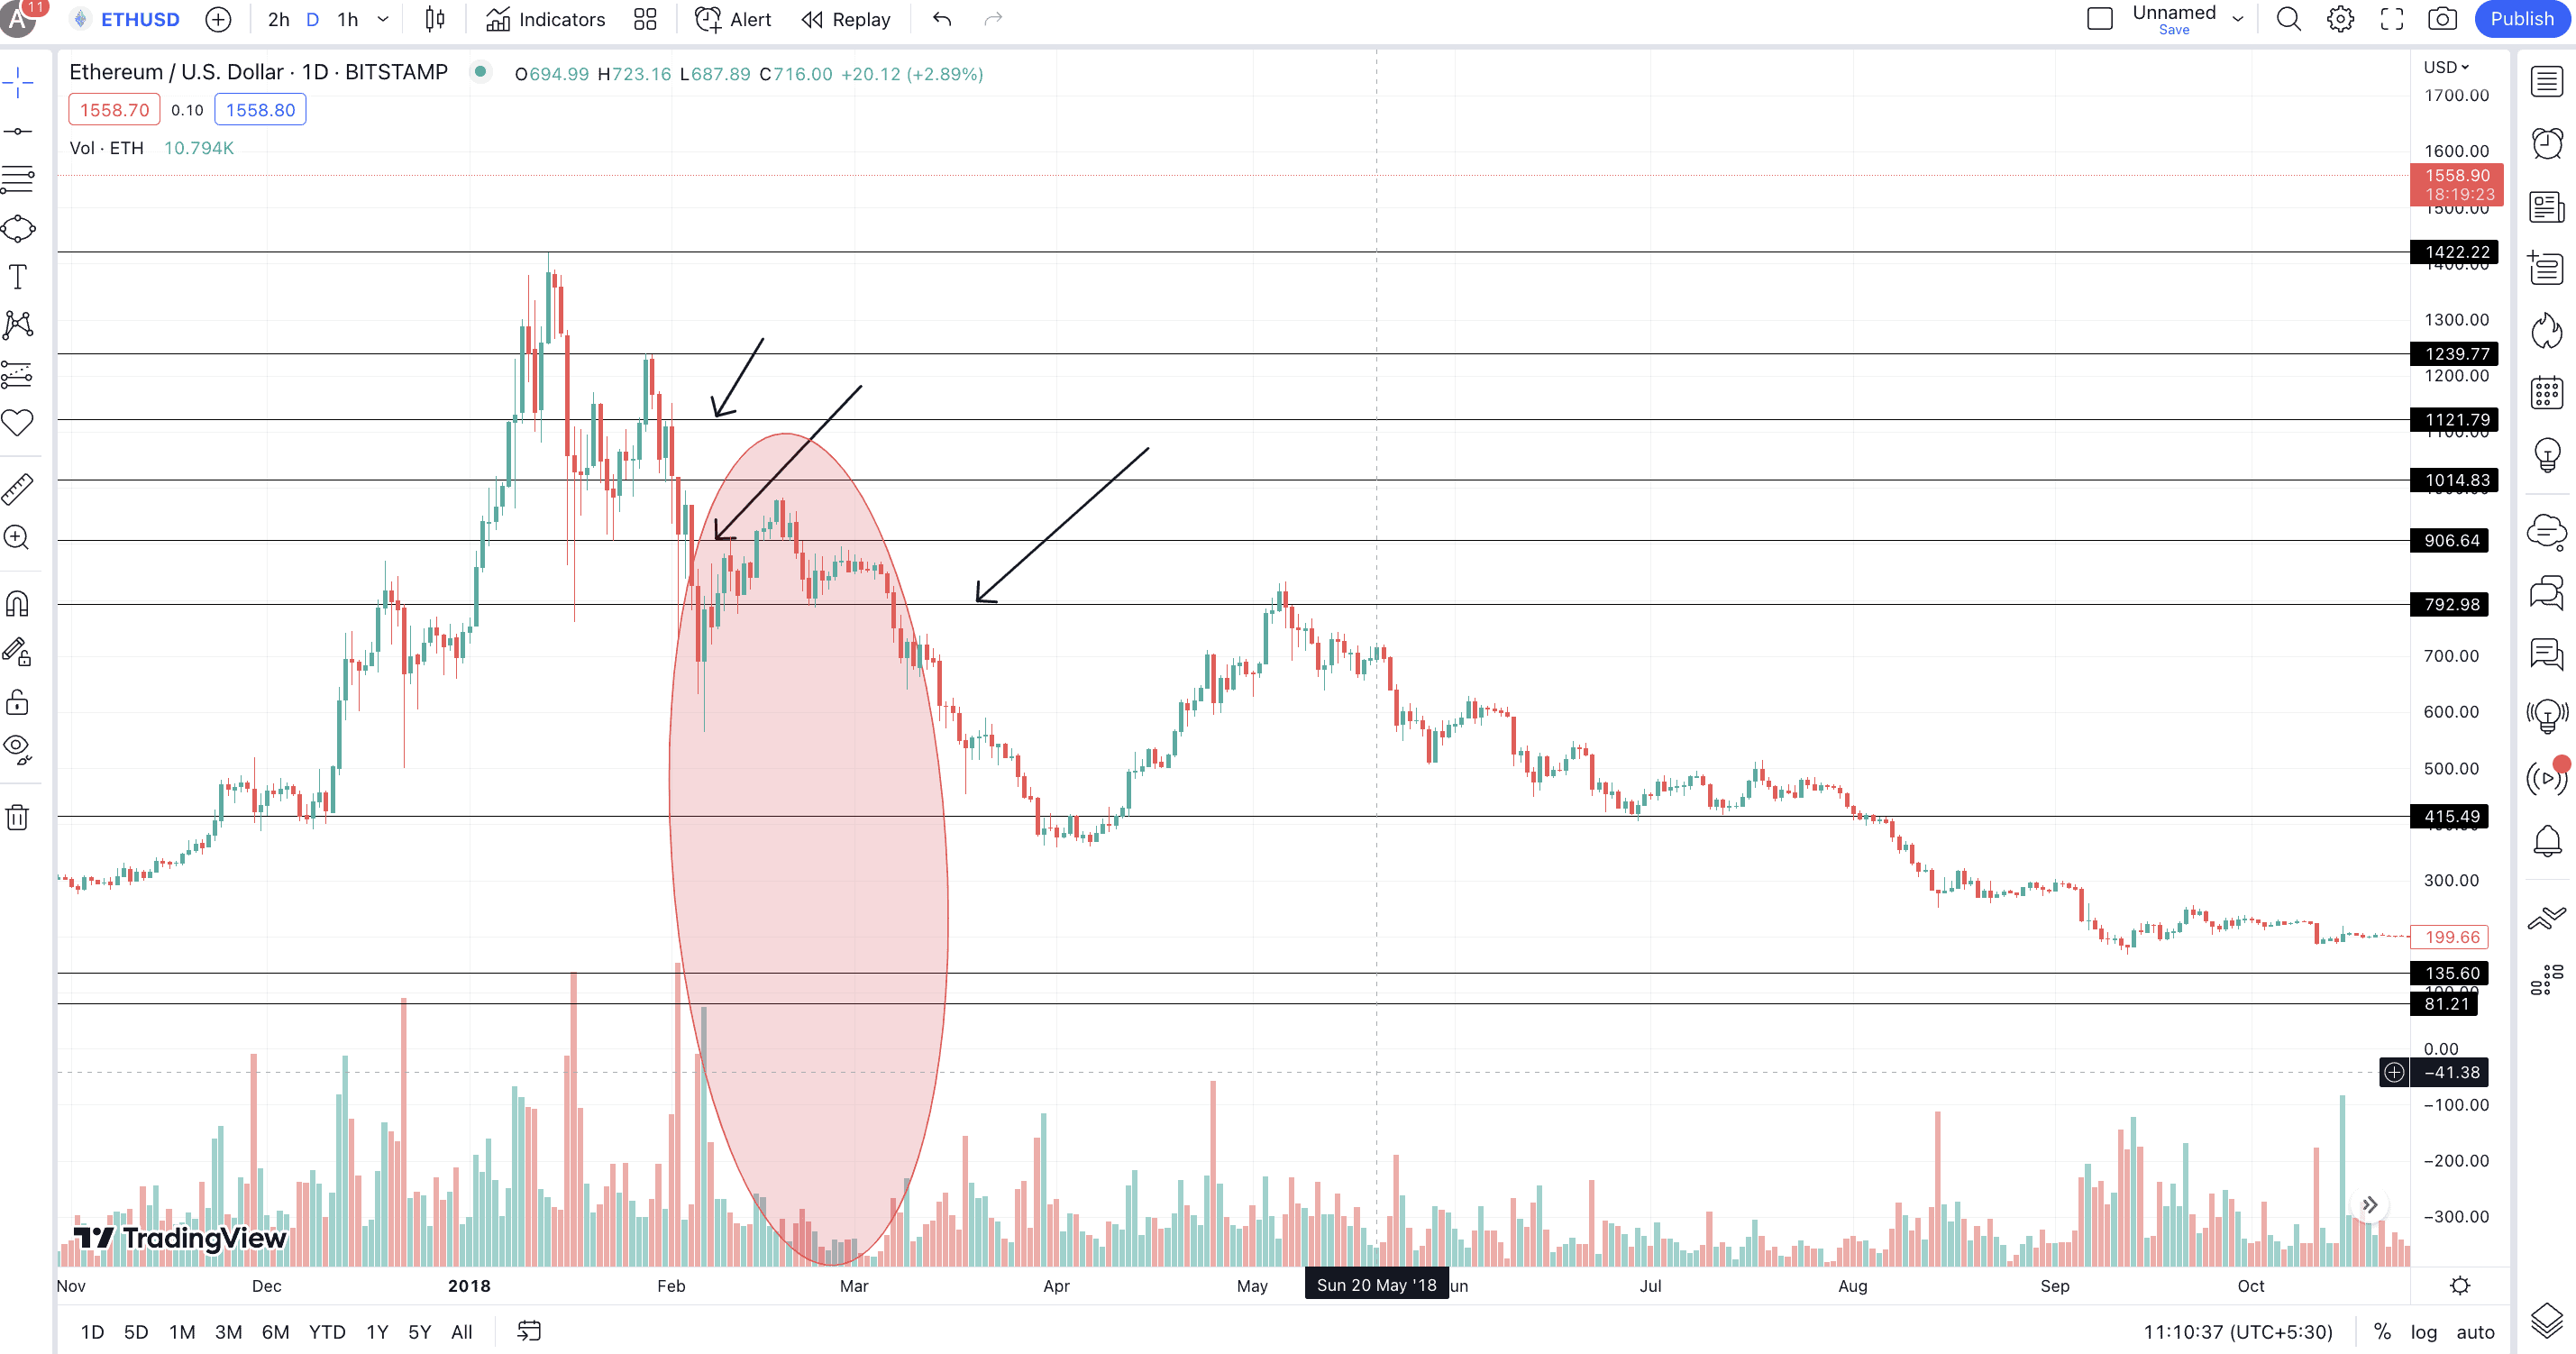
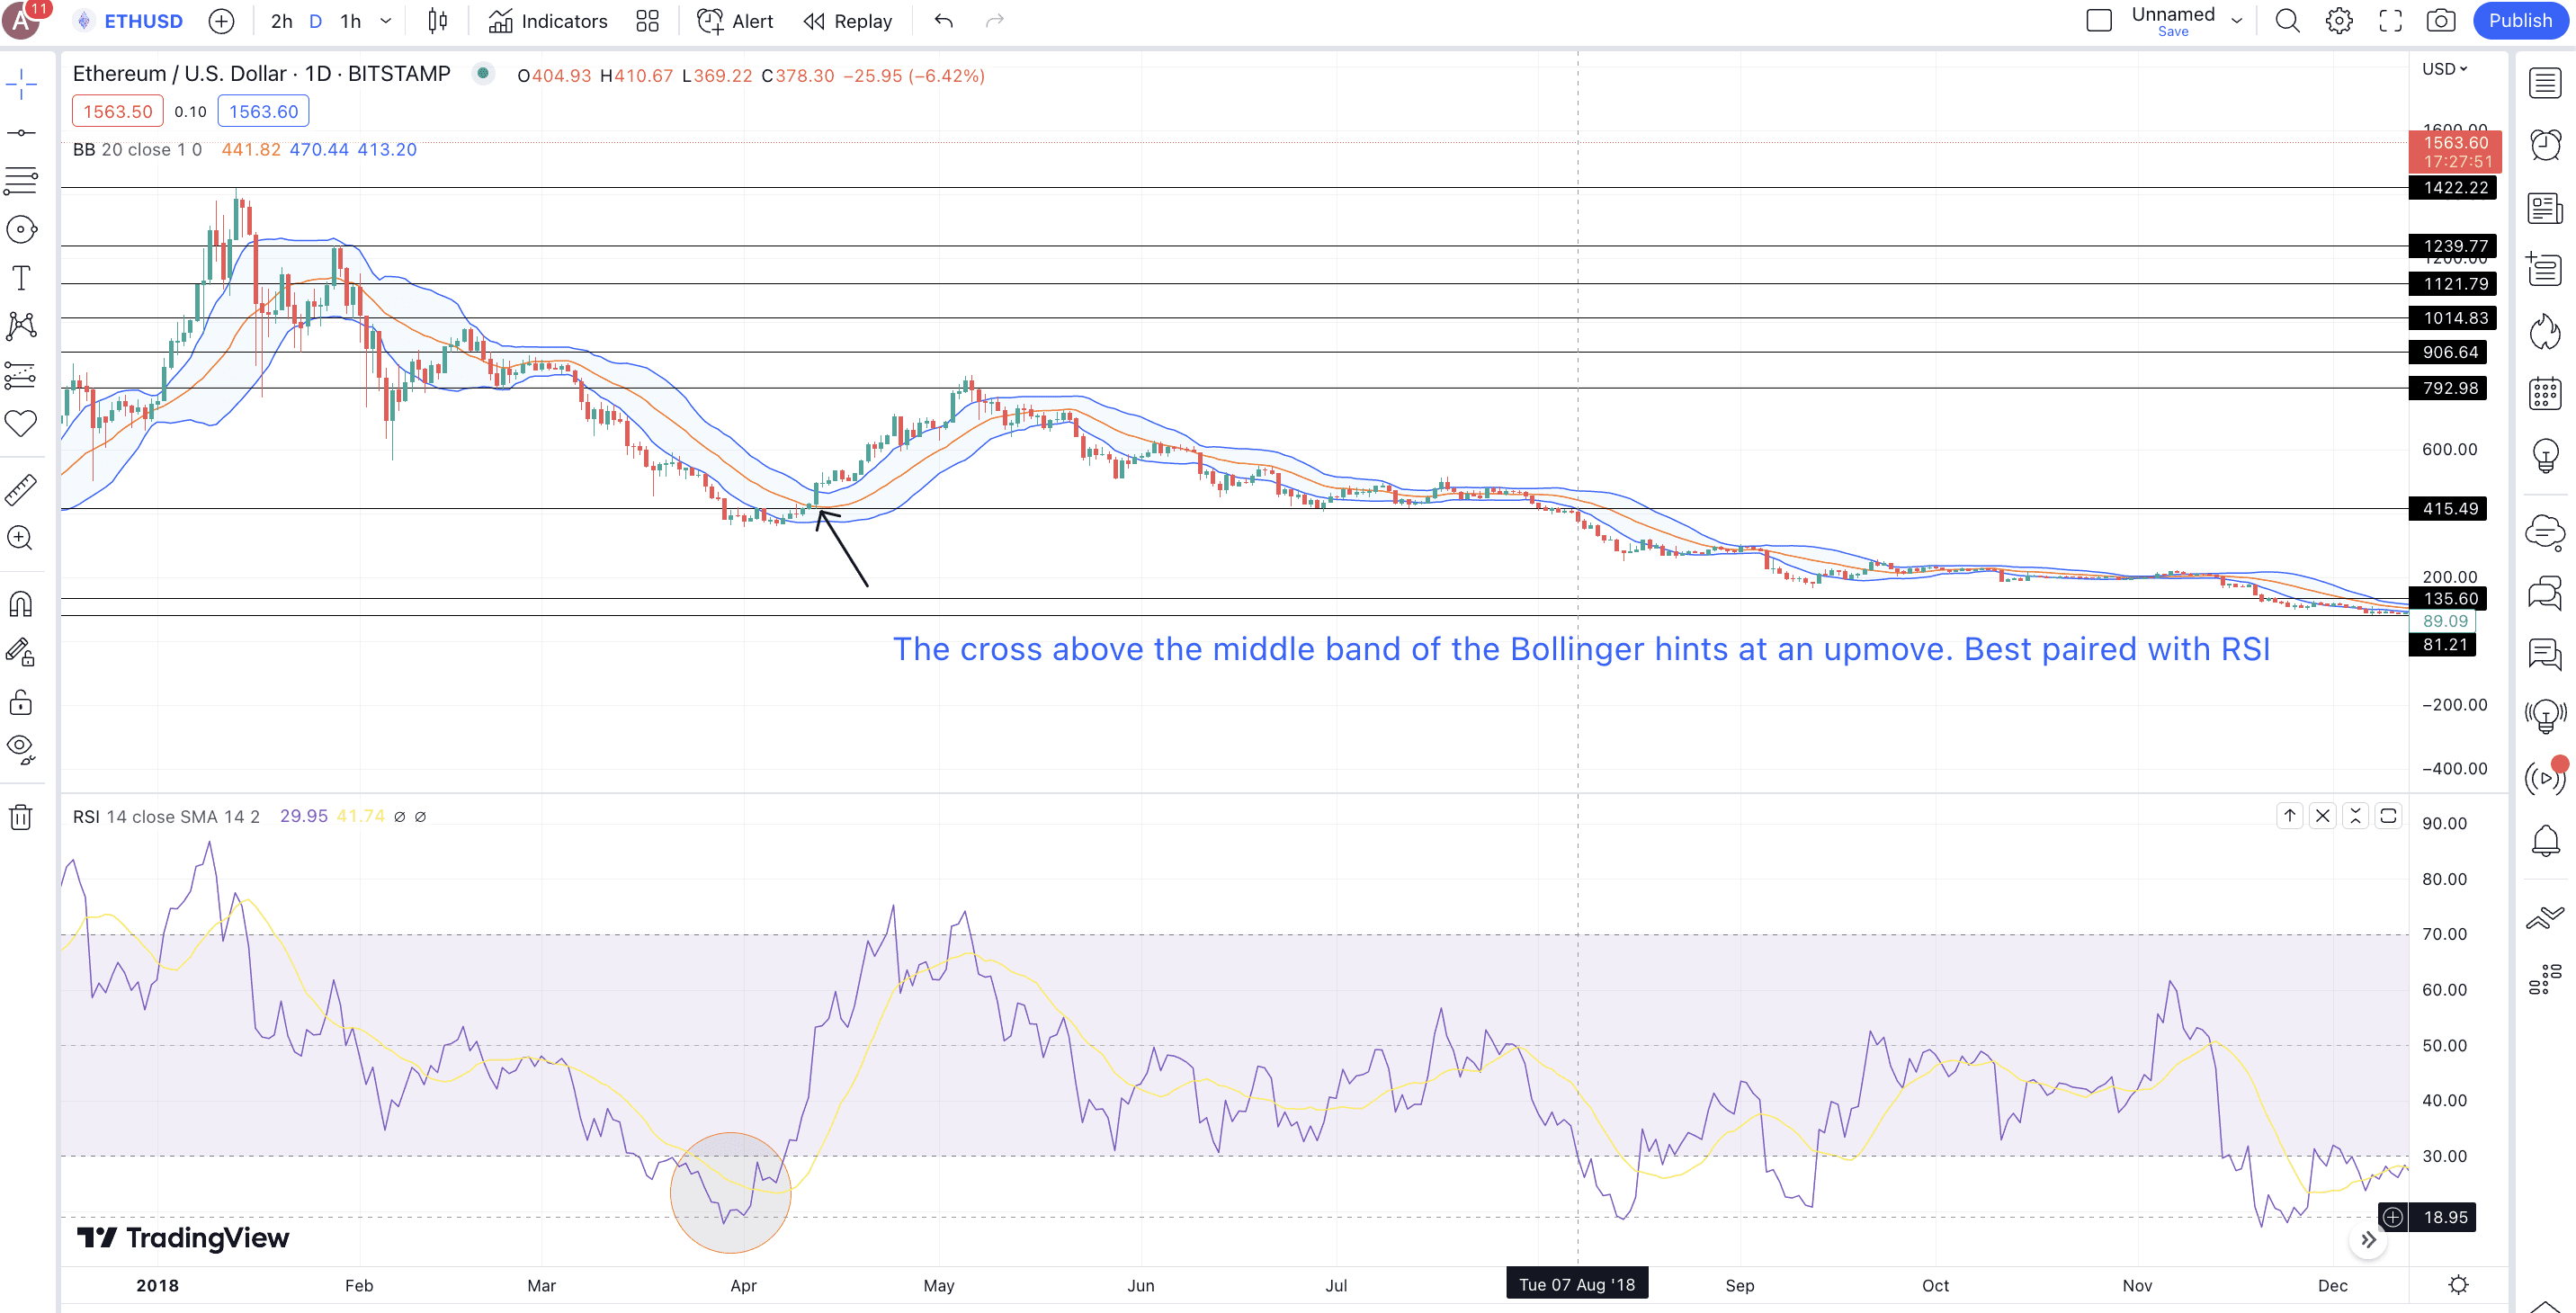
Here is BitStamp’s ETH-USD chart with a focus on 2018 prices. The price of ETH in Jan 2018 went as high as $1422, only to drop as low as $81 by December 2018. Notice how close the initial Support and Resistance levels were, with one instance of a dip leading to the other.
Market sentiments
Do you remember when in 2021, the Chinese crackdown on crypto mining operations came to light? It was deemed a major sentimental driver, with BTC prices correcting by over 50% in under 60 days. Some traders considered this move as a falling knife.
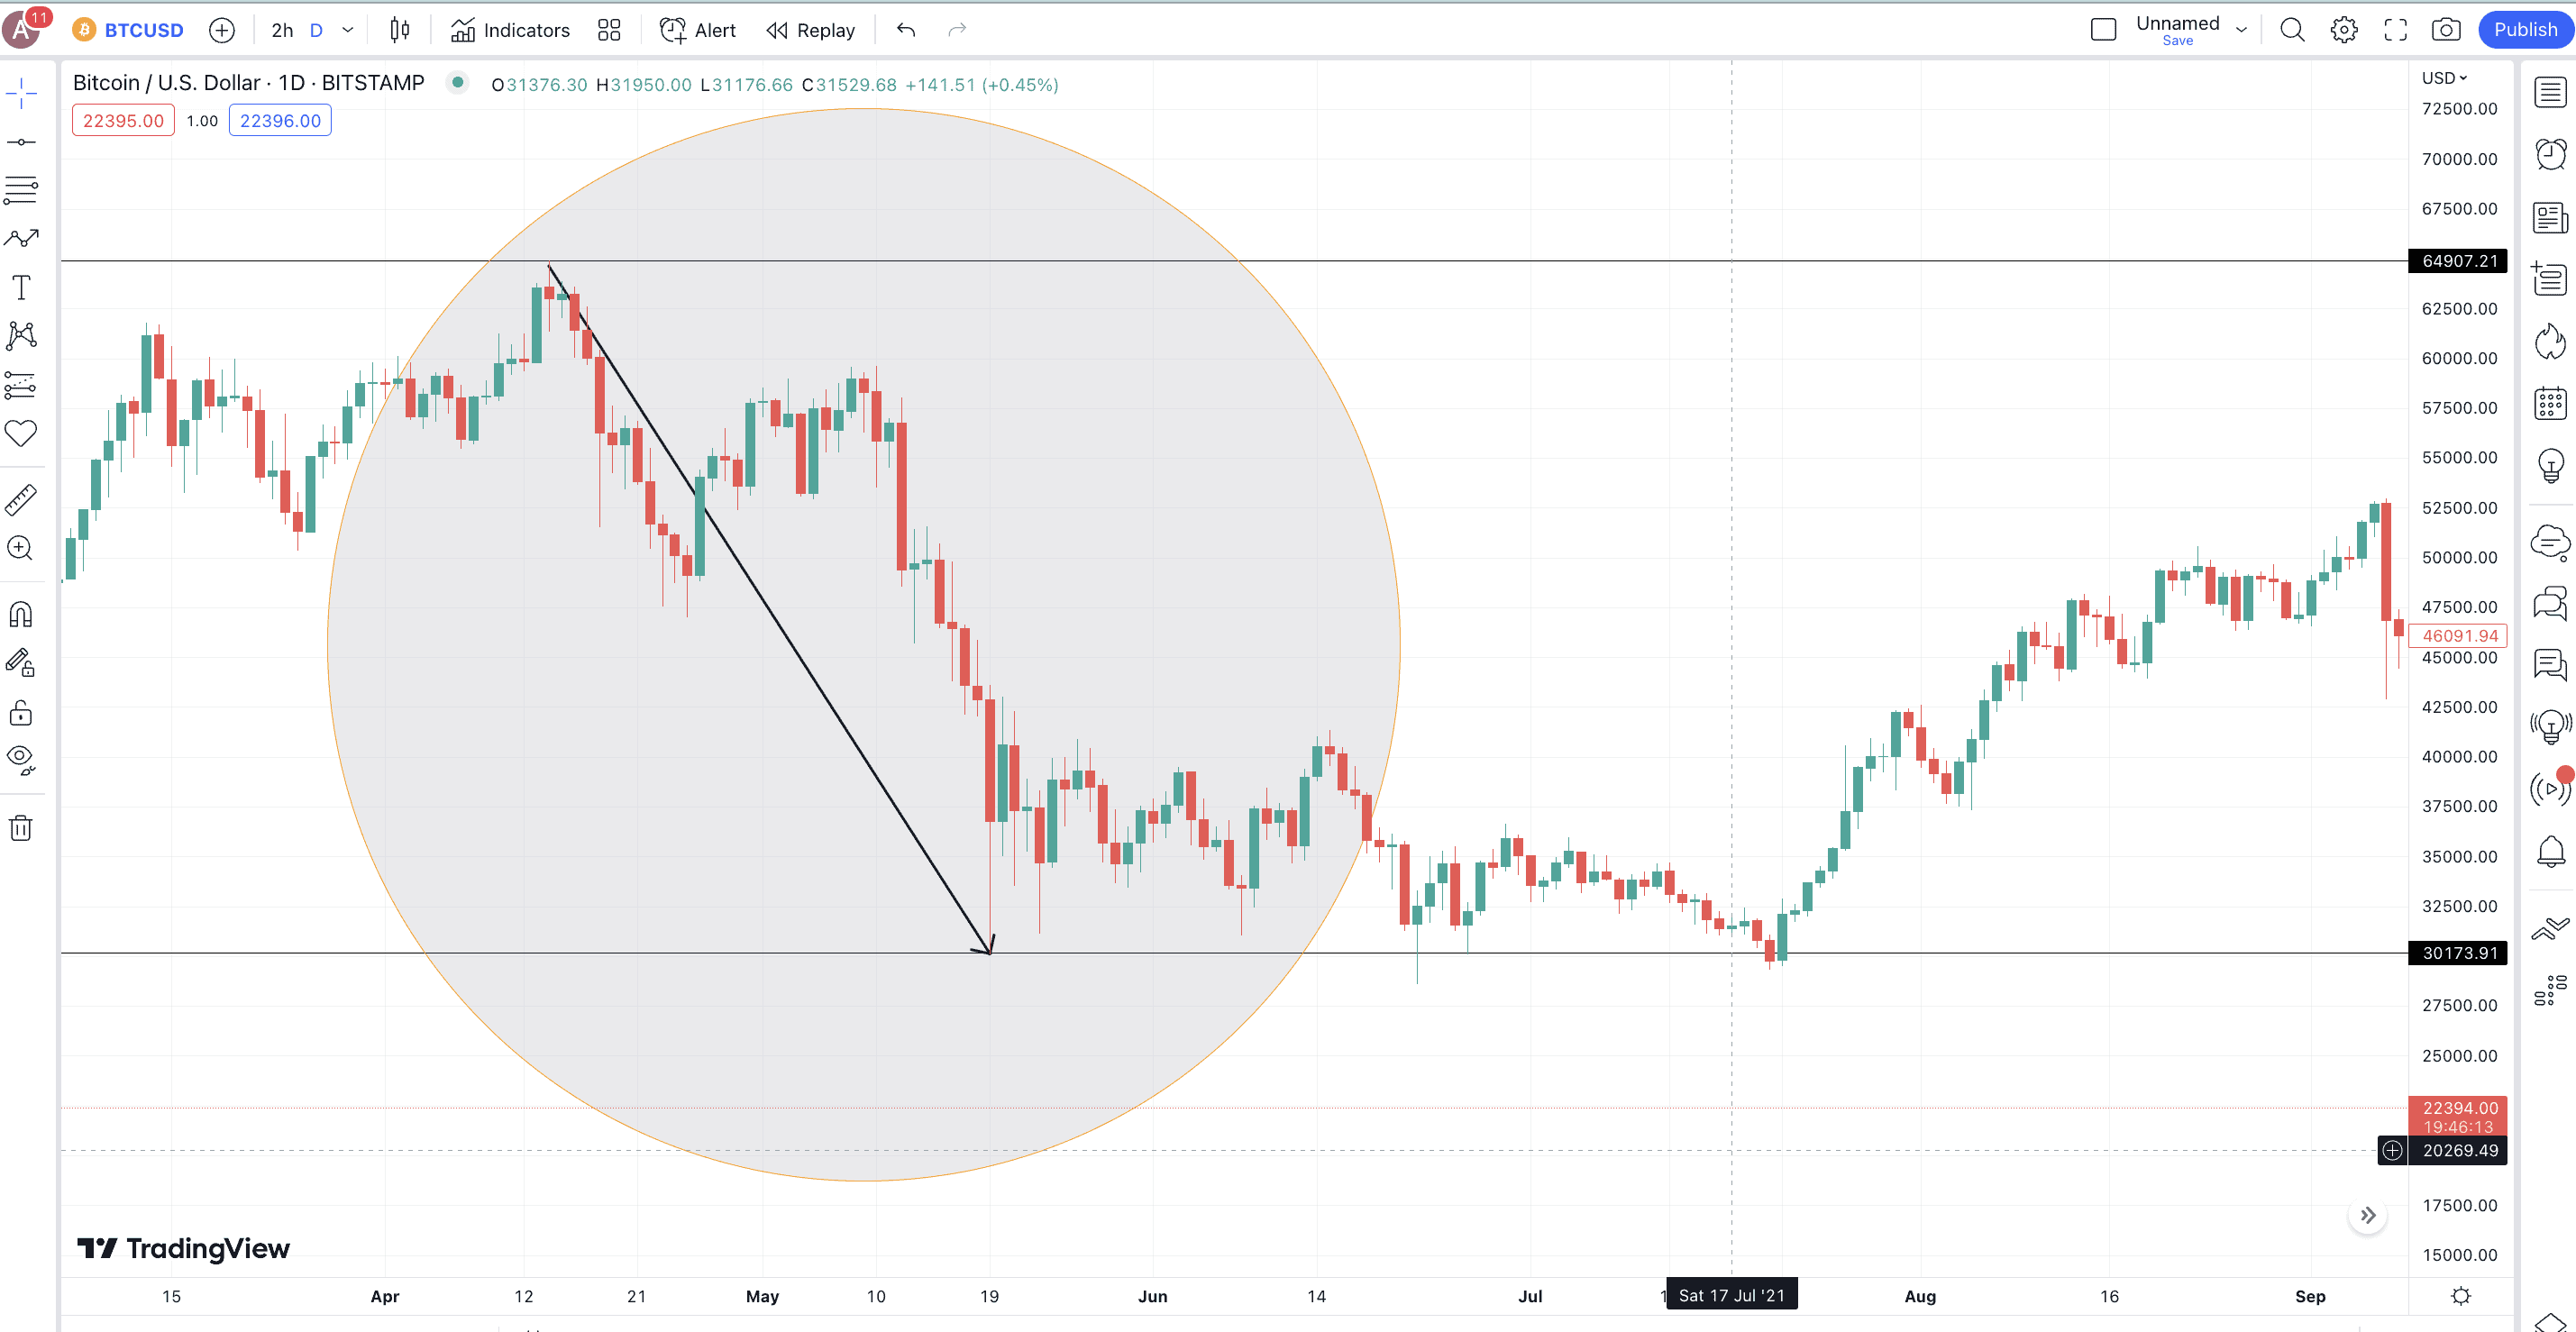
Note: Unlike the ETH chart we discussed earlier, the price drop at BTC’s counter was more short-term. This shows that a falling knife doesn’t depend much on the time frame. It can appear both long-term and short-term if the right motivation presents itself.
In crypto, sentimental factors can greatly influence prices. But it’s not just crypto. Stock prices also respond heavily to market sentiments.
Supply and demand imbalances
There can be other reasons why a crypto price drops rapidly. One such reason is when a particular coin or token supply increases beyond market expectations. Token unlocks can be a trigger event for supply-demand imbalances.
Another instance where a supply-demand imbalance appears is when people start buying an asset due to a sentimental move, leading to a surge in demand. And when leading exchanges do not list that crypto and even announce the same openly, the supply takes a hit, leading to the “wave riders” selling off their positions. This eventually lowers the demand and leads to a rapid drop in prices. More like a cascade effect!
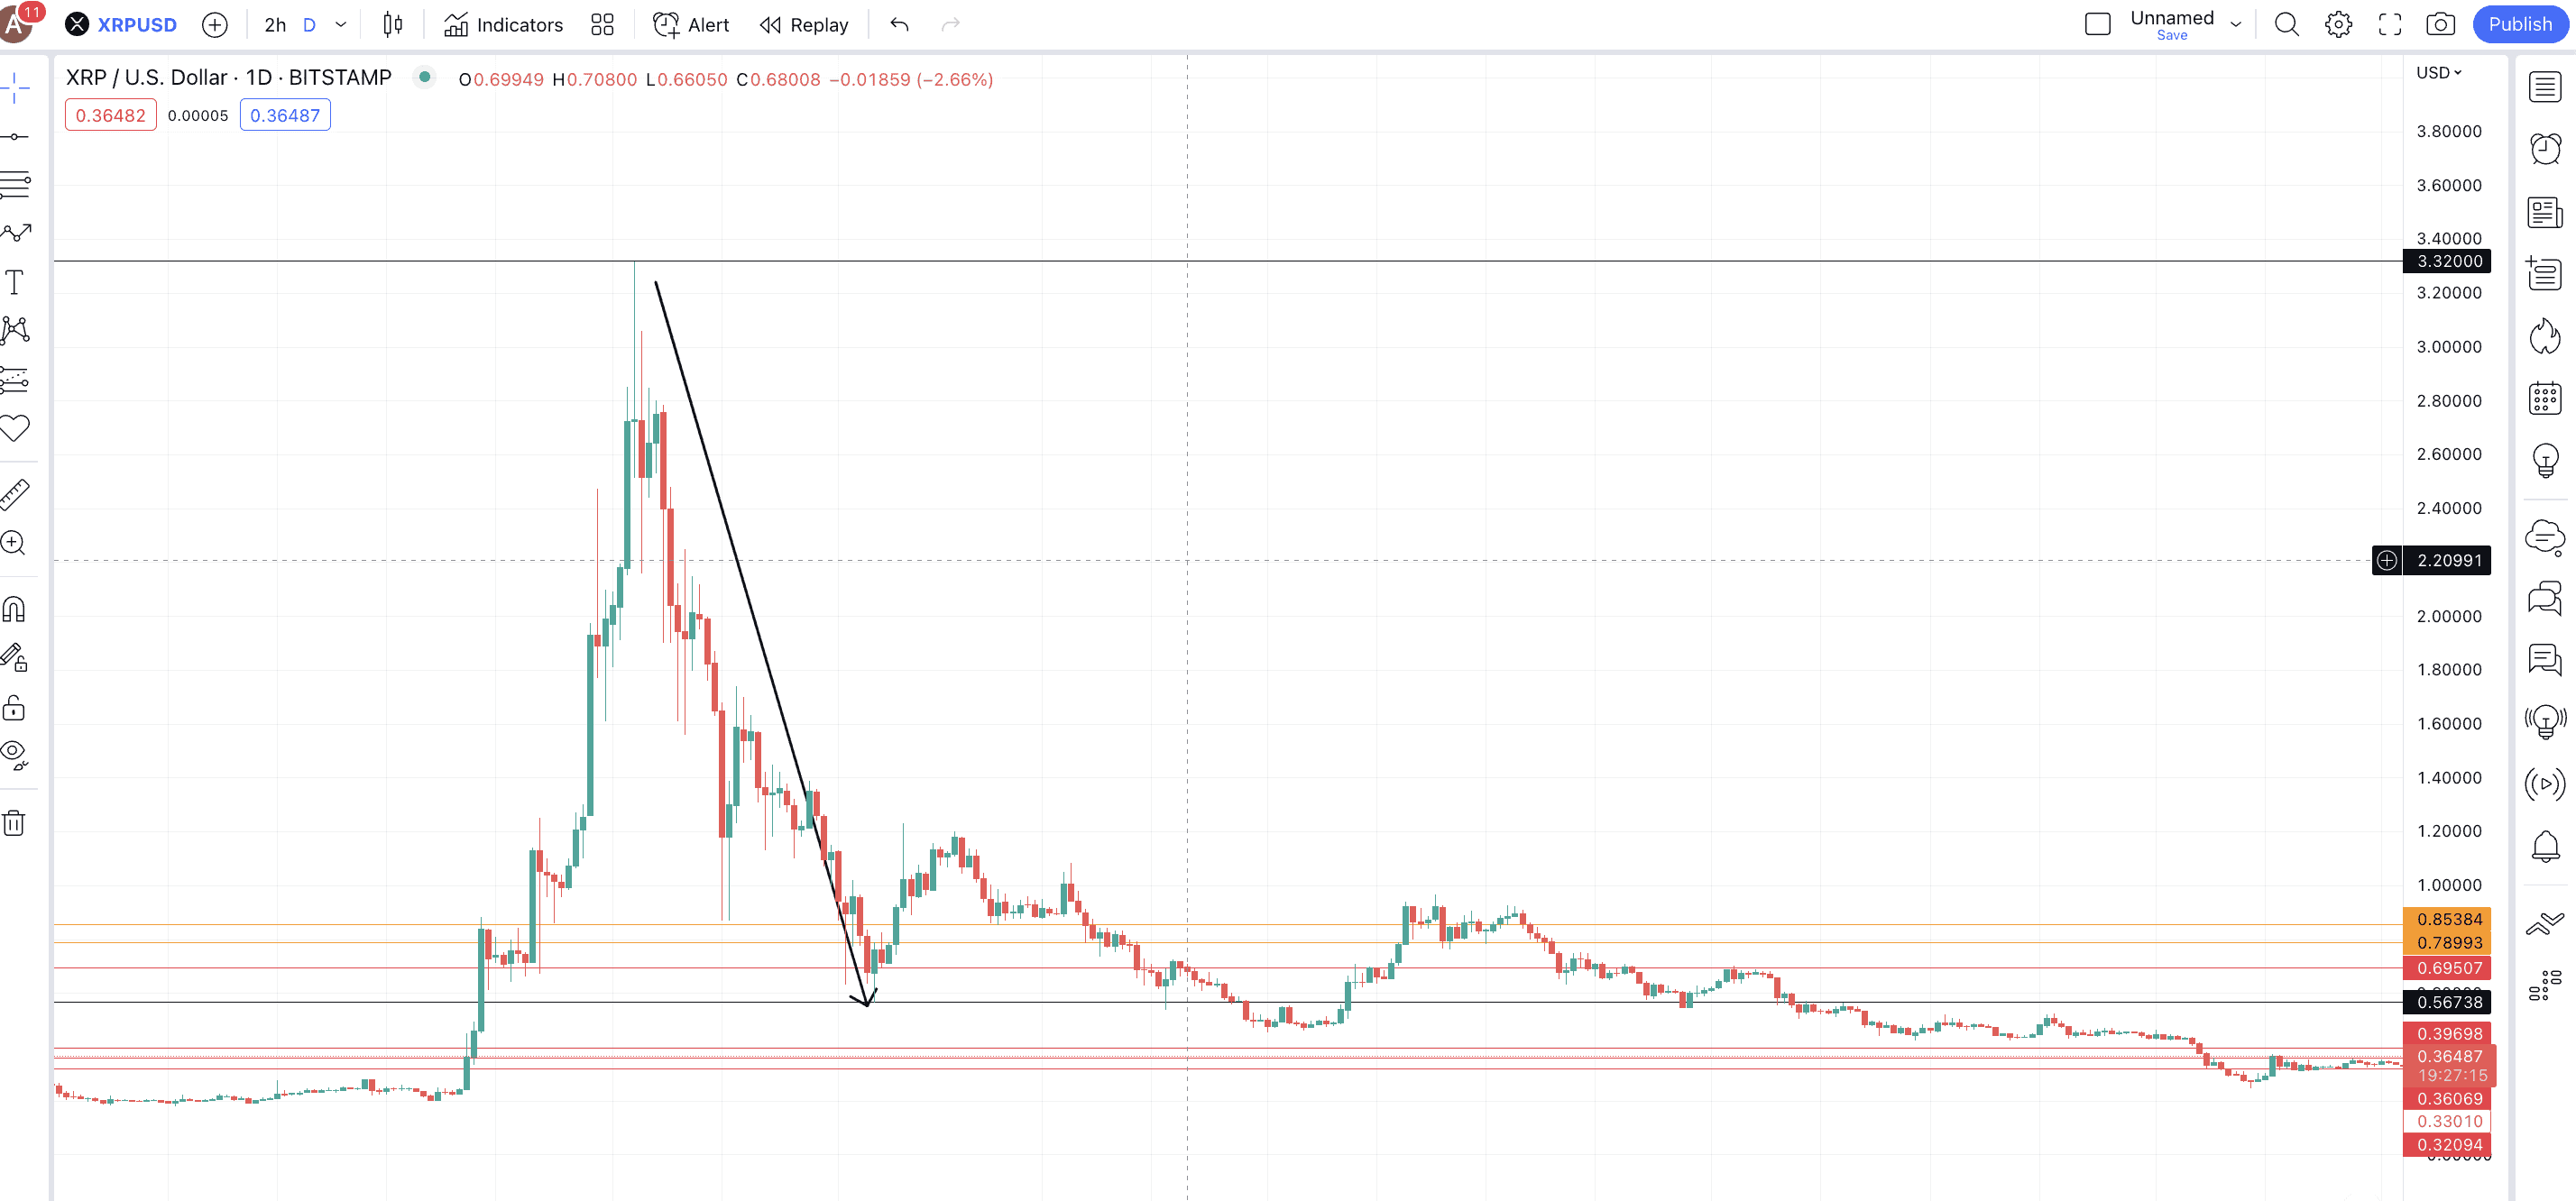
One such example would be how the price of XRP fell from a high of $3.32, in early January 2018, to almost $0.60 in less than a month. This happened when Coinbase, on Dec. 29, 2017, mentioned that it wasn’t looking to list XRP in the near future.
Forced liquidations
Leveraged trading, especially in an asset class as volatile as crypto, can bring in risks on forced liquidations. Forced liquidations are common in crypto, especially when the asset has been moving up for a while and people start taking leveraged long positions to ride the upward momentum.
Remember the ETH price crash in June 2017? The price dropped from $415 to almost $140 in less than 30 days due to a strange event. Prices moved upward till June 12, 2017, with traders placing several long orders expecting the prices to go higher. Then, the GDAX exchange saw a sell order of 100,000 ETH.
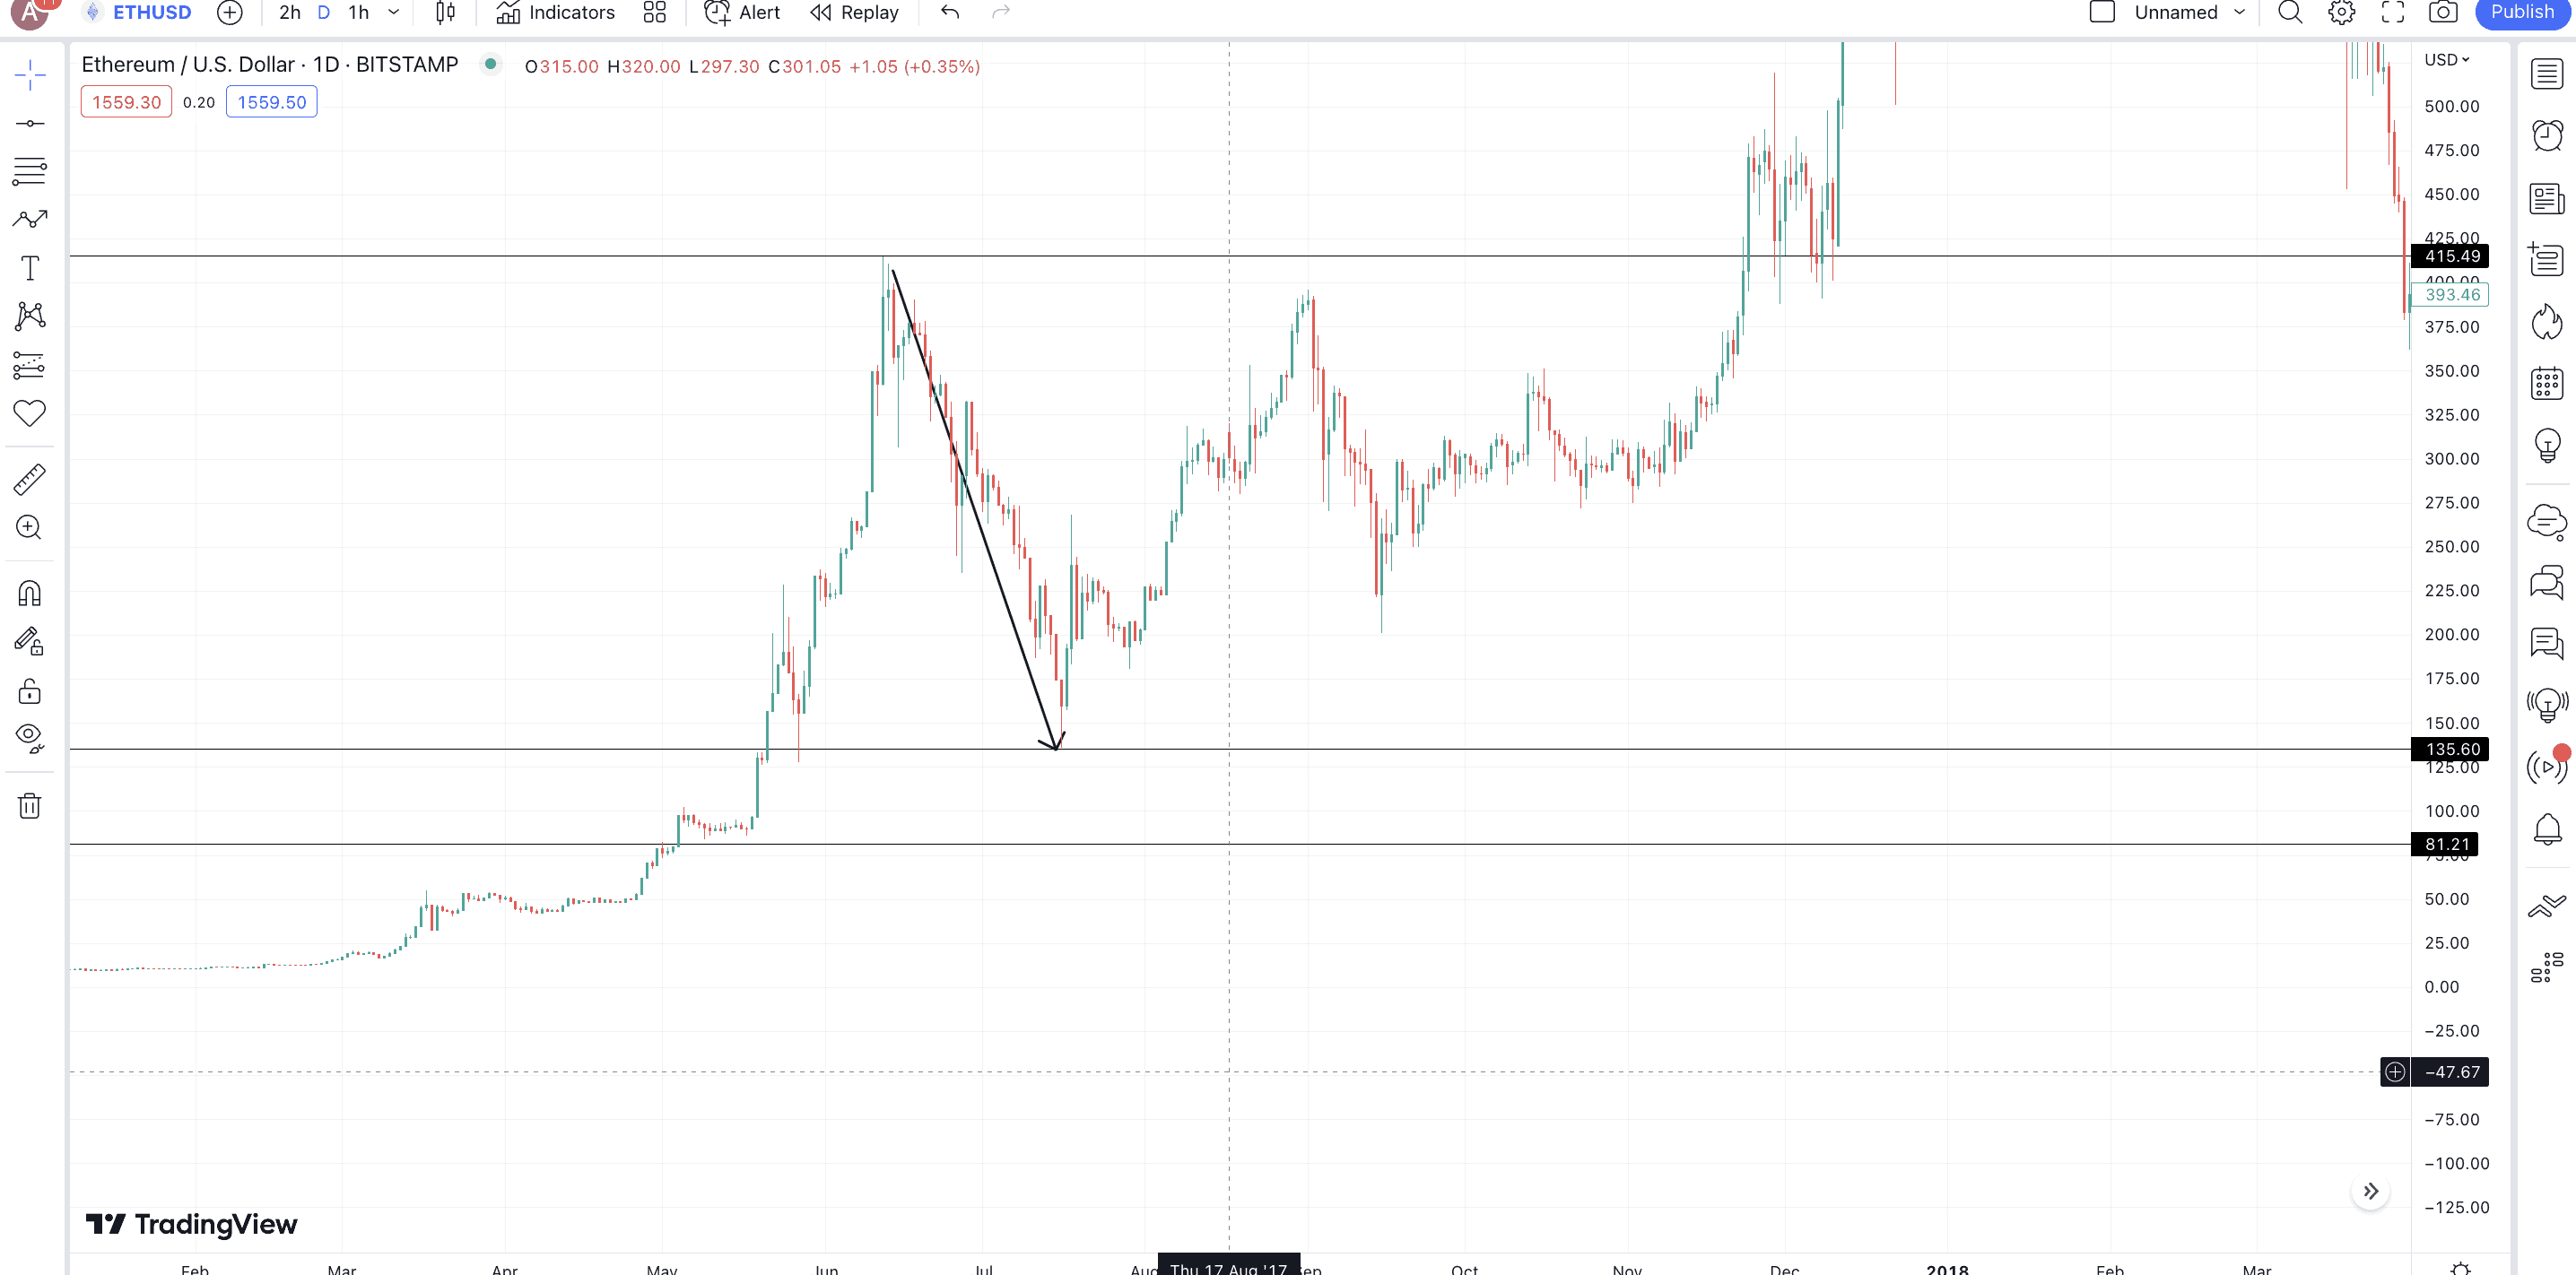
And that is what pushed the prices down, as many long positions were subsequently liquidated. Forced liquidation clubbed with panic selling (supply-demand) imbalance led to this scenario.
Market manipulation
Institutions with a hold of crypto (any specific asset) might buy or even dump an asset to manipulate the prices. Something similar happened when in December 2017, a massive sell order worth 30,000 BTC went live on Bitstamp, resulting in a price drop.
It later came to light that this selling pressure was artificial or rather created by a single entity. You need to be aware of similar market manipulations.
Financial reports
Companies behind crypto assets release quarterly financial reports. However, Ripple Labs, the company behind XRP, released some weak numbers in December 2020, when SEC filed a lawsuit against the firm. After that, Bitstamp and Coinbase announced they might delist XRP.
A weak financial report led by worsening market sentiments led to a price drop of almost 65% from Dec. 20, 2020, to Dec. 29, 2022.
Macroeconomic factors
Well, we all know how the close correlation between crypto assets and the stock market makes the former susceptible to erratic price movements due to broader macroeconomic developments. In 2022, we did see how closely the crypto market players were watching the CPI rates and the FED announcing interest rate hikes.
A falling knife was seen in March 2020 when massive sell-offs surfaced across multiple asset classes due to the Covid-19 pandemic. BTC was spared either, as the prices corrected almost 60% in less than ten days.
Falling knife: what are the fake support levels?
We know something about a falling knife: support levels can be illusions. In a falling knife scenario, the price falls led by the factors mentioned above. However, the crypto or stock prices battling the falling knives might show short-term steadiness, giving traders an impression of a rebound. This is what brings us to the concept of fake or false support levels.
Let us circle back to the ETH chart corresponding to early 2018 — when the prices dropped from $1400 to almost $400 in a few months. Notice how there were several support levels that ETH broke on its way to $400. These levels eventually became the resistance zones when ETH started to move up again from 2020 onwards.
Here is how you can identify false support levels:
Close grouping of support levels
In the case of market manipulation, some support levels are shown to hold a lot of strength. Repeated retests without breaches can fool unwitting traders. However, in that case, you must check if there are multiple support levels in close proximity or not. In that case, one support level breakout can have a cascading effect on the prices.
Low liquidity
If you see a support level being tested but with low trading volume, it might be a sign that there is an upcoming breach. This concept holds even if reversal candlestick patterns like Doji are encountered. People who rely a lot on candlestick patterns might consider a reversal pattern to be true. However, even a reversal pattern might not hold with low volume or liquidity.
Also, look for longish wicks or shadows at support levels. They are signs of market indecision and might add to the rapid price drops.
Dissecting a falling knife pattern: the Terra-LUNA crisis
Now that we know a fair bit about falling knives, here is one involving the infamous Terra-LUNA debacle.
Before we delve deeper into this meteoric crash, let us understand the timeline:
May 7, 2022: UST, the ambitious algorithmic stablecoin of the Terra ecosystem, started to lose its peg. The first sign of something ominous showed up when UST hits $0.985.
May 8, 2022: Do Kwon — the man behind Terra — jokes about the depegging risk. Luna Foundation Guard, or LFG, announces plans to defend the peg and even buy BTC to back LUNA.
May 9, 2022: UST fell to 35 cents against the dollar. LUNA, the crypto meant to keep the peg intact via algorithmic rebalancing, starts dropping. Do Known seen tweeting: “Deploying more capital – steady lads.”
May 11, 2022: Over 58% of the future bets at this time focused on LUNA moving higher. This eventually led to over $100 million in liquidations.
May 12, 2022: LUNA drops under 10 cents.
May 16, 2022: New forked chain announced. LUNA nearly hits bottom, losing 99% of the pre-crisis value.
How did the price chart look?
The price chart shows how the “Falling Knife” scenario panned out for LUNA.
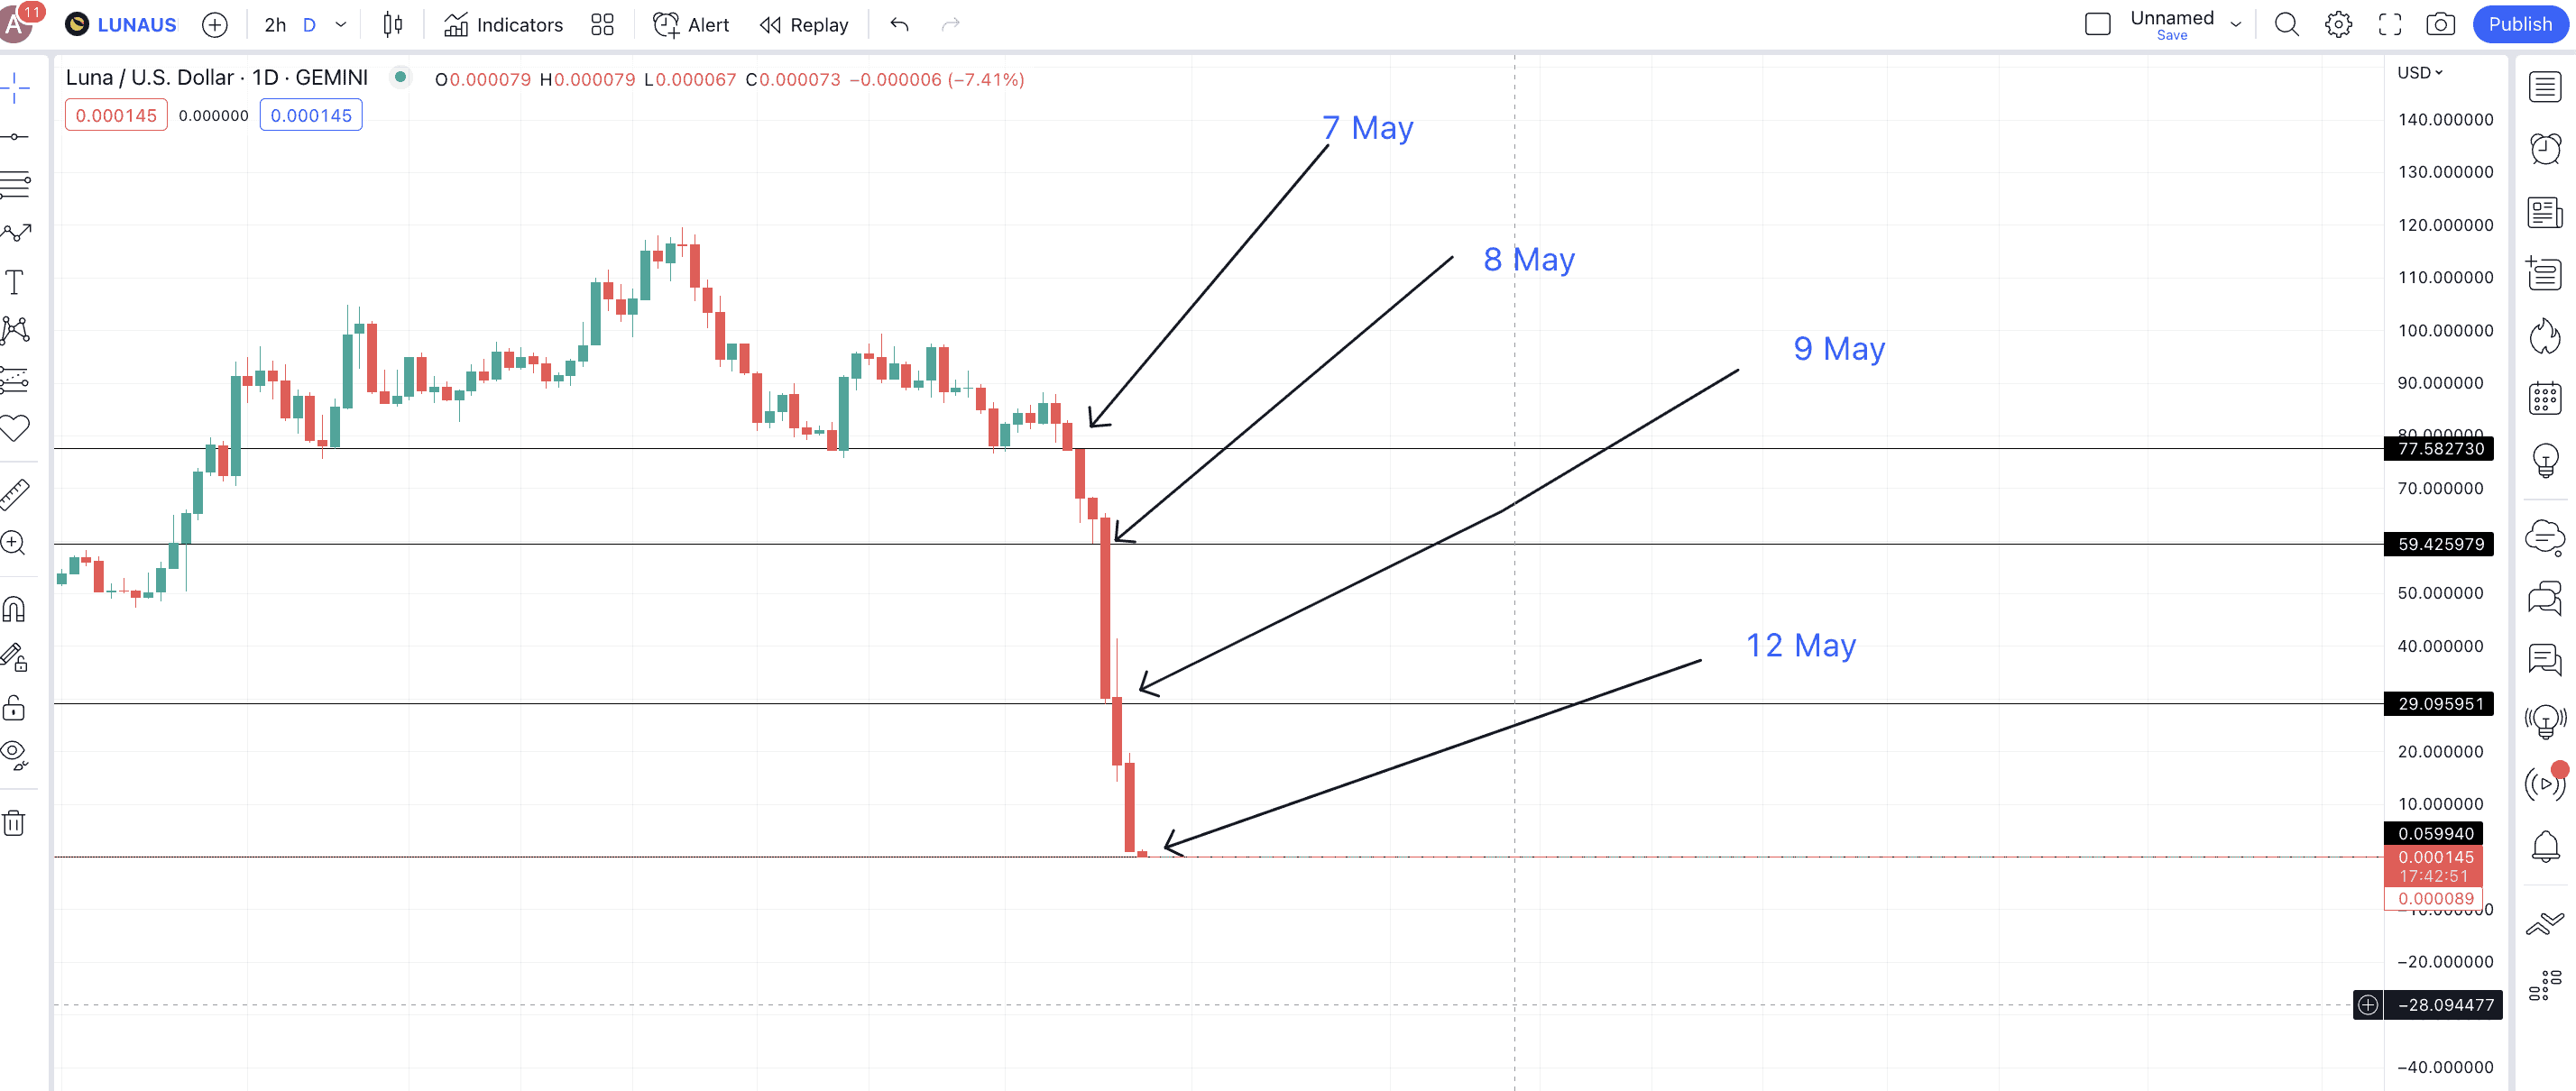
May 7, 2022: Prices opened at $$77.5.
May 8, 2022: A low of $59.42 was found.
May 9, 2022: A low of $29.09 was found.
May 12, 2022: A low of $0.59 was found.
Prices dropped to $0.00001675 by May 13, 2022. That was the bottom of this falling knife.
Traders who tried catching the knife anytime between May 7, 2022, and May 12, 2022, would have been left deserted.
However, this falling knife example was easier to track as there were hardly any rebounds and support areas that LUNA respected. Currently (as of early March 2023), LUNA (LUNC) is trading at $0.0001438, up 776% from its all-time low of $0.00001675. Traders who bought close to the bottom made some profits.
Yet, in this case, there wasn’t a way to know where the knife would stop. In cases similar to these, where the price continues to drop, it is always better to watch from the sidelines.
How to determine how deep the knife will fall: locating the market bottom
Not all chart patterns move the way LUNA did. In every other case, if the price falls or continues to move downwards but with occasional rebounds, whipsaws, and retests, here are some handy indicators.
The Relative Strength Index is a reliable momentum indicator to help you test the depth of the falling knives. If the move to the downside is seeing RSI levels in the neutral to the overbought zone, you can expect the prices to keep dropping. However, if the RSI keeps under 30 or goes as low as 20 at some point, crypto or stock prices might be primed to move higher.
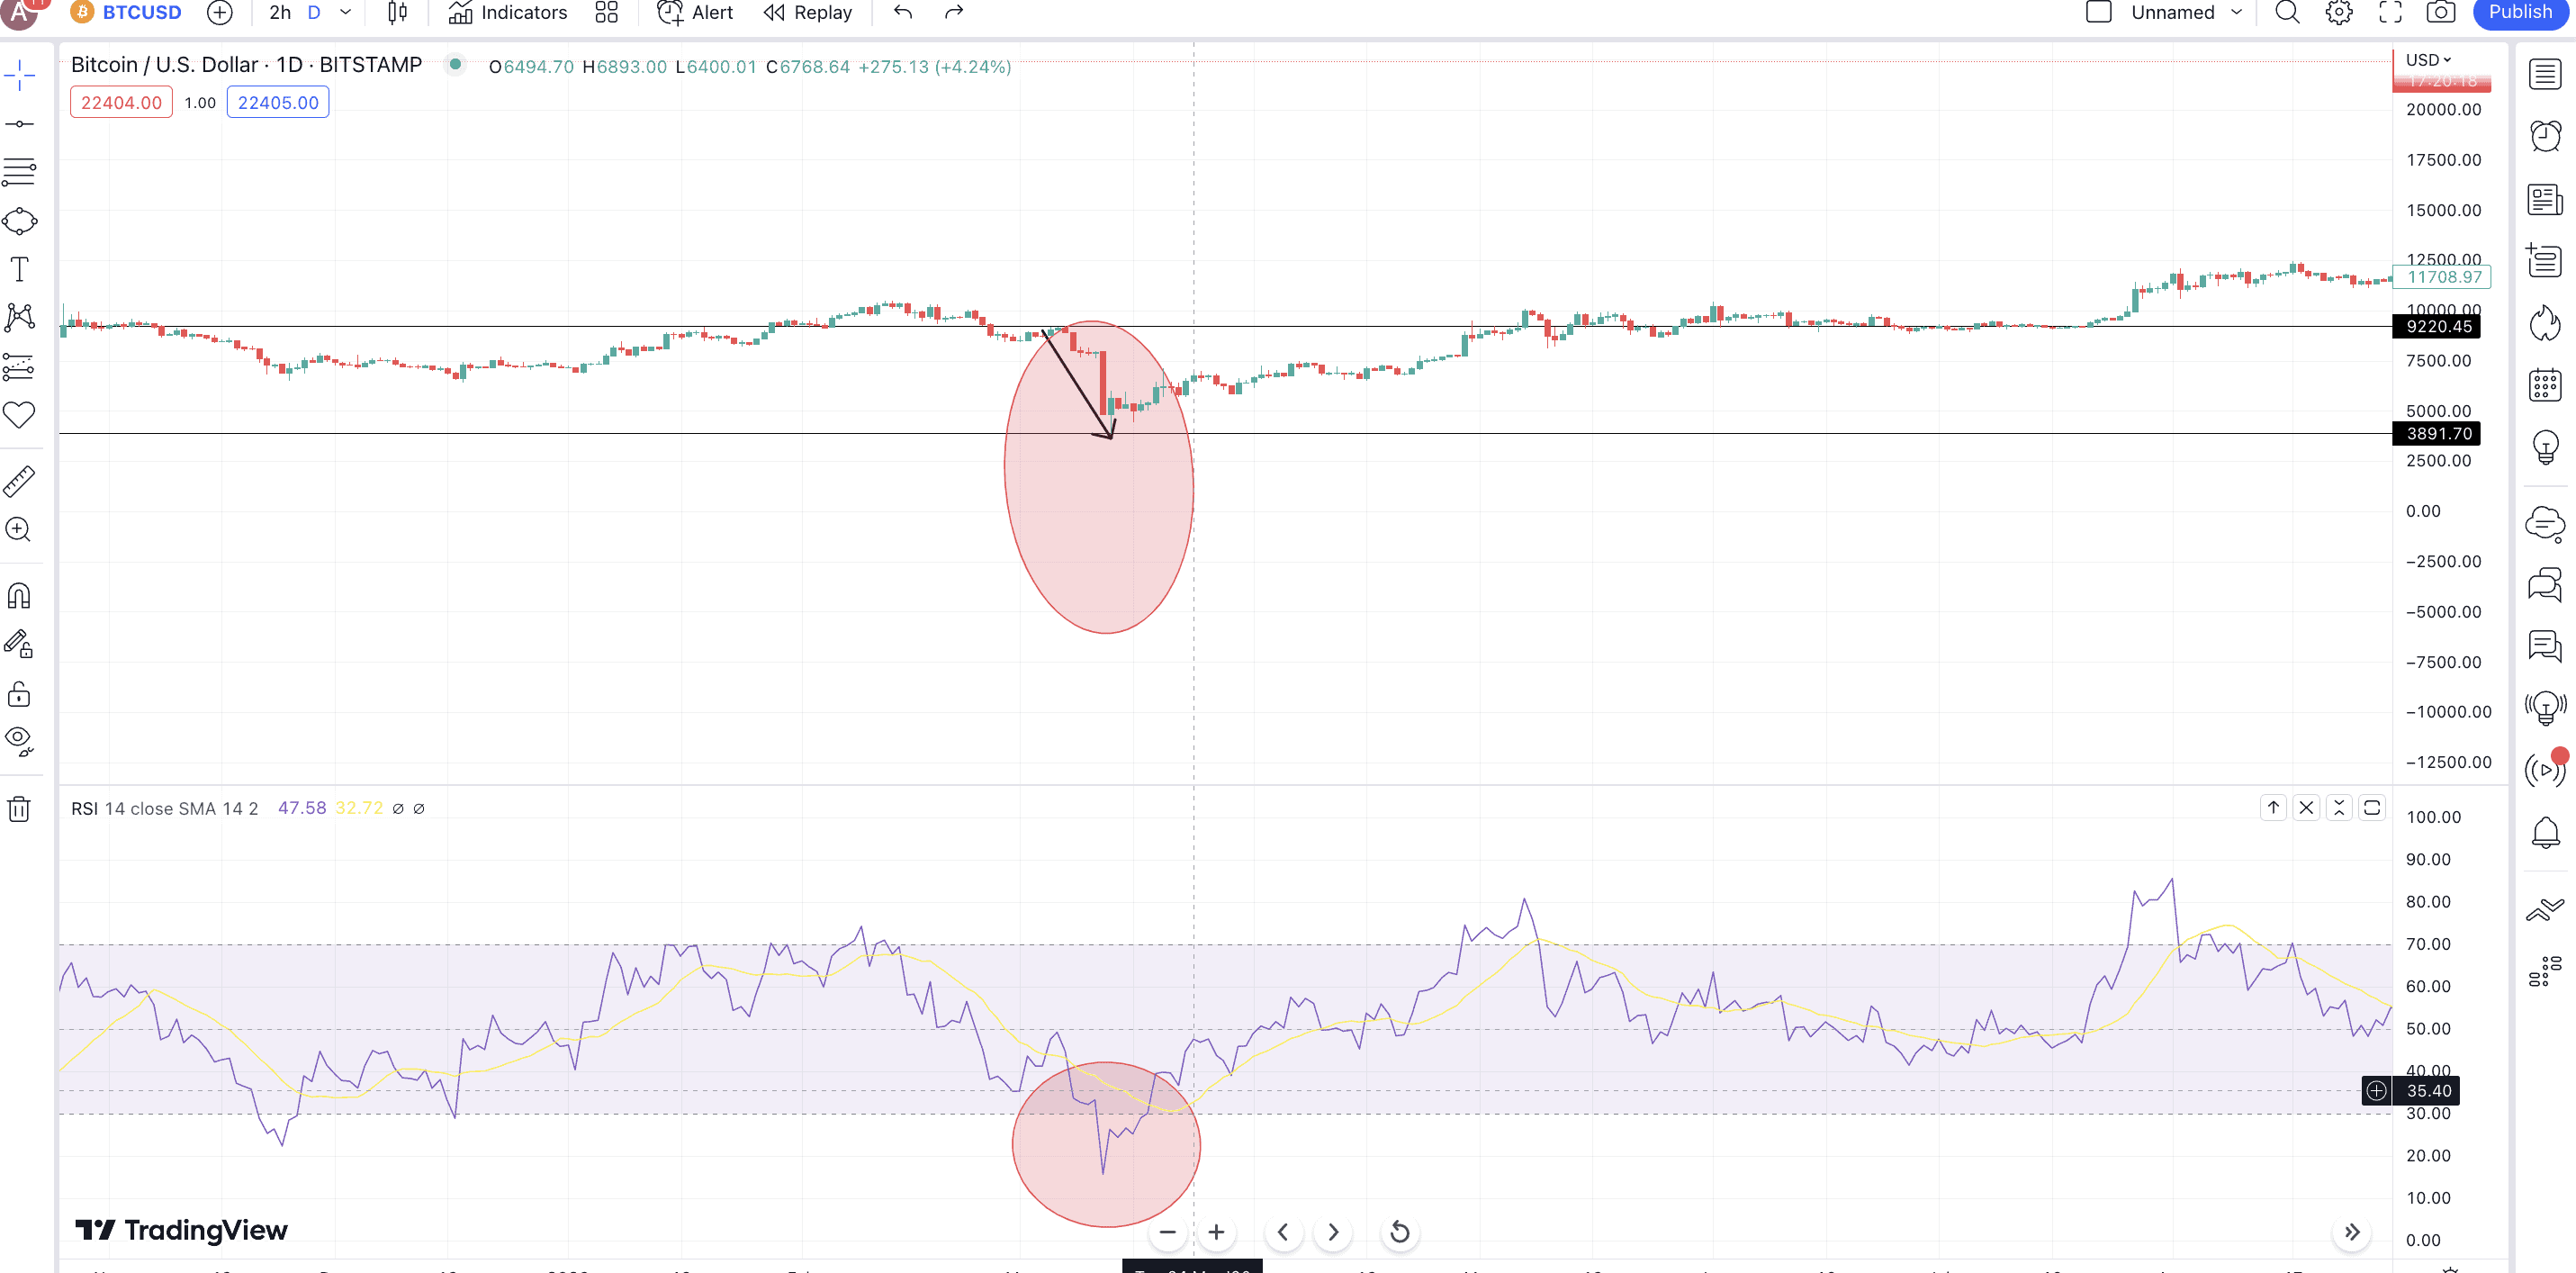
Notice how the lowest possible RSI at BTC’s counter helped identify the market bottom.
Volume
As mentioned before, lower trading volumes can accelerate any move to the downside. However, if at any point you start seeing a rise in buying volume — higher green pillars — you can expect the prices to move upwards.
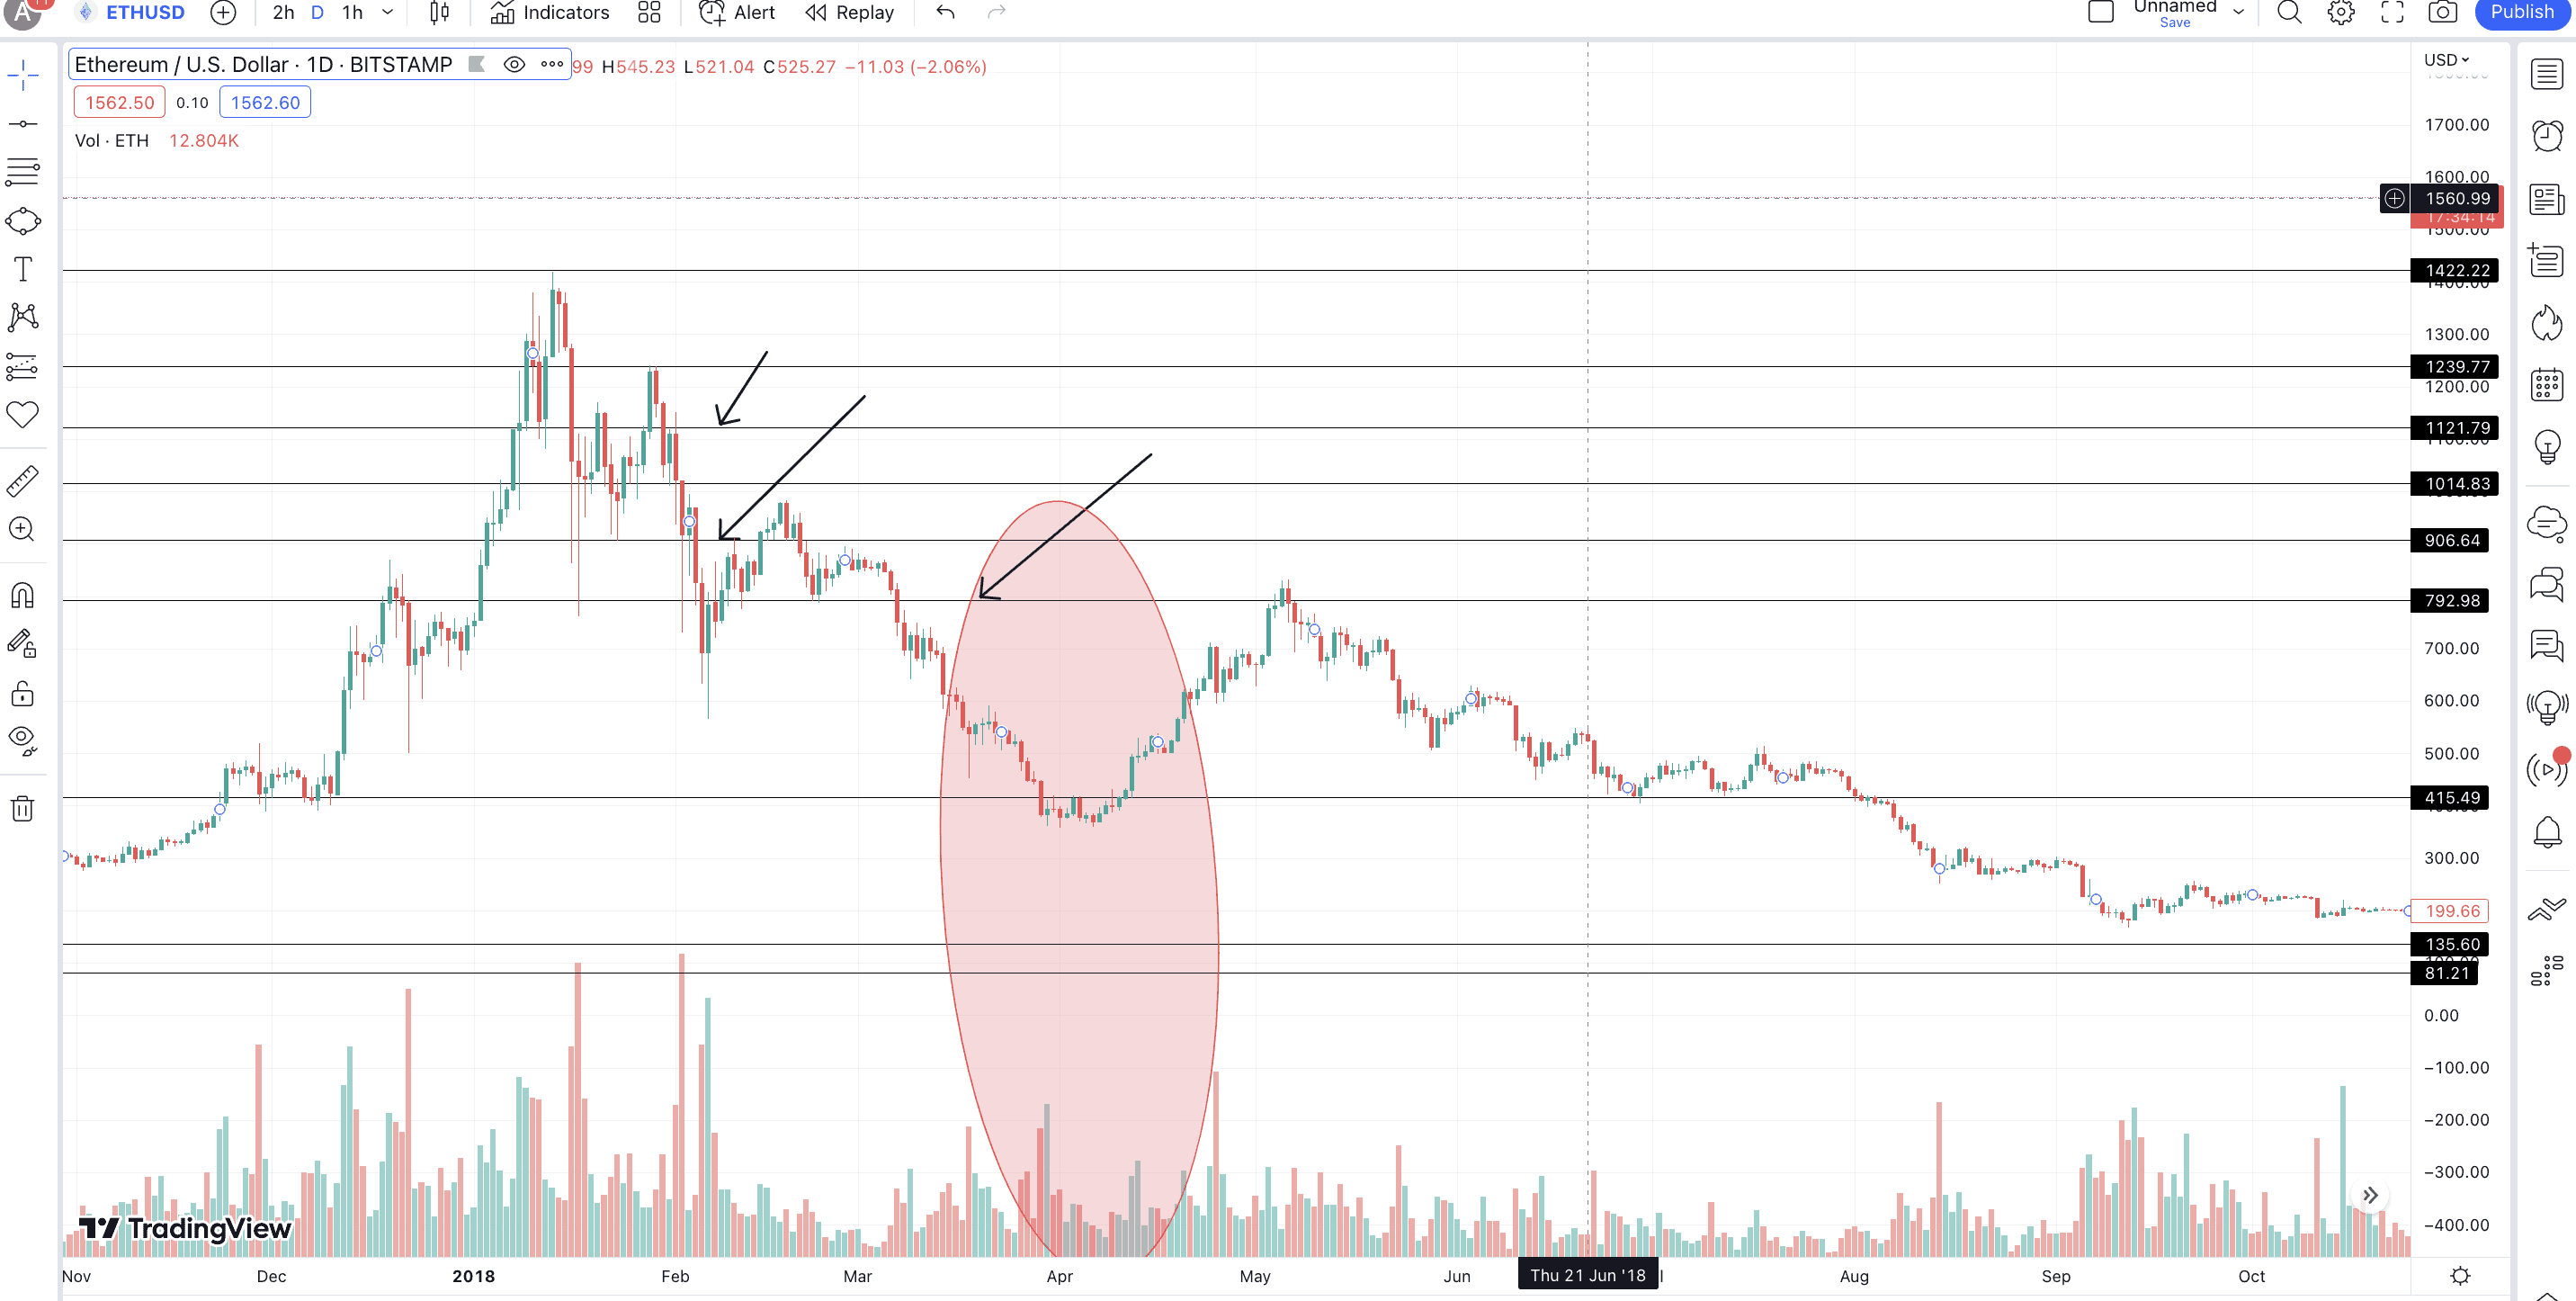
Here is the ETH chart where higher green pillars marked a move up from the bottom.
Apart from the mentioned indicators, you can rely on Bollinger Bands, MACD momentum indicator, reversal candlestick patterns, and standard chart patterns and breakouts to identify knife bottoms.
Reasons why you should avoid trading a falling knife
Here are the reasons why you should not trade a falling knife scenario:
It is risky
When the price continues to move lower, it becomes very difficult to position trades. A rapid drop can even vanquish multiple stop-loss positions. Even if you are planning to take a short position — sell high and buy low — a rebound from a false support level can liquidate positions. Hence, you are always behind and trying to catch up with your trades in a falling knife scenario.
Low reward
For long positions, trading a falling knife isn’t advisable as, in any given case, the chances of a move on the upside are lower than that on the downside. Even for short-position trades, market manipulation leading to those rebounds can be tricky to handle.
Apart from the mentioned reasons, here are some of the other pitfalls to trading a falling knife:
- Lack of clear support points
- Timing the market in the case of high-risk assets like crypto is very difficult.
- The stress levels associated with long position trades in a falling knife scenario aren’t worth it.
- Halfway into the falling knife and the price falls further due to panic selling.
Apart from that, you also need to be wary of sketchy projects where falling knives can be due to rug pulls.
When can you trade a falling knife: strategies for the same
Even though we do not recommend the same, here are some of the best ways (still risky) to trade a falling knife:
Support and resistance levels
This point might seem counterintuitive, considering the fact that a falling knife is all about fake support levels. Let’s look at a quick strategy.
Yes, the support levels during a move to the downside cannot be relied on. However, you can keep these support lines handy to locate the possible drops in case there is a rebound. That way, if you are sure that weaker sentiments will push the prices lower and a dip is just a matter of time, a short position at the rebound level (above the support level) can make sense.
Oscillators
Indicators like RSI, Commodity Channel Index (CCI), or even the Stochastic Oscillator can locate the oversold zones to identify a possible rebound or an opportunity for buying an item asset. However, in that case, you should look for positive RSI or MACD divergences to identify similar opportunities.
Diversification
Even in crypto, it is advisable to have a diverse portfolio to be able to hedge the risks of rapid drops. Having multiple assets can help hedge risks.
DCA
In the case of a falling knife, it is very challenging to time the market. A better trading approach is to follow dollar-cost-averaging. However, this would only work if you are sure about the project’s long-term prospects and fundamentals.
And finally, you can use more stable trading pairs like BTC-USD or BTC-USDT instead of doing token swaps. That way, you can compare and evaluate a crypto’s price against a more stable unit and not any other crypto. A stop loss is necessary while trading a falling knife, regardless of the approach.
Terms that you might confuse with a falling knife
Well, it is easy to confuse a falling knife with a spike or any other price move. Here are some of the terms that are thrown around and might show up with or without a falling knife in progress.
Dead cat bounce
This happens to be a temporary price rebound or a recovery phenomenon. However, this is mostly associated with a long-term decline or even a falling knife and is mostly meant to trap traders.
Bull trap
This is another type of rebound but with more credible indicators, like even a positive RSI divergence. However, depleting volumes can help you identify this zone of recovery.
Oversold region
Even though locating an oversold RSI region can help you identify the market bottom, it might not always be accurate. In some cases, the oversold metric might lead to a small recovery before furthering the falling knife. A good way to check for this is to even focus on the fundamentals and wait for the RSI to go very deep in the oversold arena. You should also be wary of sudden RSI surges, as even that might hint at a possible manipulation.
However, more often than not, confusing a rebound in a falling knife with a spike is common. However, such a spike can be a dead cat bounce or even a bull trap.
To trade or not to trade a falling knife?
A falling knife isn’t easy to trade. The most advisable course of action is to wait for the prices to correct, retrace, and follow an uptrend before you can start buying. However, if you have a high-risk appetite and you do not mind catching a falling knife, we urge you to catch it from the top — the handle. This means you can sell at the top and buy the asset back when the prices dip. Taking short-position trades is a better way to catch a falling knife. Yet, you must be first sure that it is a falling knife you are dealing not a bear trap.


