


Crypto trading patterns frequently appear in crypto charts, leading to more predictable markets. When looking for trading opportunities, these chart formations are used to identify price trends, which indicate when traders should buy, sell, or hold. Crypto chart patterns are useful in identifying these price trends.
If you want to learn how to read and understand crypto charts, take our TA training course, which includes a demonstration from our Senior Analyst. The first video is free to watch for anyone who follows the link and joins our Telegram community.
What are trading patterns?
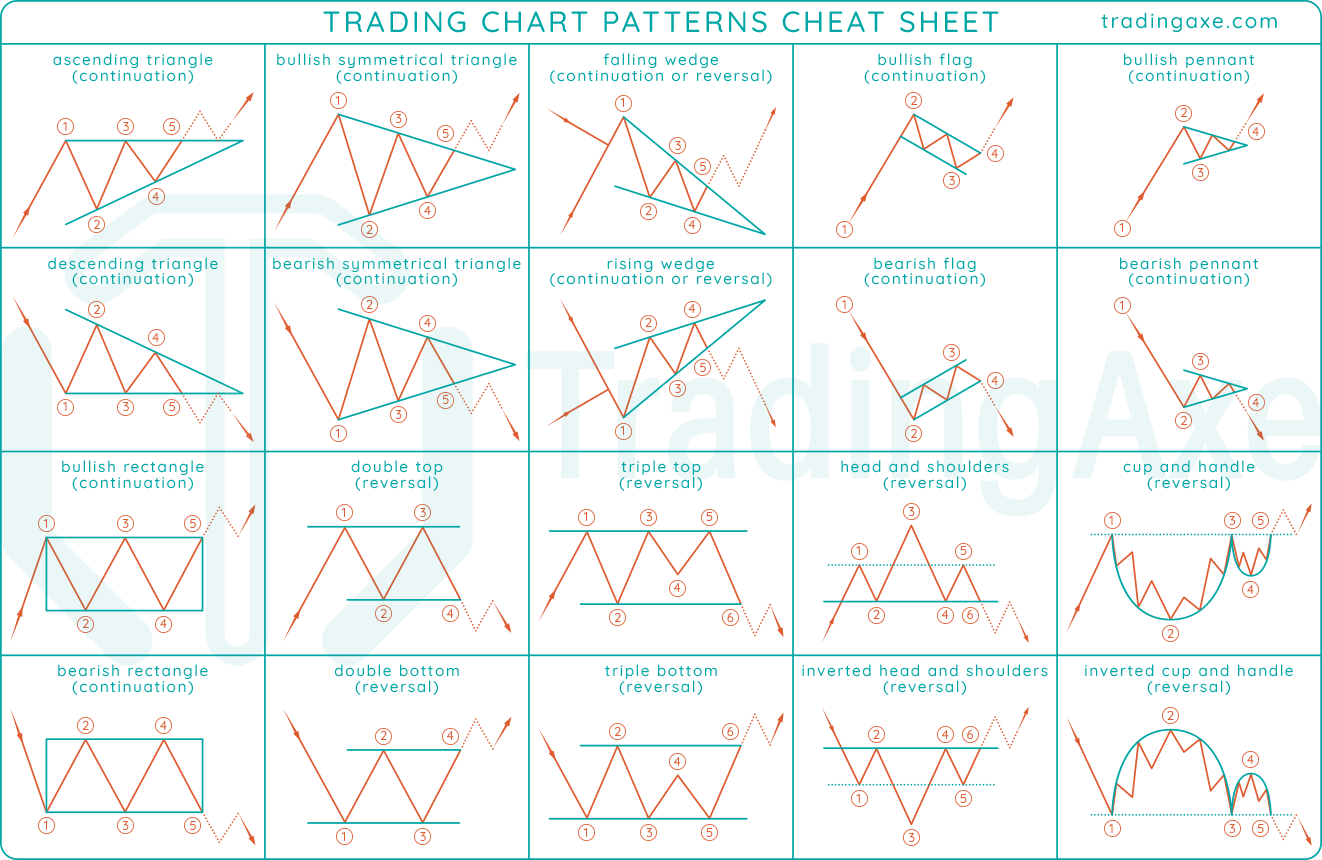
Chart patterns identify transitions between rising and falling trends. These patterns are a formation of price movements identified using a series of trend lines and/ or curves, connecting a series of peaks (highs) or troughs (lows). Trading patterns are technical analysis tools traders use to create more informed trading strategies in predictable markets.
Generally, there are two types of trading patterns: reversal and continuation patterns. However, some add a third type, bilateral patterns. Continuation patterns indicate that a trend will almost certainly continue in the same direction. Reversal patterns indicate the occurrence of a trend reversal.
Bilateral chart patterns indicate that the price of the asset can move in either direction. Either the price will move along with the current trend, or it will move against it.
Trading pattern terminology
If you are going to trade, it’s important that you learn some trading jargon. That is because there are a lot of terms that you need to understand trading patterns.
Support and resistance
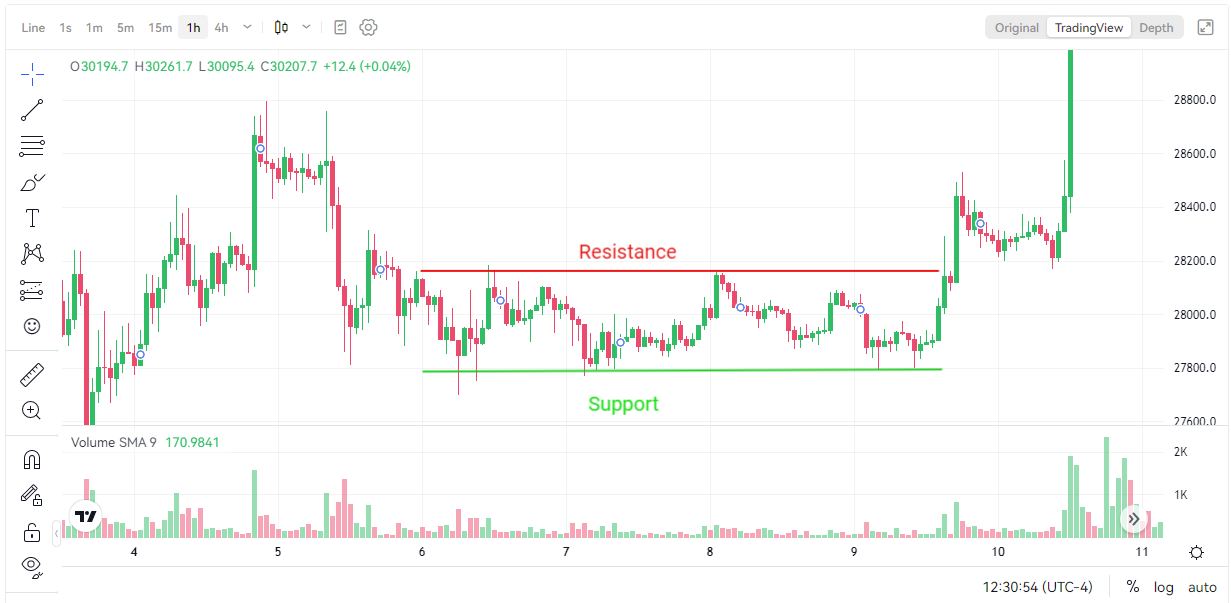
Technical analysis uses two fundamental concepts: support and resistance. When a downtrend pauses due to an increase in demand, support occurs. Resistance occurs when an uptrend pauses temporarily due to an increase in supply.
For example, when the price of bitcoin refuses to increase past $28,200 over a period of time (in the example above), this is called resistance. When the price does not go lower than $27,800, this is called support.
Breakout
A breakout occurs when the price of an asset moves above or below a resistance or support area. Breakouts indicate that the price has the potential to begin trending in the breakout direction.
Bull and bear markets
A bull market is a market that is on the rise, while a bear market exists in a market that is falling. You can recognize a bull market on a chart as a rising trend line and a bear market as a falling trend line.
Peaks and troughs
A peak is the highest point of a market, while a trough is the lowest point of the market. On a chart, peaks resemble hills, while troughs resemble dips. They are great for timing when to get in and out of the market.
Must know crypto trading patterns
Continuation patterns
Triangles
Triangles are the most commonly used crypto trading patterns. They are continuation patterns; however, many traders also consider them bilateral patterns. These types of patterns occur more frequently than others and are, therefore, a popular tool for technical analysis. They last anywhere from weeks to several months.
Ascending triangle
The ascending triangle is a bullish continuation chart pattern formed by drawing a horizontal line aligned to the resistance points and an ascending trendline parallel to the support points. As a result, a breakout will typically occur in the direction of the trendline, signaling an upwards trend in price.
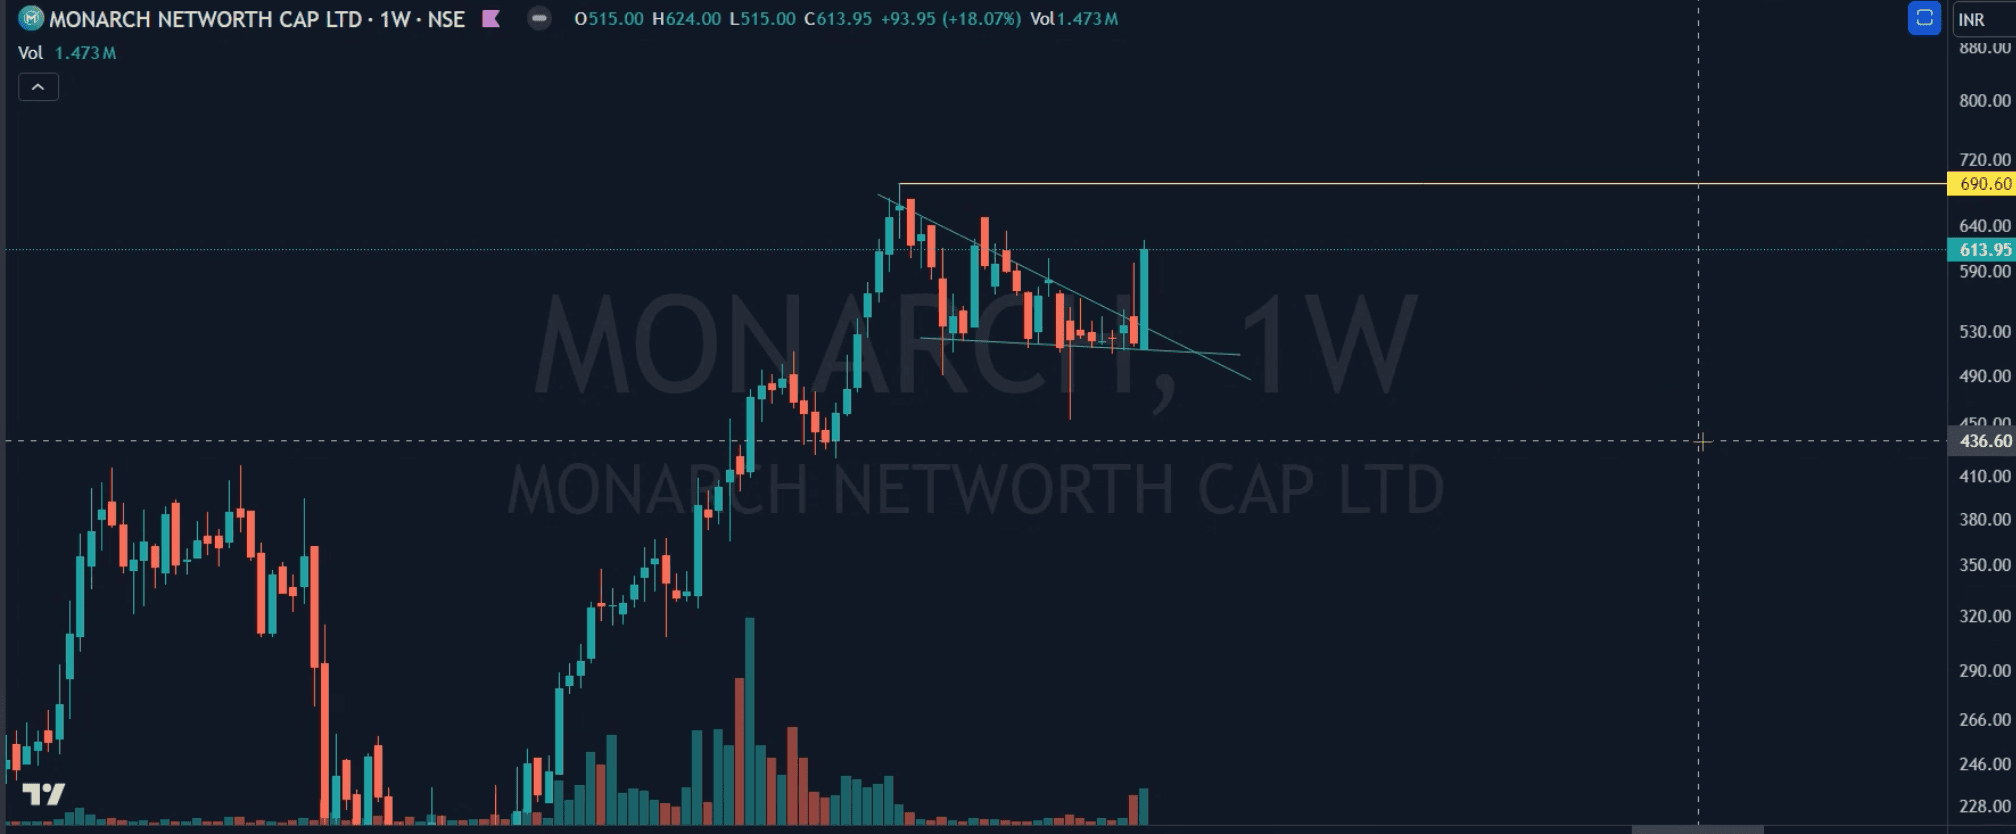
Descending triangle
The descending triangle is a bearish continuation chart pattern with a horizontal support line and a descending resistance line. Therefore, a breakdown will occur in the trend, signaling a downward trend in price, as seen in the candlestick patterns below.
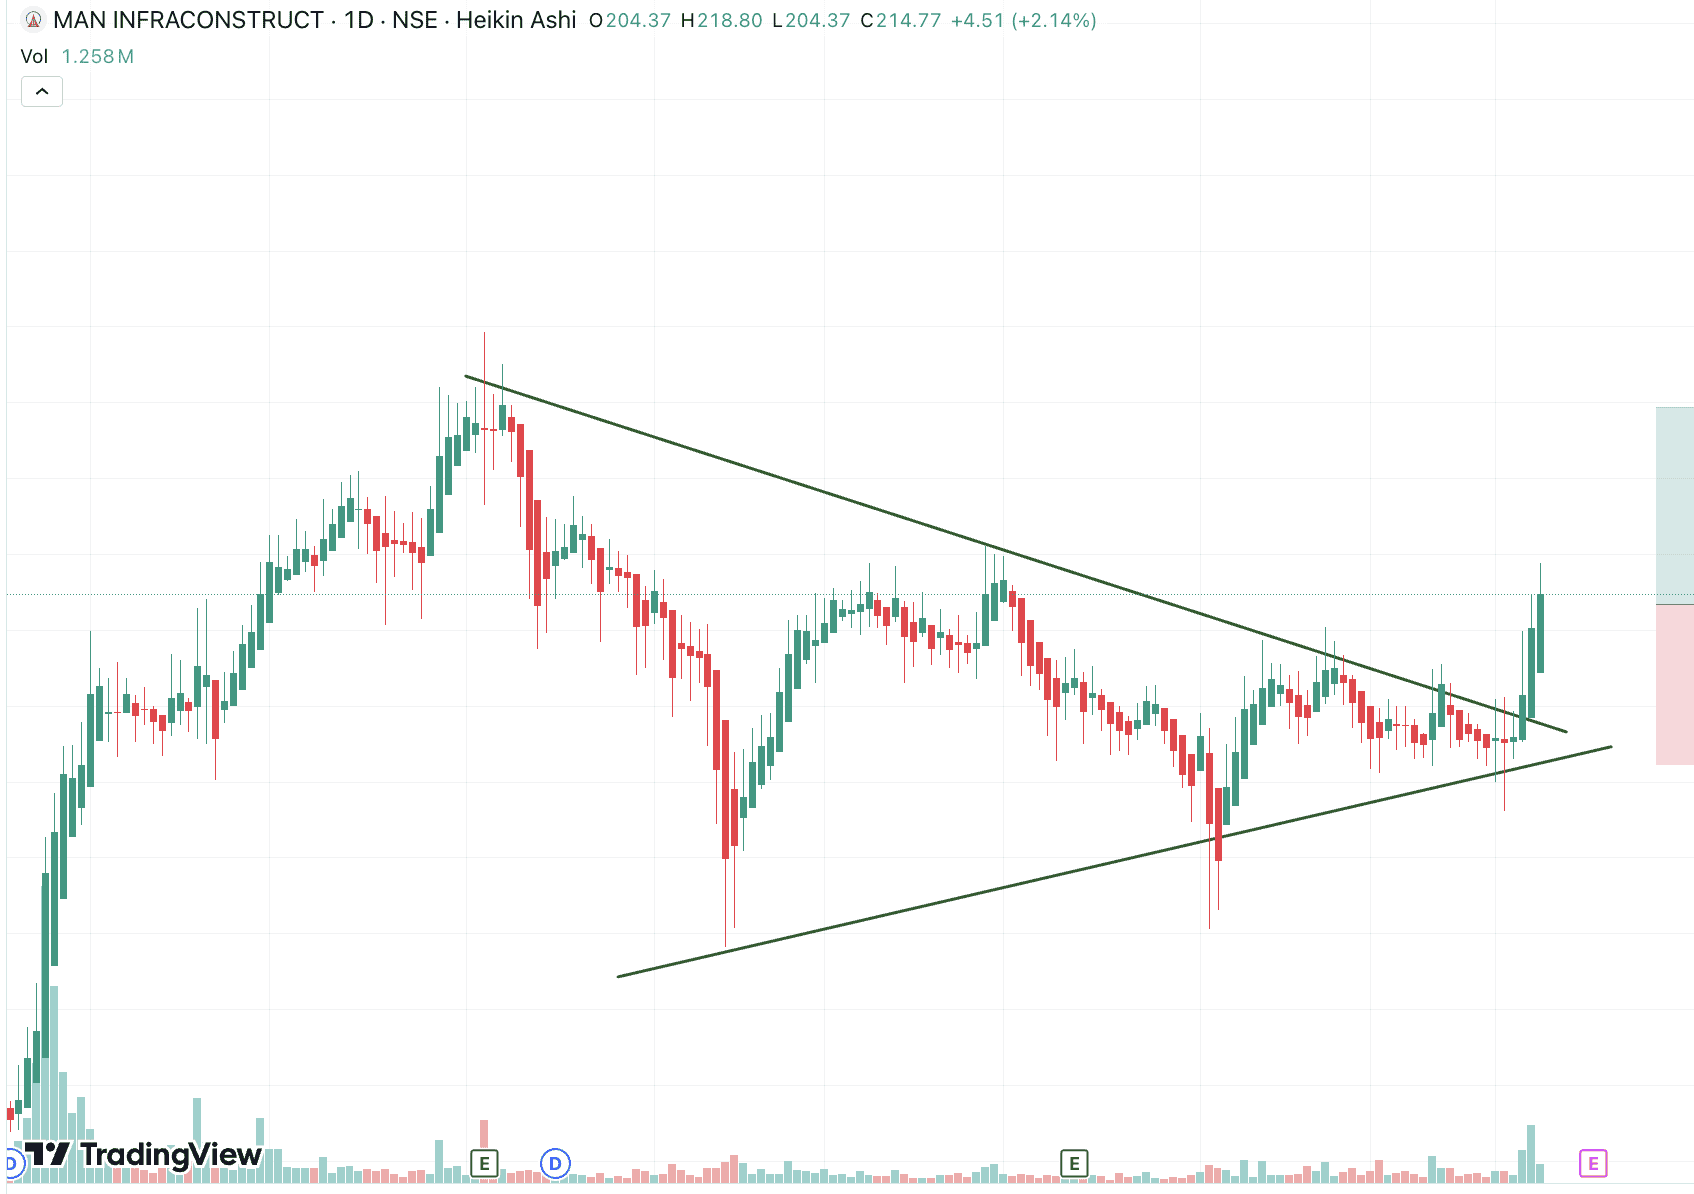
Symmetrical triangle
Symmetrical triangles form when two trend lines intersect toward each other and indicate that a breakout is likely. These patterns emerge in markets that lack a clear direction. There is no upward or downward trend in this case.
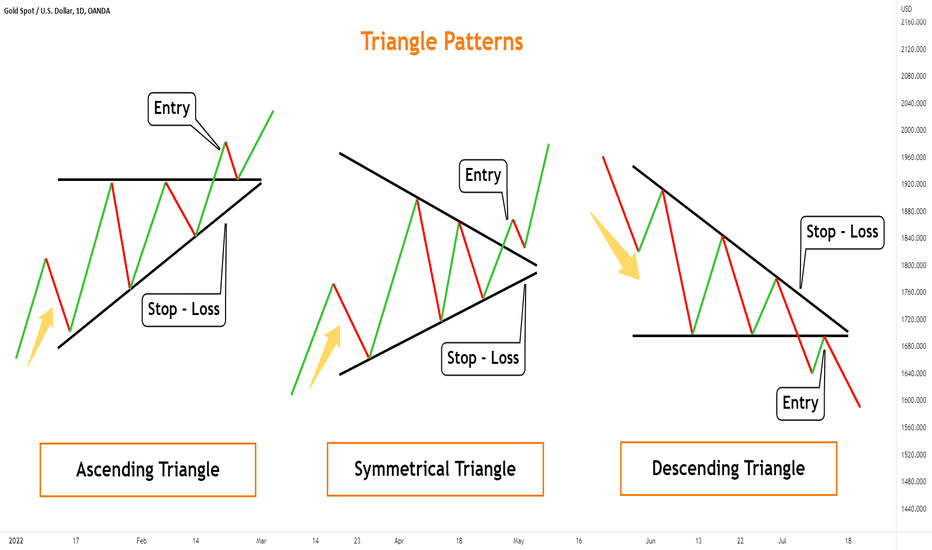
Here is another way of looking at the triangles:
Triangles (Ascending, Descending, and Symmetrical)
- Ascending Triangle: A bullish pattern characterized by a rising lower trendline and a flat upper trendline. It suggests that the price will break out upwards.
- Descending Triangle: A bearish pattern with a flat lower trendline and a descending upper trendline, indicating a potential downward breakout.
- Symmetrical Triangle: This pattern can signal either a bullish or bearish trend depending on the breakout direction. It forms with converging upper and lower trendlines.
Think of these like slices of pizza. Depending on their shape, they can tell you whether the price might go up, down, or either way.
Flags
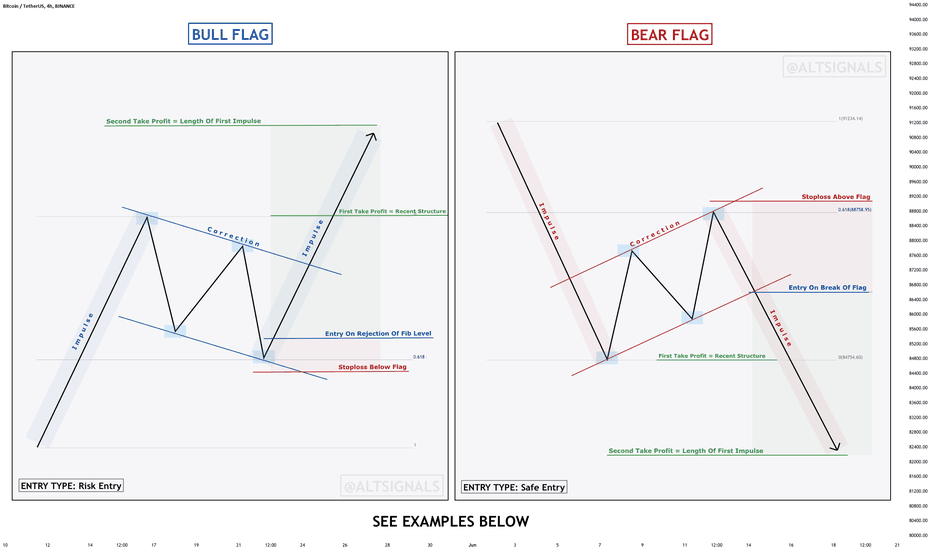
Flag patterns have two parallel trendlines that can slope up, down, or sideways. It occurs when an uptrend or downtrend develops between parallel support and resistance lines. They indicate a possible trend reversal or a change in the slope of the current trend.
A flag with an upward slope appears as a pause in a down-trending market (bear flag), while a flag with a downward slope appears as a break in an up-trending market (bull flag).
Pennants
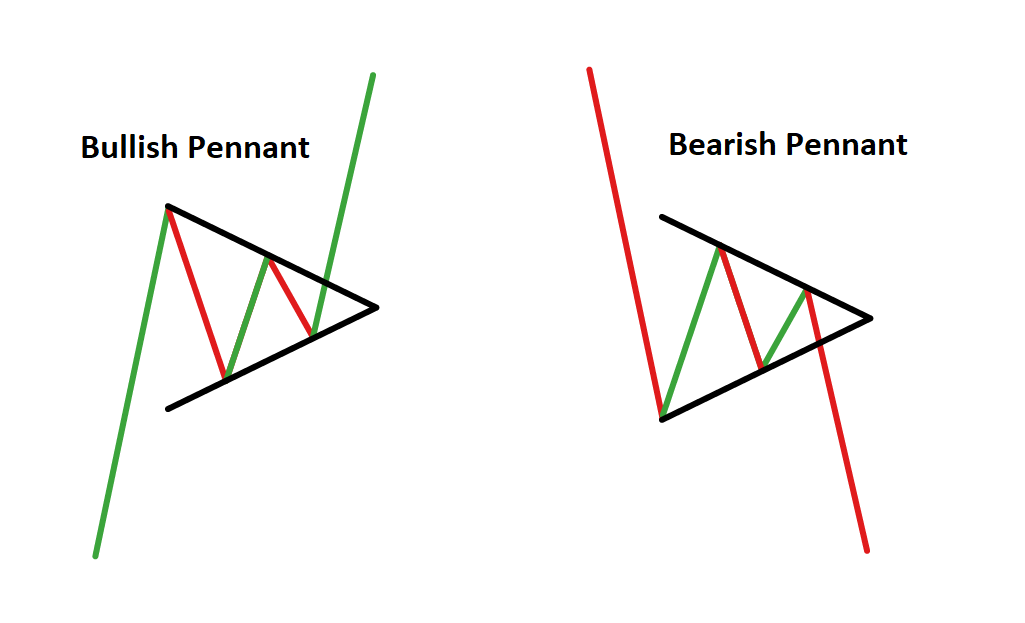
You can recognize pennant patterns by two trendlines, one downward trendline and one upward trendline, that eventually converge. They resemble asymmetrical triangles; however, pennants are short-term patterns, unlike triangles.
A bullish pennant indicates that the price is rising. The flagpole is to the left of the pennant. A bearish pennant indicates that prices are falling. A flagpole forms on the right side of the pennant in a bearish pattern.
You should know that both are short-term continuation patterns that indicate a brief consolidation before the previous trend resumes. Flags are rectangular-shaped, while pennants are small symmetrical triangles.
Flags look like rectangles waving on a pole, and pennants are tiny triangles. Both suggest that the current price trend will continue after a short pause.
Cup and handle
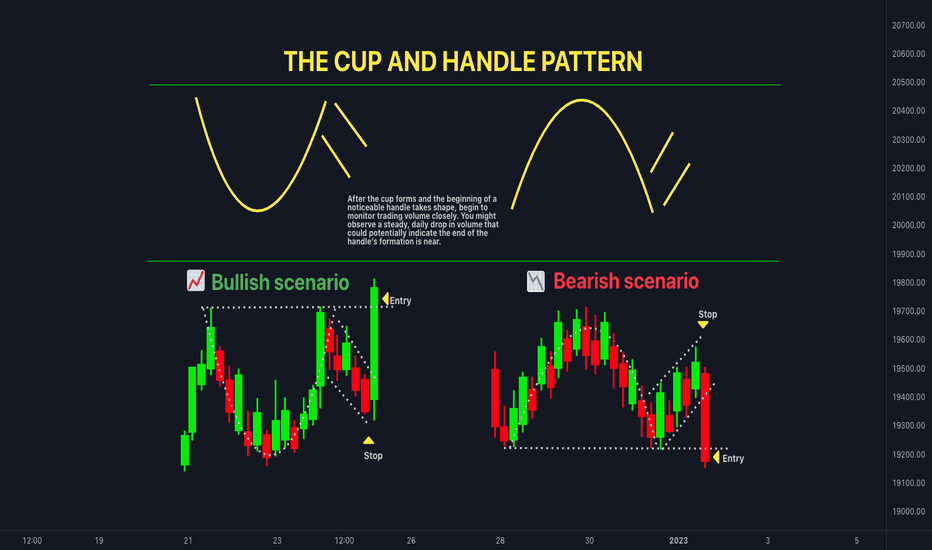
The cup and handle pattern is a continuation pattern that indicates that a trend has paused but will resume once the pattern is confirmed.
In a rising market (left), the cup pattern should be in the shape of a “U.” The handle appears as a short pullback on the right side of the cup. When the handle is finished, the price may break out to new highs and resume its upward trend.
In a falling market (right), the cup pattern resembles an “n.” The handle appears as a short retrace on the right side of the cup. When the handle is complete, the price may break out to new lows and resume its downward trend.
Here is a simple way of looking at it:
This bullish pattern resembles a teacup. It indicates a consolidation phase followed by a breakout. The “cup” is a rounded bottom, and the “handle” is a slight downward drift after the cup formation.
Picture a teacup with a handle. When you see this, it often means the price is gearing up to move higher.
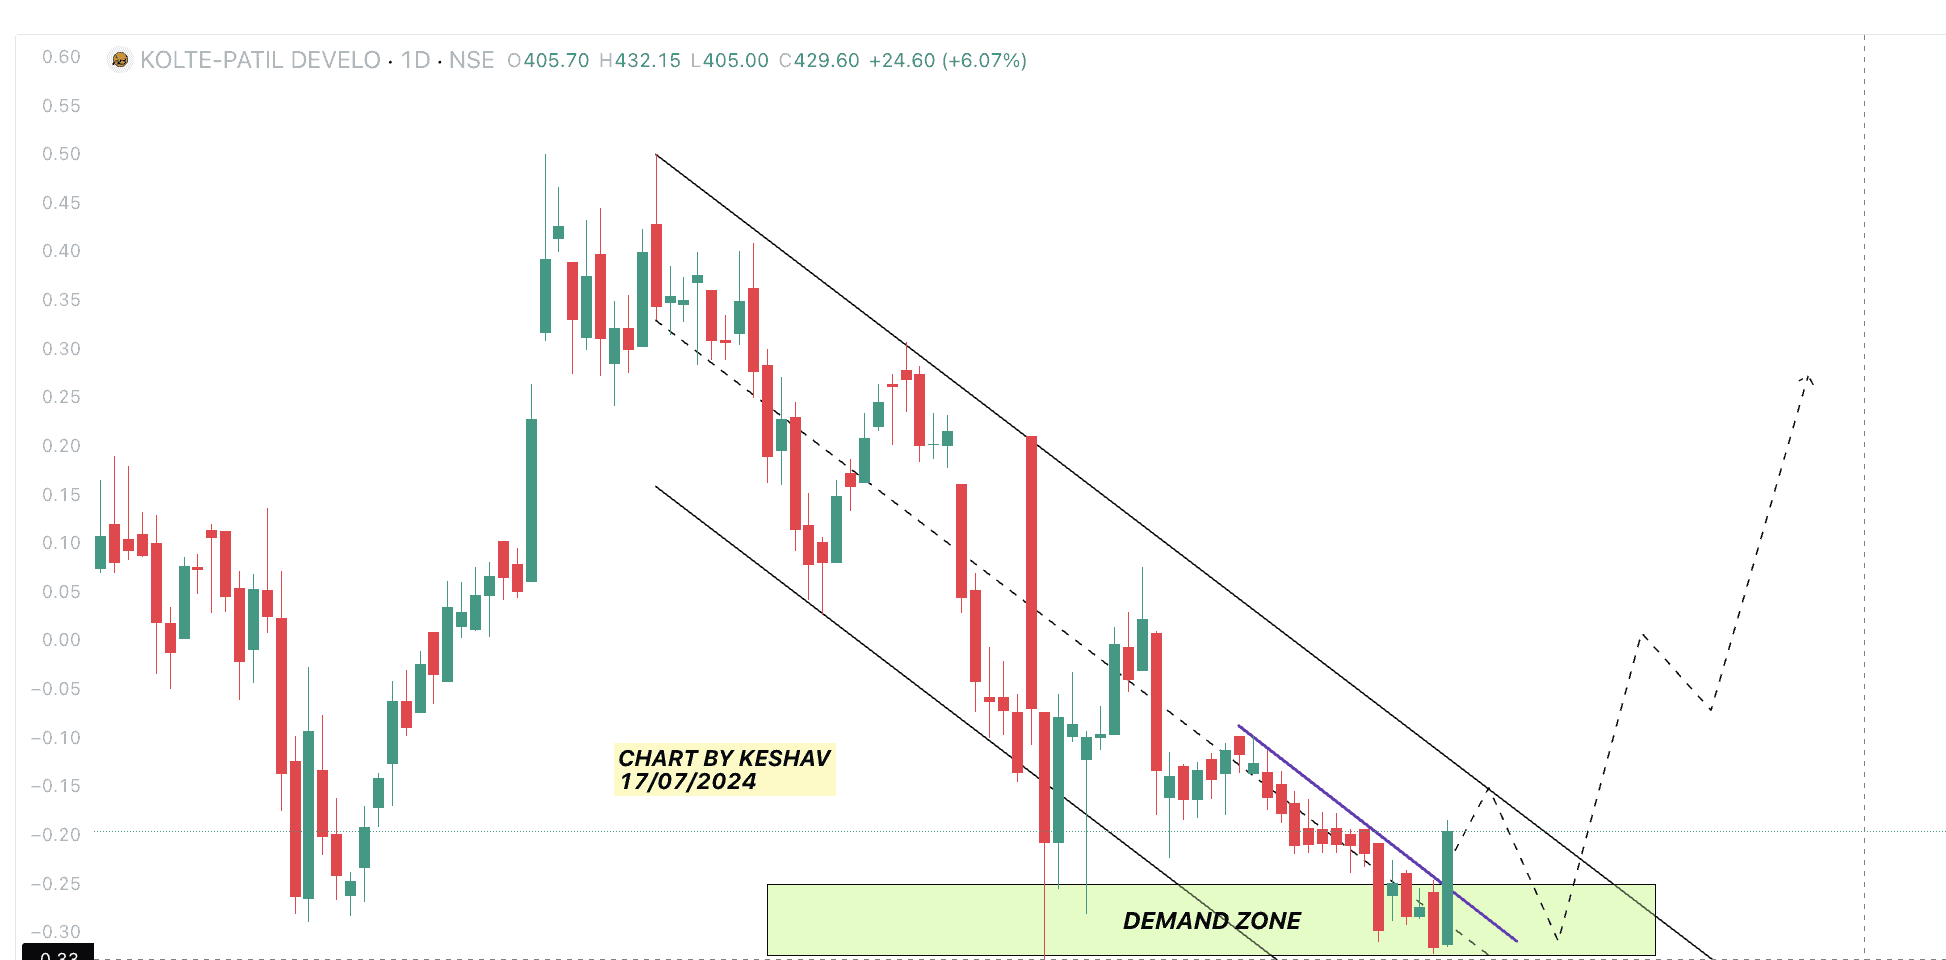
Price channels
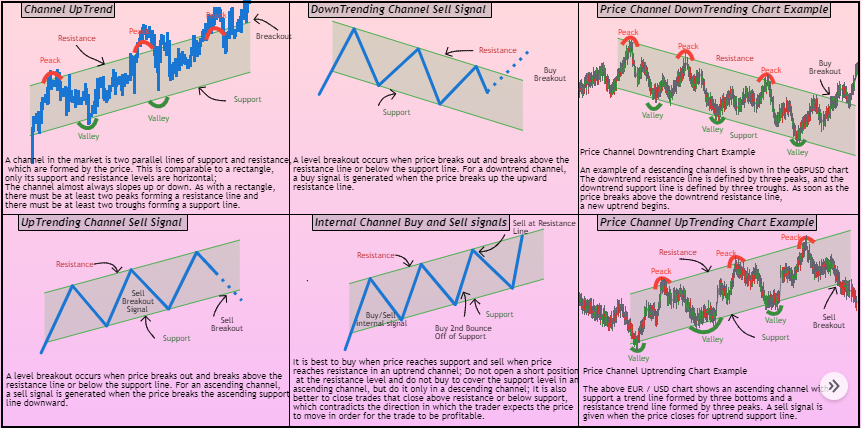
Price channels allow a trader to monitor and speculate on the current market trend. They are made by connecting highs and lows with two parallel ascending, descending, or horizontal lines. The parallel lines are areas of resistance (higher) and support (lower).
A continuation pattern with a bullish slope (bottom left) is known as a bullish channel. The previous bullish trend will likely continue if prices break through the upper channel line.
A continuation pattern with a downward slope (top right) is known as a bearish channel. The previous bearish trend will likely continue if prices break through the lower channel line.
You can learn to read crypto chart patterns by using services like TradingView on exchanges like OKX. Try it out on OKX!
Reversal patterns
Wedges
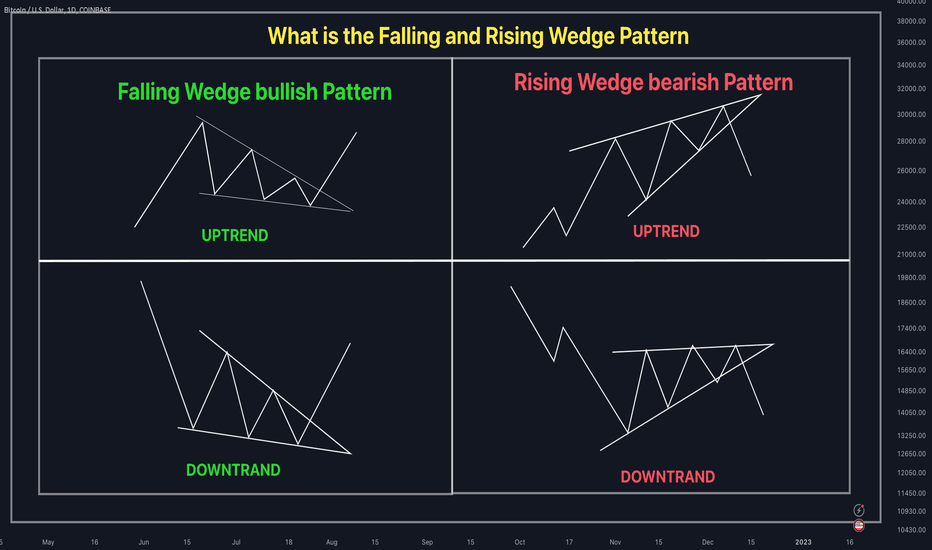
Wedge crypto trading patterns can be continuation or reversal patterns. They have two converging trendlines, just like pennants. However, a wedge is identified by the fact that both trendlines are advancing, either upward or downward.
A bullish wedge (angled down) represents a pause during an uptrend or downtrend. Conversely, a bearish wedge (angled up) represents a brief interruption during a downtrend or uptrend.
Interested in a simpler explanation:
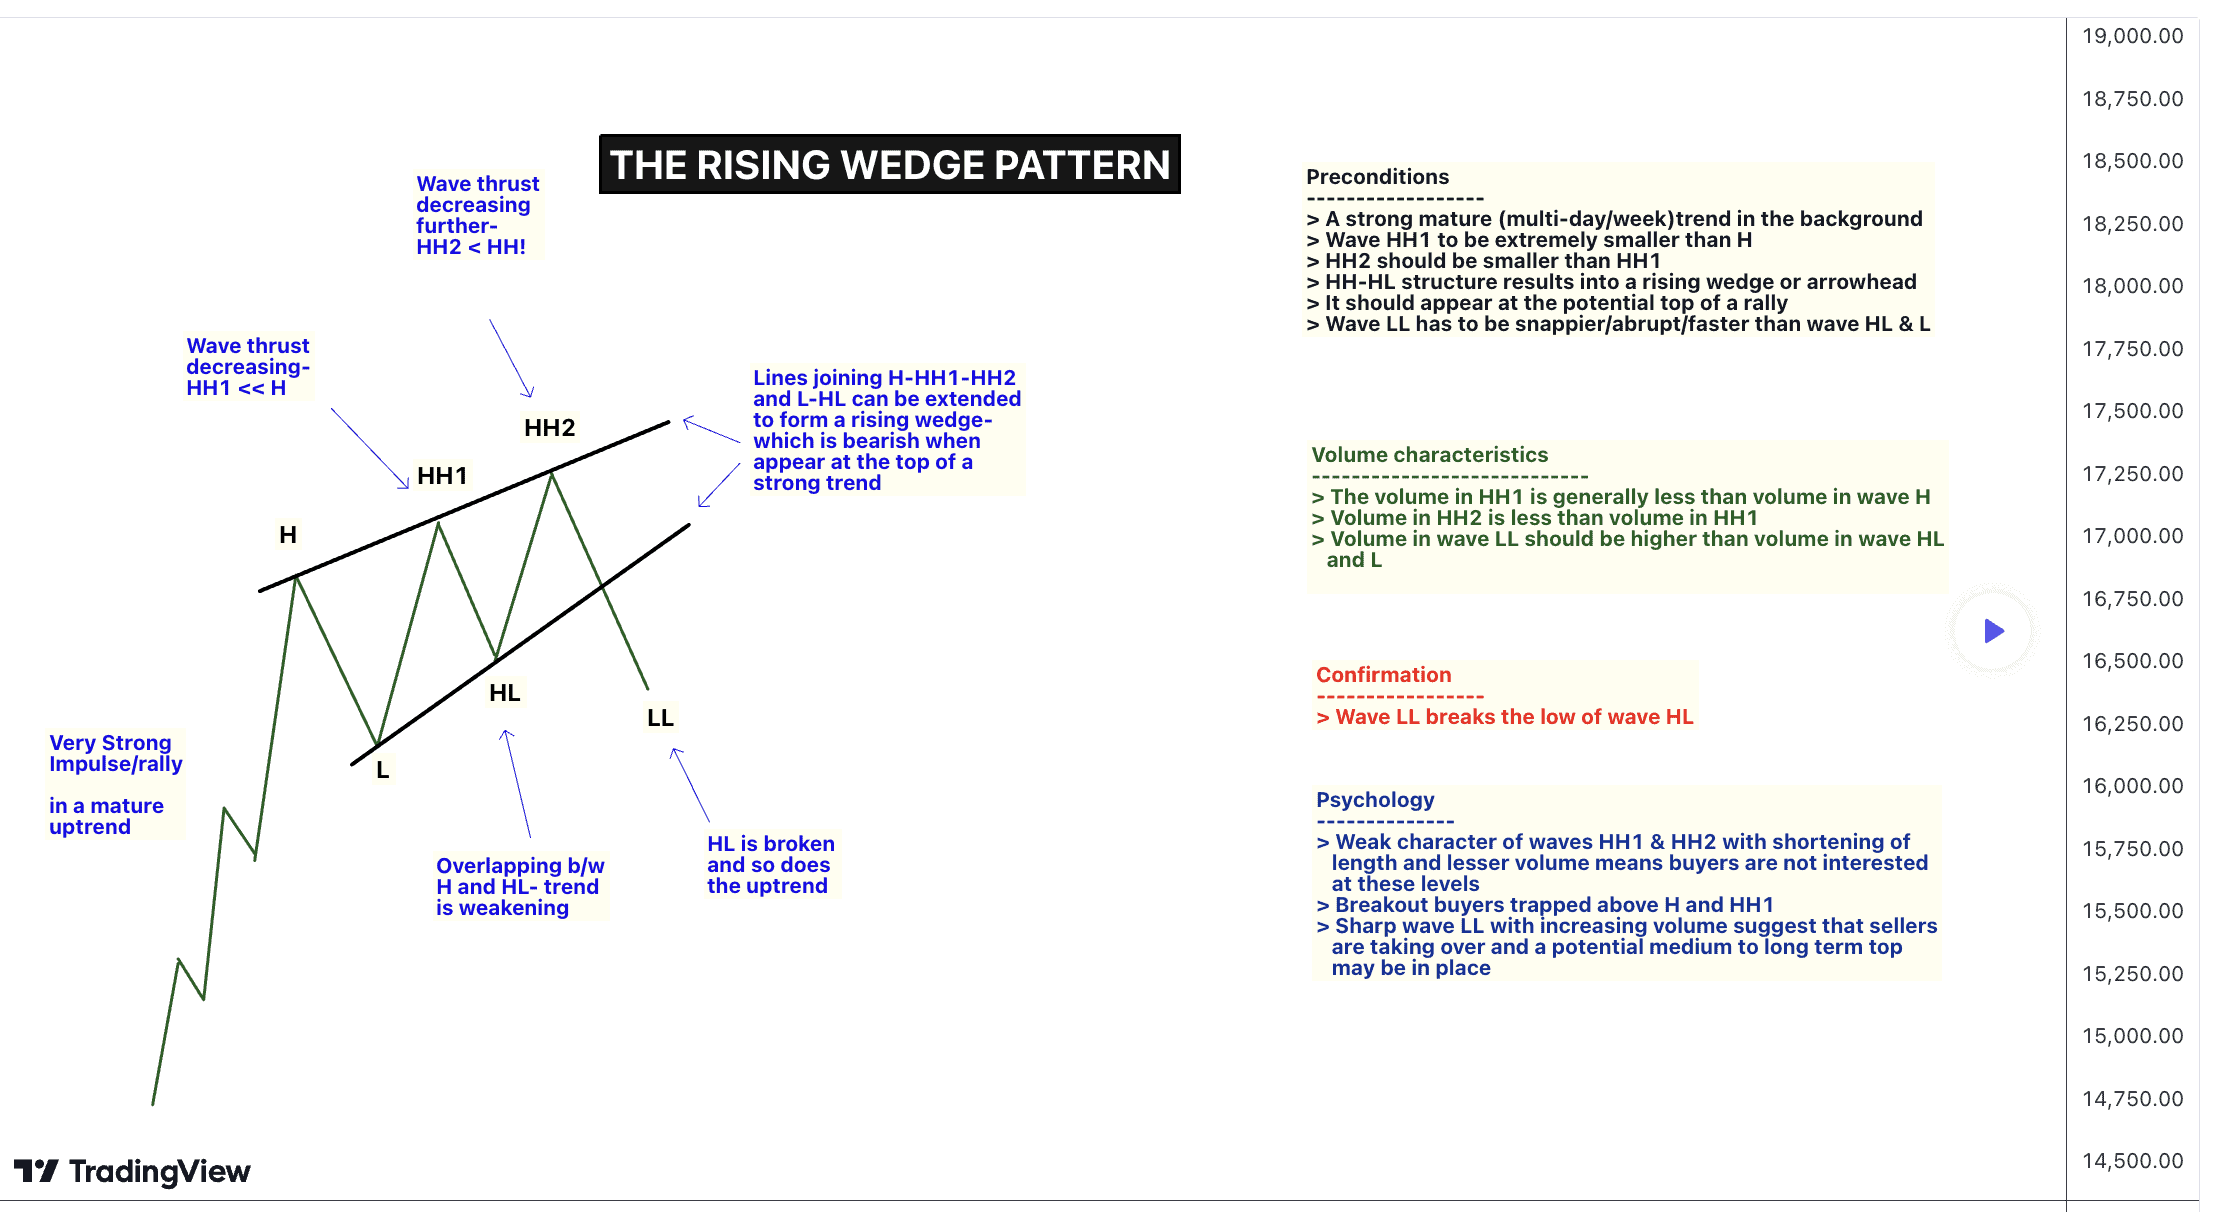
- Rising Wedge: A bearish pattern that signals a reversal during an upward trend. The price consolidates between upward-sloping lines.
- Falling Wedge: A bullish pattern indicating a reversal during a downward trend. The price consolidates between downward sloping lines.
In the candlestick patterns above, you can see the wedges look like narrowing slices of pie. A rising wedge suggests prices might drop, while a falling wedge hints that prices could rise.
Head and shoulders
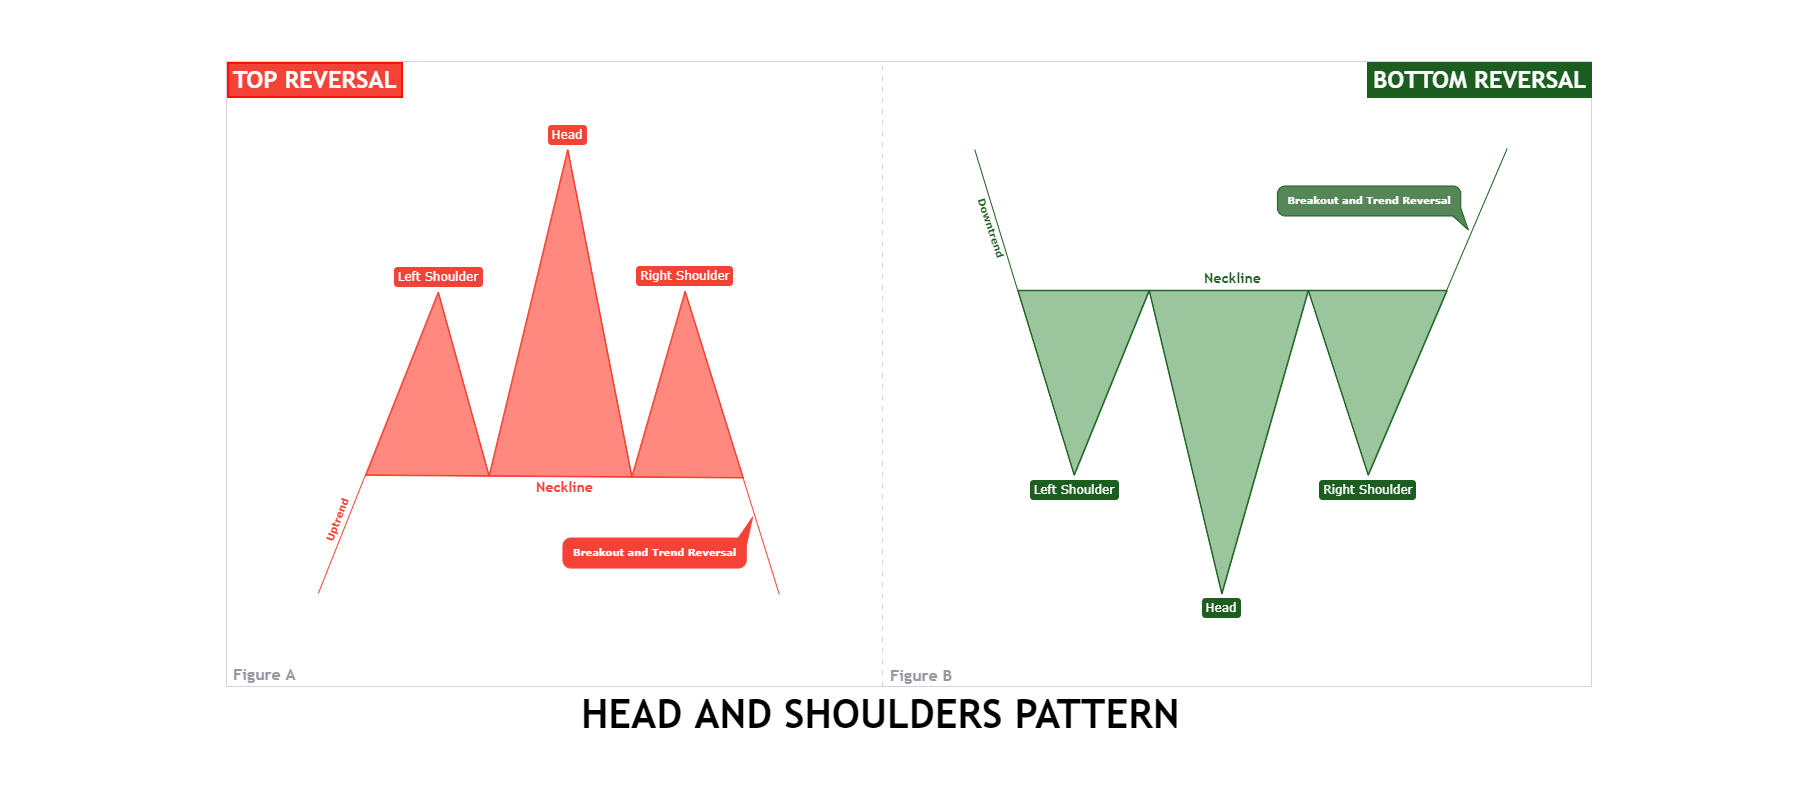
A head and shoulders pattern is a reversal pattern that can appear at market highs or lows. They appear as three consecutive peaks (top reversal, left image) or three consecutive troughs (inverse head and shoulders, right image).
A head and shoulders top reversal pattern in a rising market could lead to a downtrend or a trend reversal. On the other hand, a falling market that forms an inverse head and shoulders is more likely to experience an upward trend reversal.
In simple terms, imagine three mountains where the middle one is the tallest. When you see this pattern, it usually means the price is likely to go down.
Double tops
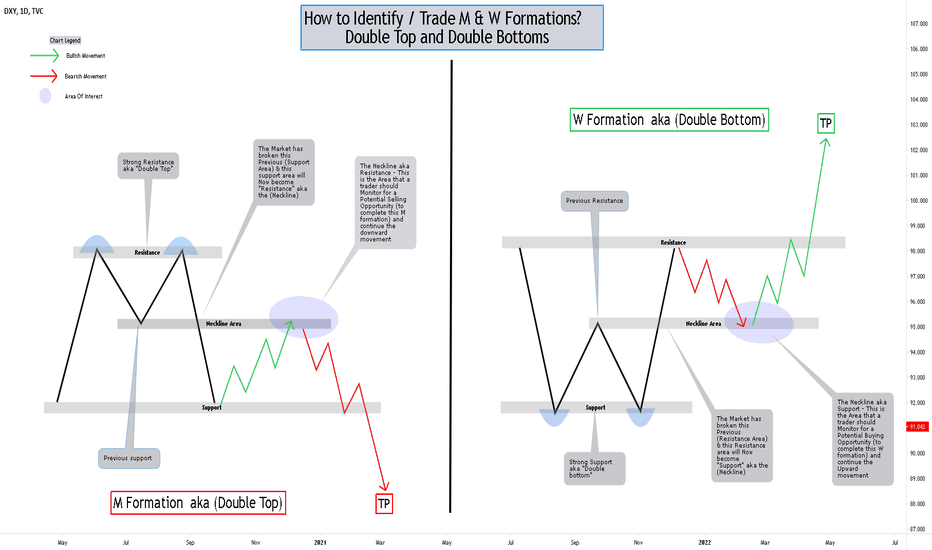
The double top (left) is a reversal pattern that indicates areas where the market has failed twice to break through a support or resistance level. It resembles the letter M, which is an initial push-up to a resistance level followed by a second failed attempt, often resulting in a trend reversal.
Picture two peaks side by side. When you see this, it means the price may drop after hitting the high point twice.
Double bottoms
A double bottom (right) resembles the letter W. It occurs when the price attempts to break through a support level, is denied, and then tries again unsuccessfully. This frequently leads to a trend reversal.
There are also triple tops and triple bottoms. They generally follow the same trends as double tops and double bottoms.
Imagine a ‘W’ shape on the chart. When you see this, it’s often a sign that the price is about to increase.
Gaps
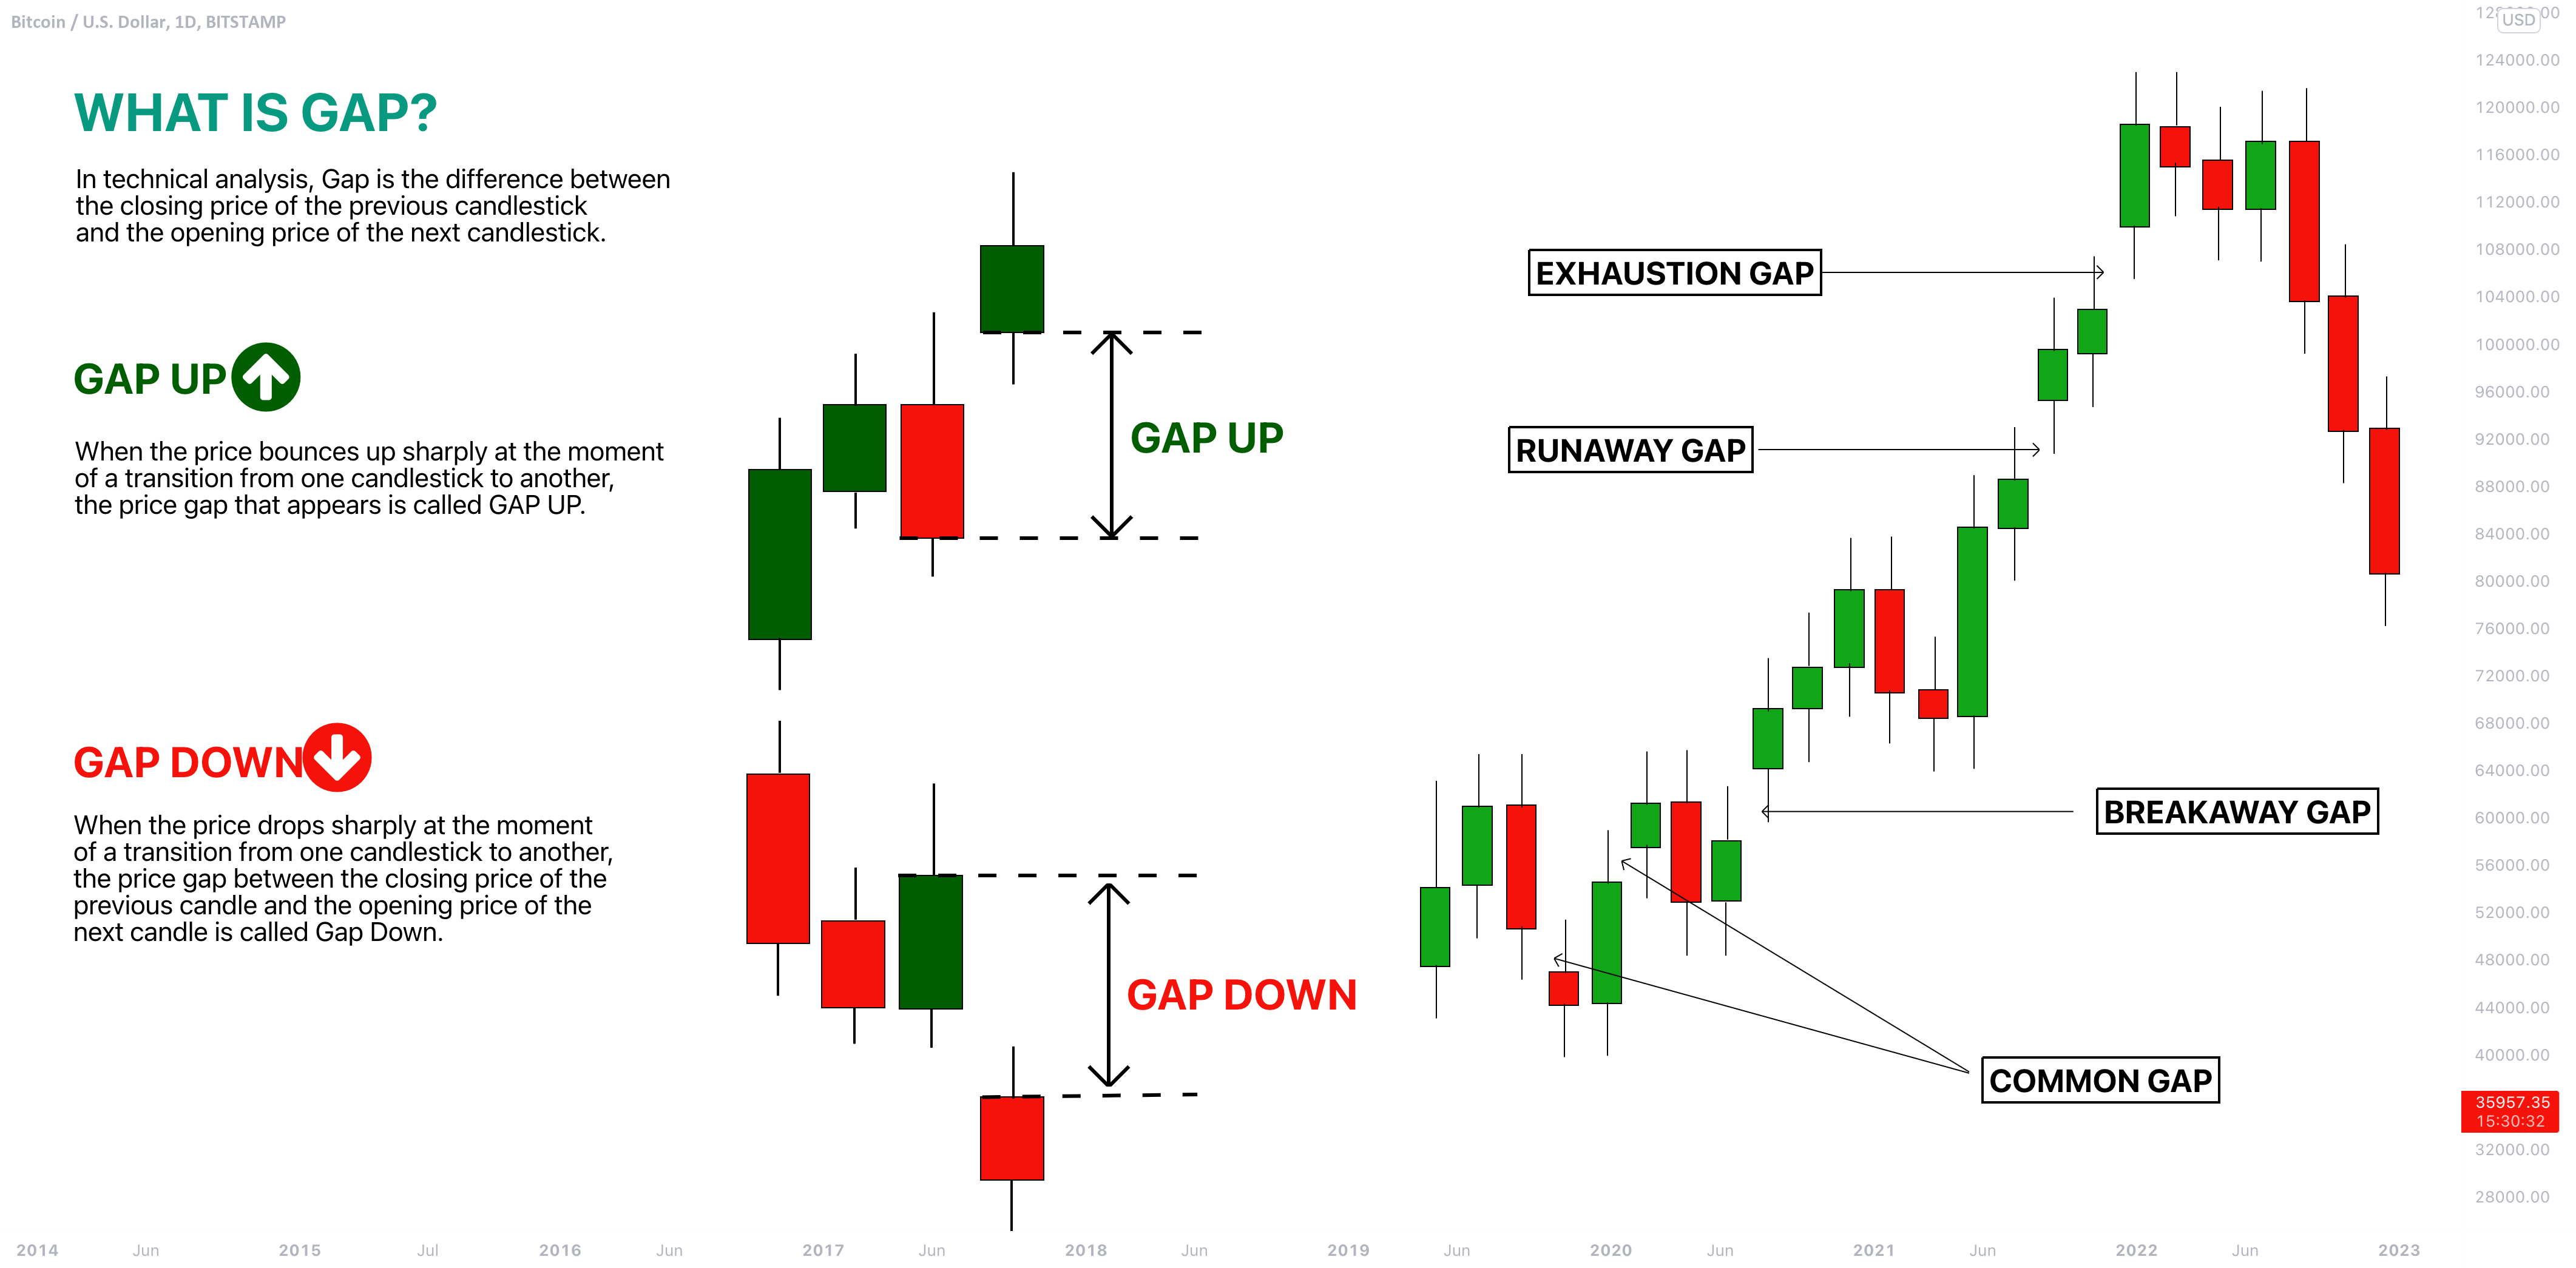
Gaps differ from traditional crypto trading patterns drawn with lines. They are reversal chart patterns that typically occur when a news story or an event attracts a flood of buyers or sellers into an asset, causing the price to open significantly higher or lower than the previous day’s closing price.
Breakaway gaps, runaway gaps, and exhaustion gaps are the three main types of gaps. Breakaway gaps appear at the beginning of a trend, runaway gaps appear in the middle of a trend, and exhaustion gaps appear near the end of a trend.
Patterns are bulletproof
Trading logic is both an art and a science. Using crypto trading patterns can make you an expert trader — if used properly. It’s all a numbers game. Even the most successful traders are lucky to have a 51% success rate.
However, some things set traders apart. The best use crypto chart patterns to inform their trades, create a trading strategy and stick to it — despite the losses. What really matters is whether you are more profitable in your successful trades than your losses. If worst comes to worst, you can always copy traders more successful than yourself. Many exchanges offer these types of features at little to no cost.


