

Developed by J.Welles Wilder Jr., parabolic SAR is one of the more reliable trend-following indicators in crypto trading. As a technical analysis tool, it is primarily used for identifying “stop and reverse” signals in the cryptocurrency, equity, and even the forex space. It is also relevant across a wide range of asset classes. In this guide, we look at how the parabolic SAR can be implemented for initiating rewarding crypto trades.
By the end of this guide, you should be familiar with how parabolic SAR works. You should also know what indicators work best with it and what diverse advanced trading strategies one can use.
Top Crypto Trading Exchanges
Best for interest rates
Best for spot trading

Best for altcoins trading
- Unpacking the Parabolic SAR indicator
- How does parabolic SAR work?
- Parabolic SAR for crypto trading: different strategies
- Using parabolic SAR for bitcoin or crypto trading: advanced strategies discussed
- Parabolic SAR and supertrend: a powerful combination
- Parabolic SAR in equity trading: how is it different from crypto?
- Parabolic SAR in options trading
- Dealing with false signals in crypto trading
- Is Parabolic SAR a good indicator?
- What is the best SAR strategy?
- Parabolic SAR: A one-stop solution or just part of the puzzle?
- Frequently asked questions
Unpacking the Parabolic SAR indicator
The SAR in Parabolic SAR stands for “stop-and-reverse.” And honestly, this unabbreviated version clearly defines its utility as a trading indicator. Simply put, this technical indicator is used to determine the points where the price of an asset will stop falling or rising, and the trend reverses — giving new entry and exit options to the active traders. It is one of the few concepts in technical trading that works with every kind of trading strategy — including scalping, swing trading, intraday, and more.
Here is a bit more on the SAR:
The parabolic element comes from the fact that the indicator looks like a bunch of parabolas when graphed. A real-world explanation would be to relate the parabolic SAR indicator with a detective hot on a price trial.
The relevance of parabolic SAR in technical trading
There are many aspects of identifying technical trading signals. You can rely on support and resistance levels. Or you can use oscillators like the relative strength index (RSI) to determine the oversold and overbought zones. This checks the accumulation of bears and bulls within the market.
Parabolic SAR, however, approaches technical trading differently.
It focuses on the speed and strength of the asset’s price action. It comprises technical elements like the acceleration factor — a metric determining the speed of price change. Plus, there is the extreme point — a metric that determines the level up to which the price can go or, rather, the strength of the price. Fret not; we shall discuss these metrics soon.
How does parabolic SAR work?
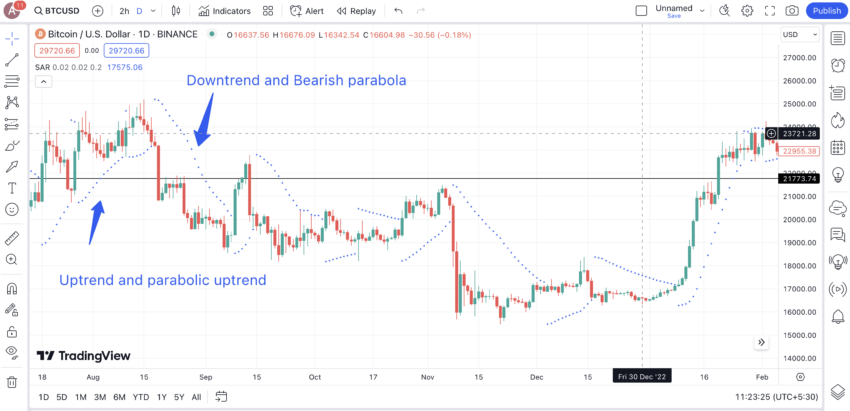
At first glance, the Parabolic Stop and Reverse indicator resembles a series of dots resembling parabolas. These series of dots are placed incrementally or progressively, depending on the price trend. It is important to understand that when the price is moving up or is a part of the bullish trend, the dots are placed under the price candles. However, for a bearish trend or when the price is on its way down, the series of dots are placed above the price candles.
From a visual perspective, the series of dots in an uptrend looks a lot like the rising escalator steps. The ones relevant to the downtrend, placed above the price candles, look a lot like the step of a descending staircase.
As for the concept, the parabolic SAR indicator aims to converge with the asset’s price. For instance, in an uptrend where the series of dots is below the price, more like a bullish parabola or a parabolic uptrend that opens upwards, the tendency of the SAR would be to flatline over time, showing weakening momentum and a trend reversal.
The reverse happens in the case of a down-trending price action, where we experience something called the bearish parabola. Do note that while the bullish parabola or the parabolic uptrend assumes the shape of the letter “U,” the bearish parabola does the same but inverted.
Once any of the parabolas touch the price or the price crosses the same, like a parabolic breakout, in a specific direction, the SAR flips, hinting at a trend reversal.
“When Parabolic SAR prints five dots in the opposite direction of the major trend (W), be it a Bull market or a Bear market, this marks the end of it.
=> According to SAR #BTC bear market is over.”
Titan of Crypto (Washigorira), crypto influencer: Twitter
Exploring the technical elements of Parabolic SAR
As mentioned earlier, parabolic stop and reverse comprise the acceleration factor (AF) and the extreme point as two crucial technical elements. Here is how they work:
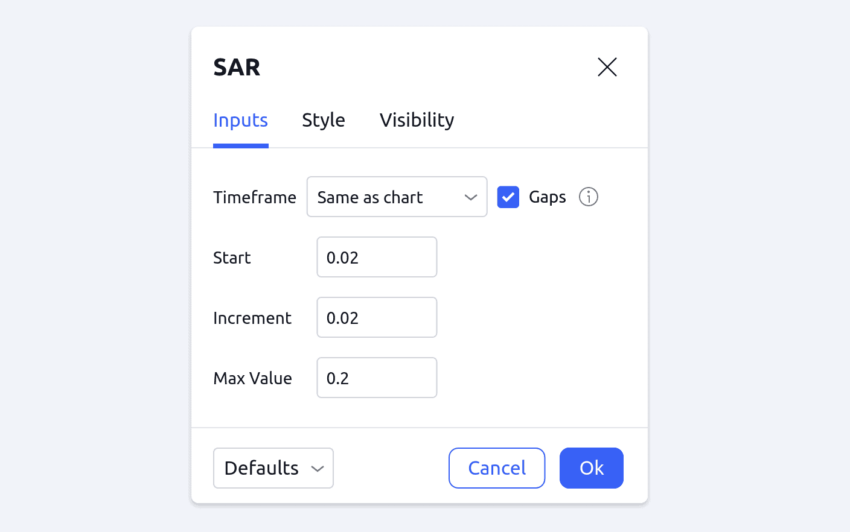
The acceleration factor determines where the next dot of the bullish or the bearish parabola forms. While the default value of the factor is 0.02, it can go as high as 0.20 as the price makes newer highs or newer lows. The idea is that with newer highs or newer lows, the price action is one step closer to saturation. And as the acceleration factor surges, transforming into maximum acceleration at one point, the bullish or the bearish parabola becomes steeper and closer to the price. This is what hints at a reversal.
In the cryptocurrency market, it is possible for the acceleration factor to rise quickly, with maximum acceleration being reached quicker due to the more volatile price swings. However, you should be aware of the false signals associated with rapid price moves, especially in the case of crypto trading.
The extreme point refers to the maximum price levels, high or low, that the asset assumes post the last SAR flipping. Also, when the SAR indicator flips, courtesy of a parabolic breakout, it takes the last extreme point into consideration for the SAR formation. Another way of looking at the extreme point or EP is to consider it the furthest point in a given trend. Also, if new EPs start forming, you can expect the acceleration factor to increase — something that makes the most sense in the case of crypto trading.
Calculations involved
For the more inquisitive folks, here is how the concept of EP and AF fit into the realm of Parabolic SAR calculations:
- In an uptrend, SARn+1 = SARn + AF * (EP – SARn)
- In a downtrend, SARn+1 = SARn – AF * (SARn – EP)
This is when:
- SARn+1 is the next period’s SAR value,
- SARn is the current period’s SAR value,
- AF stands for the acceleration factor, and
- EP identifies as the extreme point.
Do note that a standard trader only needs to interpret the dots and their positioning. The formula and the technical elements are mainly discussed to understand the finer operational mechanics of Parabolic SAR.
Parabolic SAR for crypto trading: different strategies
Now that we know the concepts in technical trading let us take this understanding further and plan crypto trades using the Parabolic stop and reverse indicator.
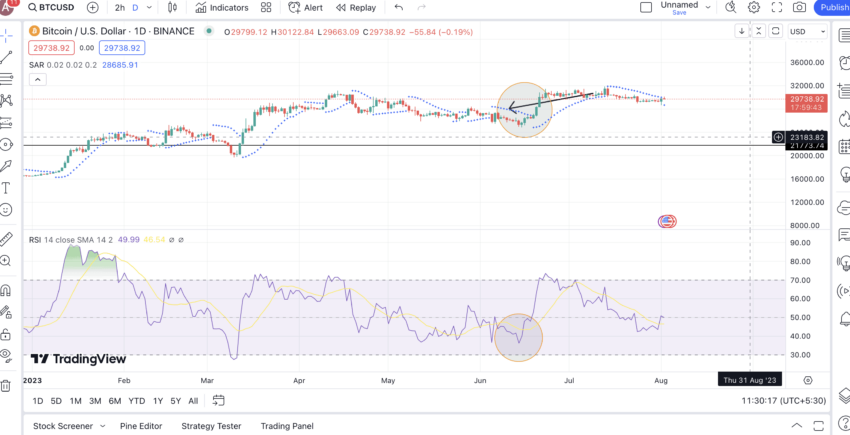
A recent example of how SAR helped with bitcoin trading:
But first, let us take a closer look at the versions of the same:
/Related
More Articles


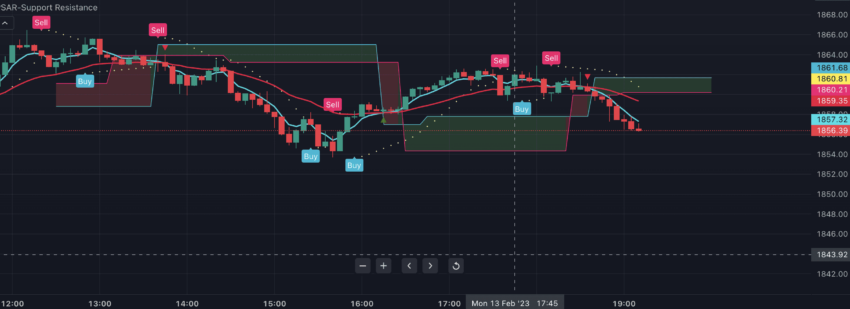
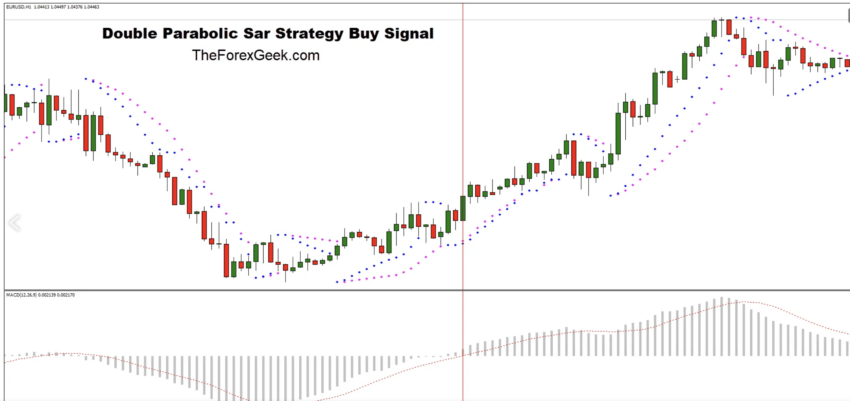
Buy and sell signals
If you are new to trading, you might want to use Parabolic SAR to locate quick buy and sell signals. The buy signals are relatively obvious if the SAR series of dots flip from a bearish parabola (above the price) to a bullish parabola (below the price).
Entry and exit points determined using SAR:
The inverse of this concept applies to detecting the sell signals, where you should look for a flip from bullish to bearish. For sell signals, you can consider shorting the asset while using the same concept of the falling knife — for identifying sharper and sustained dips.
The 2 Parabolic SAR strategy
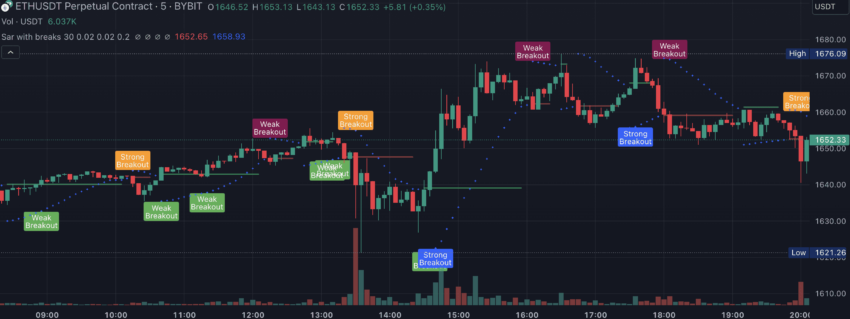
The 2 Parabolic SAR strategy is an advanced variation of the standard strategy, where two SAR indicators with different acceleration factors are used. The idea behind the 2 Parabolic SAR strategy is to have indicators with different settings — one optimized for frequent short-term trading and the other suitable for long-term conservative trading.
This approach helps reduce the false signs that are associated with a false parabolic breakout.
Using parabolic SAR for bitcoin or crypto trading: advanced strategies discussed
Even though using parabolic SAR for bitcoin trading might feel like using it for any other asset class, consider the higher volatility, round-the-clock trading markets, and other aspects before using the trend-following indicator.
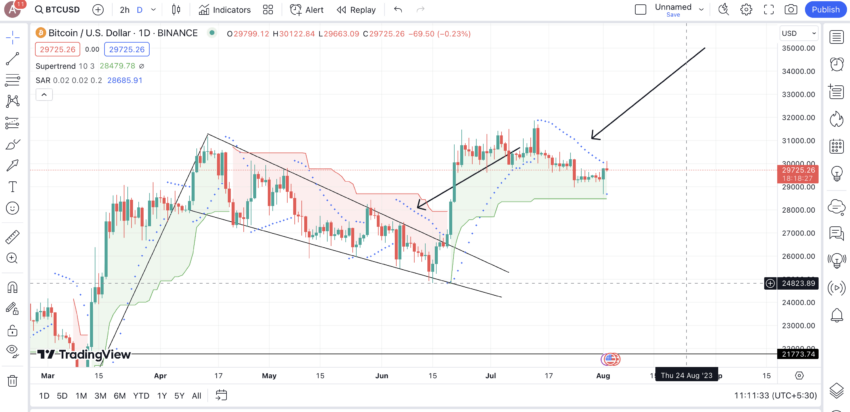
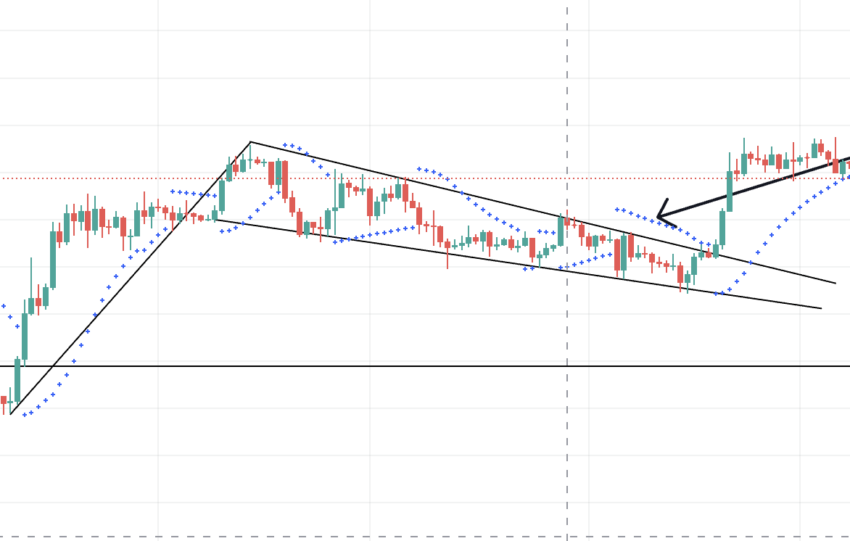
An example of how SAR flipping hints at crypto trading possibilities:
As far as trading strategies go, we can try out the following:
Strategy 1: The trailing stop-loss approach
Using the bearish and bullish parabolas as trailing stop losses for riding the downtrend and uptrend. Here is how it works:
If the price is on an uptrend and the parabolic SAR is charted below the price, you can place a price exit or a stop-loss by drawing a support line on the SAR series of dots. This way, you can maximize profits and even minimize losses. In case you plan on shorting BTC, you can consider a down trending price action and the SAR line charted above the price. The resistance line drawn on the SAR can help you locate the trailing stop loss for your short order.
You can adjust your stop loss periodically, depending on how the SAR relative to your price action keeps moving.
Strategy 2: The crossover approach
This is a fairly simple approach you can follow for trading bitcoin in trending markets. The moment the price crosses touches or crosses under the bullish or low-lying SAR indicator, you might want to exit or even place a sell order as the parabolic SAR indicator might flip to the other side. The same theory holds even for trading the bearish parabola, crossing which might lead to an uptrend.
Strategy 3: The SAR-VWAP combo
The volume-weighted average price line is a pretty reliable indicator to capture short-term price surges and drops. However, if you are willing to use the parabolic SAR for smaller, VWAP-conducive timeframes like the 1-minute or the 5-minute timeframes, you can get some reliable signals.
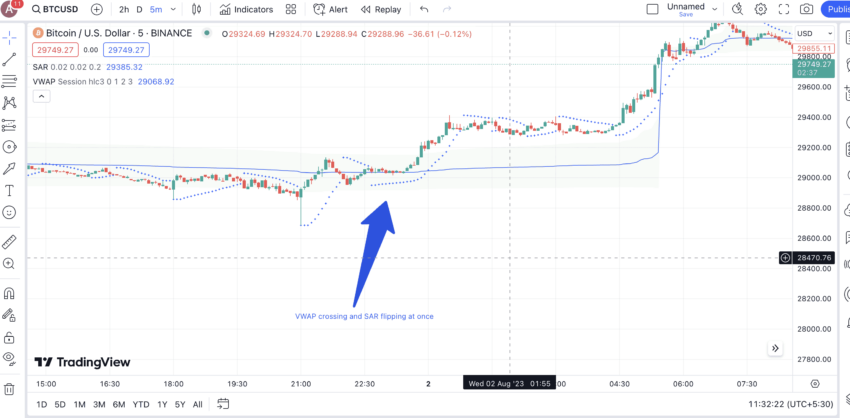
For buy signals, you might consider the zone when the SAR flips below the price and the price moves above the VWAP line. Another indication to look at is a retracement at the VWAP line, which would then act as a confirmation.
For a sell signal, the SAR indicator placed above the price and the price itself dropping below the VWAP can be reliable indicators.
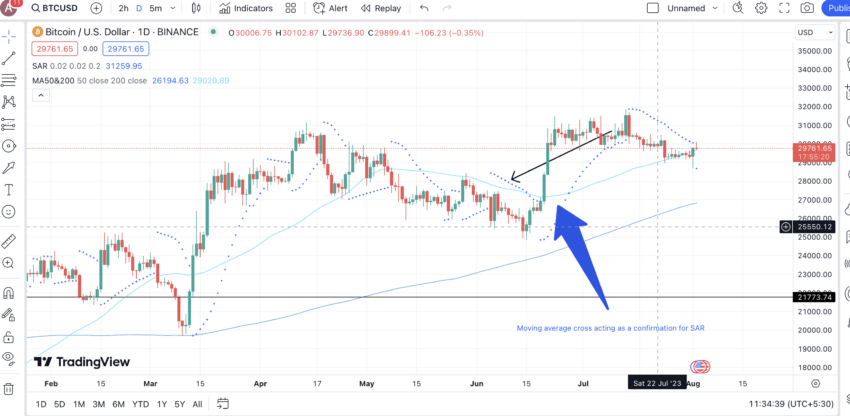
Strategy 4: Using SAR with moving averages
You can use the parabolic SAR indicator with moving averages, with trade signals surfacing when the price moves above the specific moving average line and is confirmed by a bullish parabolic flip. If you want to use a moving average, the 200-day MA is a good option for the longer timeframe. However, you can play around with the choice of MA depending on your trading goals and the choice of timeframe.
Strategy 5: Using SAR with Relative Strength Index (RSI)
Confirming the SAR flipping and a crypto trading signal using the Relative strength index (RSI) is also an option. For that, you must ensure that an oversold RSI value — say 30 — complements a bullish flip. For sell signals, you should look for an overbought RSI value — say anywhere between 70 and 80 — to complement the bearish flip.
If you are well-versed in price analysis, you can even look for bullish and bearish RSI divergences with the price action to confirm trade signals.
Strategy 6: Using parabolic SAR with ADX
The average directional index (ADX) indicator can also complement the SAR. For a buy signal, you must check if the ADX at the given point is above 25 or not, signaling a strong trend. In addition to that, you can check for a continuing bullish parabola — below the price or a recent flip in the Parabolic SAR value from above the price to below.
Strategy 7: Dual time-frame SAR strategy
This strategy involves using two different timeframes to confirm the bullishness or bearishness of the trades. For instance, you use the SAR indicator on a 15-minute timeframe for a quick trade but only go ahead if the SAR or, rather, the series of dots relevant to the daily timeframe also indicates bullishness.
Using SAR with multiple indicators:
Parabolic SAR and supertrend: a powerful combination
If you want highly reliable crypto trading signals, consider pairing the parabolic SAR and the supertrend indicator together. As both are trend-following resources, tracking these together to locate the next trade can be much more reliable.
As for the new entrant to the discussion, Supertrend is good at recognizing market trends. Also, it does share some similarities with the SAR, as it is also plotted on the chart directly. As for the technicals, the supertrend indicator leverages ATR or the average true range indicator to track market volatility and hence, the value.
If the supertrend line is trading below the price, you can expect a bullish trend. And if it trades above the price, a bearish trend might be obvious.
Using SAR and supertrend together is easy. If you see a bullish parabola in the case of SAR, especially in trending markets, it is better to confirm the same using a bullish supertrend line that also trades below the price. If the supertrend and SAR formations are on the opposite side of each other, the trend might not be as strong.
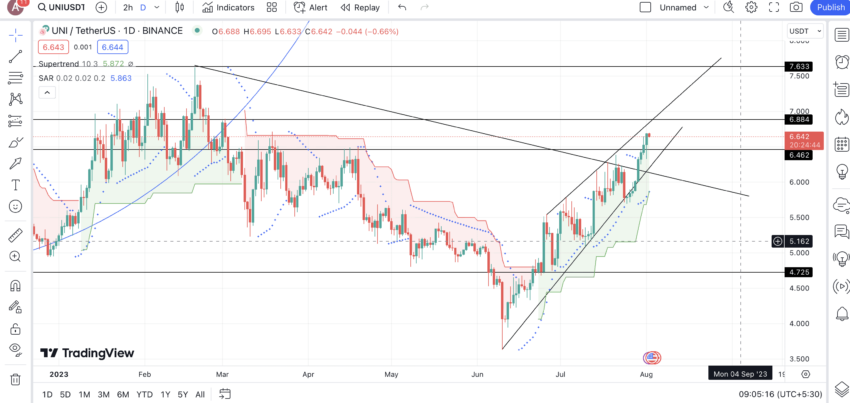
Here is the daily chart of Uniswap (UNI), where every trending bullish move is characterized by a bullish supertrend and a bullish parabolic SAR indicator working together.
Parabolic SAR in equity trading: how is it different from crypto?
Even though we can use parabolic SAR to trade equities and crypto, there are a few inherent differences between the two asset classes. These differences are in regard to the interpretation of the indicator.
Equity markets adhere to traditional hours, weekend shutdowns, and even overnight gaps. The market analysis isn’t continuous like crypto. This leads to occasional gap-up and gap-down scenarios, which might potentially deter the efficacy of the SAR indicator.
Here is an implementation of SAR in equity trading:
Also, in crypto, you find more aggressive trading patterns, making the concept of uptrend and downtrend more relevant. And we know that the parabolic SAR indicator is most suitable for trending markets.
Parabolic SAR in options trading
The best part about using the Parabolic SAR indicator is that you can deploy it for trading options — a type of non-obligatory derivatives contract. Here is how using SAR makes sense:
- Options traders buy “call” and “put” options, betting on price rise and price fall, respectively. Using the SAR indicator on a larger timeframe can help them identify the broader trend. This prepares you for derivatives trading scenarios that are time-specific.
- Traders can even play around with covered calls using the SAR. The idea with covered calls is to own and keep an asset and then sell call options relevant to it. However, suppose you sell call options in a highly trending market where the price rises considerably. In that case, you just receive the premium and not the overall gains, as you are obligated to sell lower — at the strike price. Parabolic SAR, therefore, identifies very minute trends and surges for you that do not translate into high gains.
- In options trading, you can use something called the Straddle Strategy to hedge losses. This involves buying call and put options at the same strike. The way you end up moving is determined by the side on which the SAR indicator resides.
And that sums up our detailed trading plans relevant to the Parabolic SAR indicator.
Dealing with false signals in crypto trading
Even though the Parabolic SAR is a reliable indicator, it can still lead to false signals in the following scenarios:
- In markets that aren’t trending and are trading sideways
- During whipsaws or trading phases where the asset moves rapidly in different directions without riding a specific trend.
- In the equity space where it is common to encounter a sideways market due to low volatility and underwhelming trading volumes.
And if you are weary about these false signals, here are the things to do:
- Pair additional indicators
- Set clear stop losses
- Understand the context and the broader market breadth
- Wait for clear confirmations using support and resistance lines
Regardless of what you do, a clear risk management strategy is necessary, with control over emotions.
“Outstanding knowledge of technical analysis, indicators and global macro fundamentals contribute very little toward trading profitability.
Knowledge of self and the ways our emotions sabotage us at every turn – this is the beginning of profitable market speculation. Know thyself”
Peter Brandt, author of Trading Commodity Futures: Twitter
Is Parabolic SAR a good indicator?
The Parabolic SAR indicator is a powerful trading tool. However, whether it is a good indicator or not depends on how you use it. Here are the hits and misses that you should be aware of before using:
Strengths
- Helps with Stop and Reverse trend discovery
- User-friendly
- Works well with additional indicators
- A short-term frame SAR can even help locate arbitrage trading opportunities by quickly identifying surges.
- It can help with grid trading by letting you determine direction and size positions based on the trend strength.
Weaknesses
- It might give out false signals.
- As it is a lagging indicator, it might not be best for long-term price prediction.
- Limited functionality
What is the best SAR strategy?
The best SAR strategy depends on what you want from the trades. Also other factors, such as your risk tolerance level and even what timeframe you are considering, also come into play. Yet, if we’re to generalize trading strategies, here are the best SAR crypto trading strategies around:
- Using SAR as a standard trend-following indicator by checking for the flips.
- Pairing SAR with moving averages as MAs can help you decode a wide range of signals. This includes looking at death and golden crossovers as additional confirmations.
- Using SAR as the trailing stop loss for buy and sell positions
Did you know? You can personalize your SAR trading strategy by playing around with the acceleration factor. For instance, if you want to catch longer trades and sustained trends, you can reduce the acceleration factor manually. This would make the indicator more conservative. It is more like playing around with the standard deviation in the case of Bollinger Bands.
Parabolic SAR: A one-stop solution or just part of the puzzle?
It’s clear that parabolic SAR is a powerful trend-following tool when it comes to technical analysis. However, unlike the relative strength index (RSI), average directional index (ADX), and other indicators that measure the speed and strength of trends, parabolic SAR keeps things minimal by simply identifying the direction. And we cannot stress enough that SAR is best used in trending markets. It might not be as effective when the cryptocurrency is trading sideways. Overall, the reliability of Parabolic SAR depends on the market conditions, trading preferences, and even the skill of active traders.
Frequently asked questions
What is the success rate of Parabolic SAR?
Is Parabolic SAR profitable?
What is the parabolic SAR method?
What are the disadvantages of parabolic SAR?
What is the difference between SAR and Supertrend?
What is the safest and most profitable options strategy?
Trusted
Disclaimer
In line with the Trust Project guidelines, the educational content on this website is offered in good faith and for general information purposes only. BeInCrypto prioritizes providing high-quality information, taking the time to research and create informative content for readers. While partners may reward the company with commissions for placements in articles, these commissions do not influence the unbiased, honest, and helpful content creation process. Any action taken by the reader based on this information is strictly at their own risk. Please note that our Terms and Conditions, Privacy Policy, and Disclaimers have been updated.


