


The Bollinger Bands indicator tracks price action based on volatility. Whether you are looking to gauge a trend following a sideways movement or are interested in taking advantage of a sudden price rise by trading breakouts, the ability to read Bollinger Bands is always beneficial. This guide will help you read and use Bollinger Bands in crypto trading.
KEY TAKEAWAYS
• Bollinger Bands are an indicator to help identify market volatility.
• By using three bands (upper, middle, and lower), you can identify overbought and oversold conditions.
• Patterns like Bollinger Bounce and Bollinger Squeeze can signal potential reversals or breakouts.
• Combining Bollinger Bands with indicators like RSI and MACD can enhance accuracy.
- What are Bollinger Bands?
- How to use Bollinger Bands in crypto trading?
- What do Bollinger Bands tell you?
- Bollinger Bands formula and best settings
- What is the strategy for Bollinger Bands? Using it as a standalone tool
- Bollinger Bands and candlesticks
- Integrating Bollinger Bands with other indicators
- Can you win crypto trades with Bollinger Bands?
- Frequently asked questions
What are Bollinger Bands?
Bollinger Bands is a technical analysis tool for tracking expected price movements based on market volatility. Even though the name mentions “Bands,” which is plural, all of them work in cohesion to make this an all-inclusive, singular indicator.
Unpacking this indicator
Before we get to the trading strategies using Bollinger Bands, let us look at what they tell you and how they work in general. Bollinger Bands, per the name, is a band-focused trading indicator with three lines. These are upper, middle, and lower lines or rather bands.
Developed by John Bollinger, you can use it to trade a wide range of high-beta assets, including cryptocurrencies. You can think of the upper band as the roof and the lower band as the floor.
“Bollinger Bands define high and low on a relative basis. By definition, prices are high at the upper band and low at the lower band.”
John Bollinger: inventor of Bollinger Bands: Twitter
Even though Bollinger Bands was developed by John Bollinger in the 1980s, they continue to be one of the most effective and go-to trading strategies for seasoned traders, even in 2026.
Explaining the Three bands
The upper band quite appropriately identifies with the higher range of trading. In a range-bound market, the upper line or band is also termed a resistance line. In a trending market, the price of a cryptocurrency crossing above the upper Bollinger band might hint at a trend reversal. This is assuming that the nature of the market turns overbought.
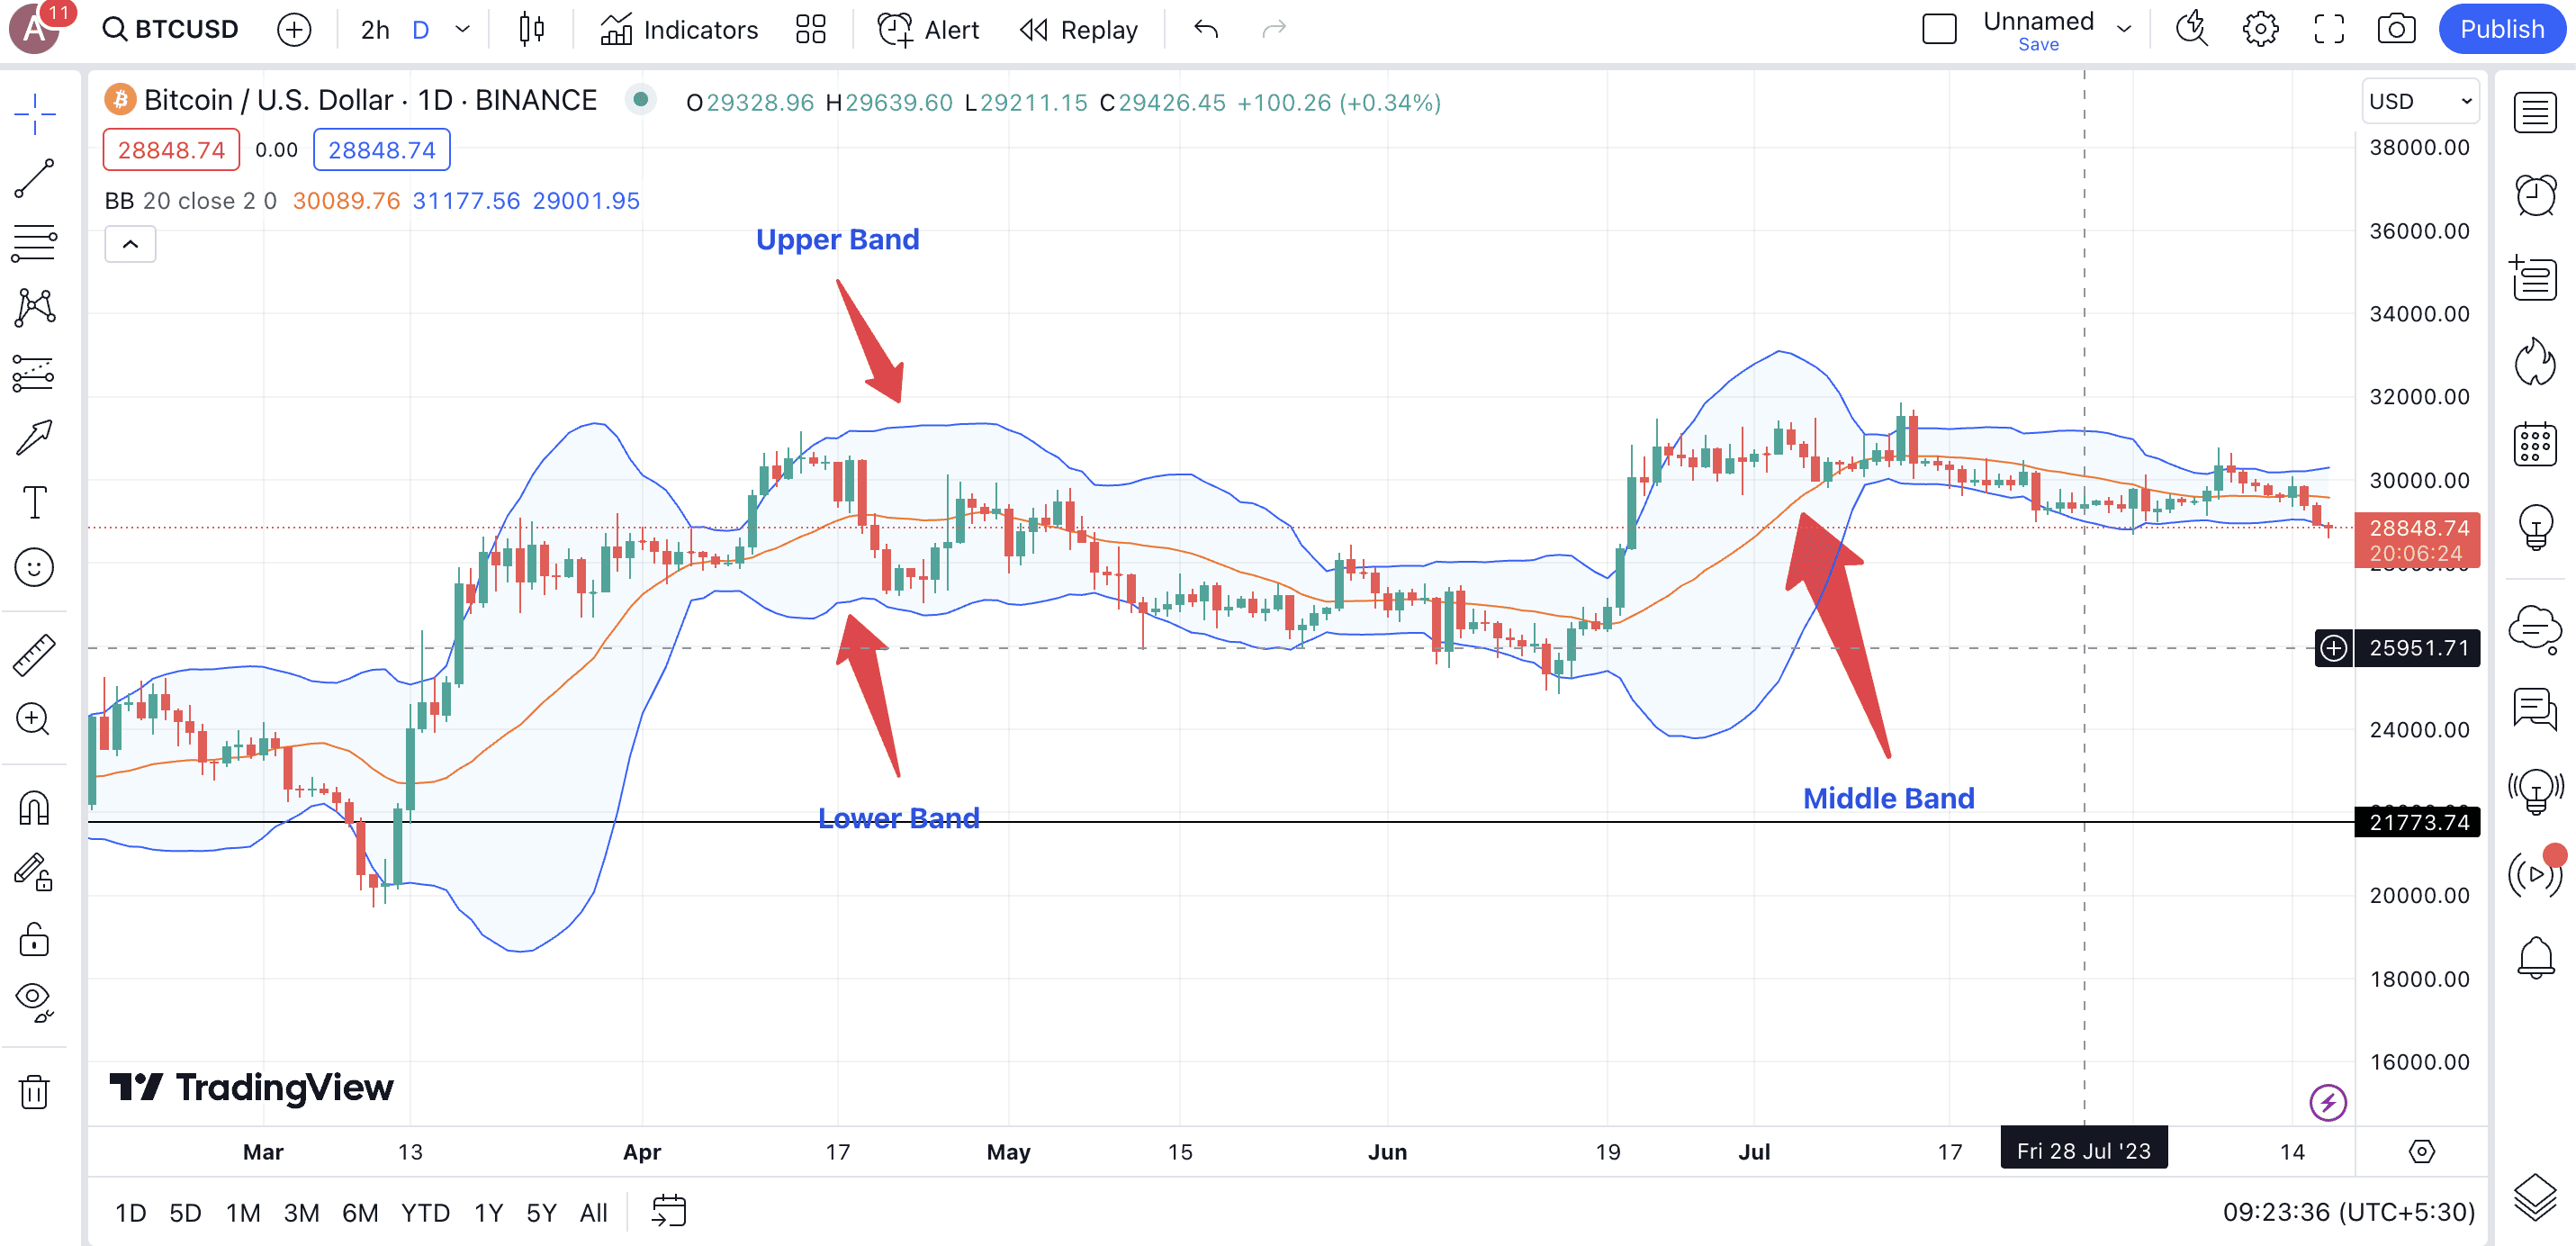
The lower band is everything the upper band is but in reverse. It acts as a support band. An asset crossing lower is considered to be in the oversold territory. The middle line or band is the 20-day Simple Moving average (SMA) of the prices.
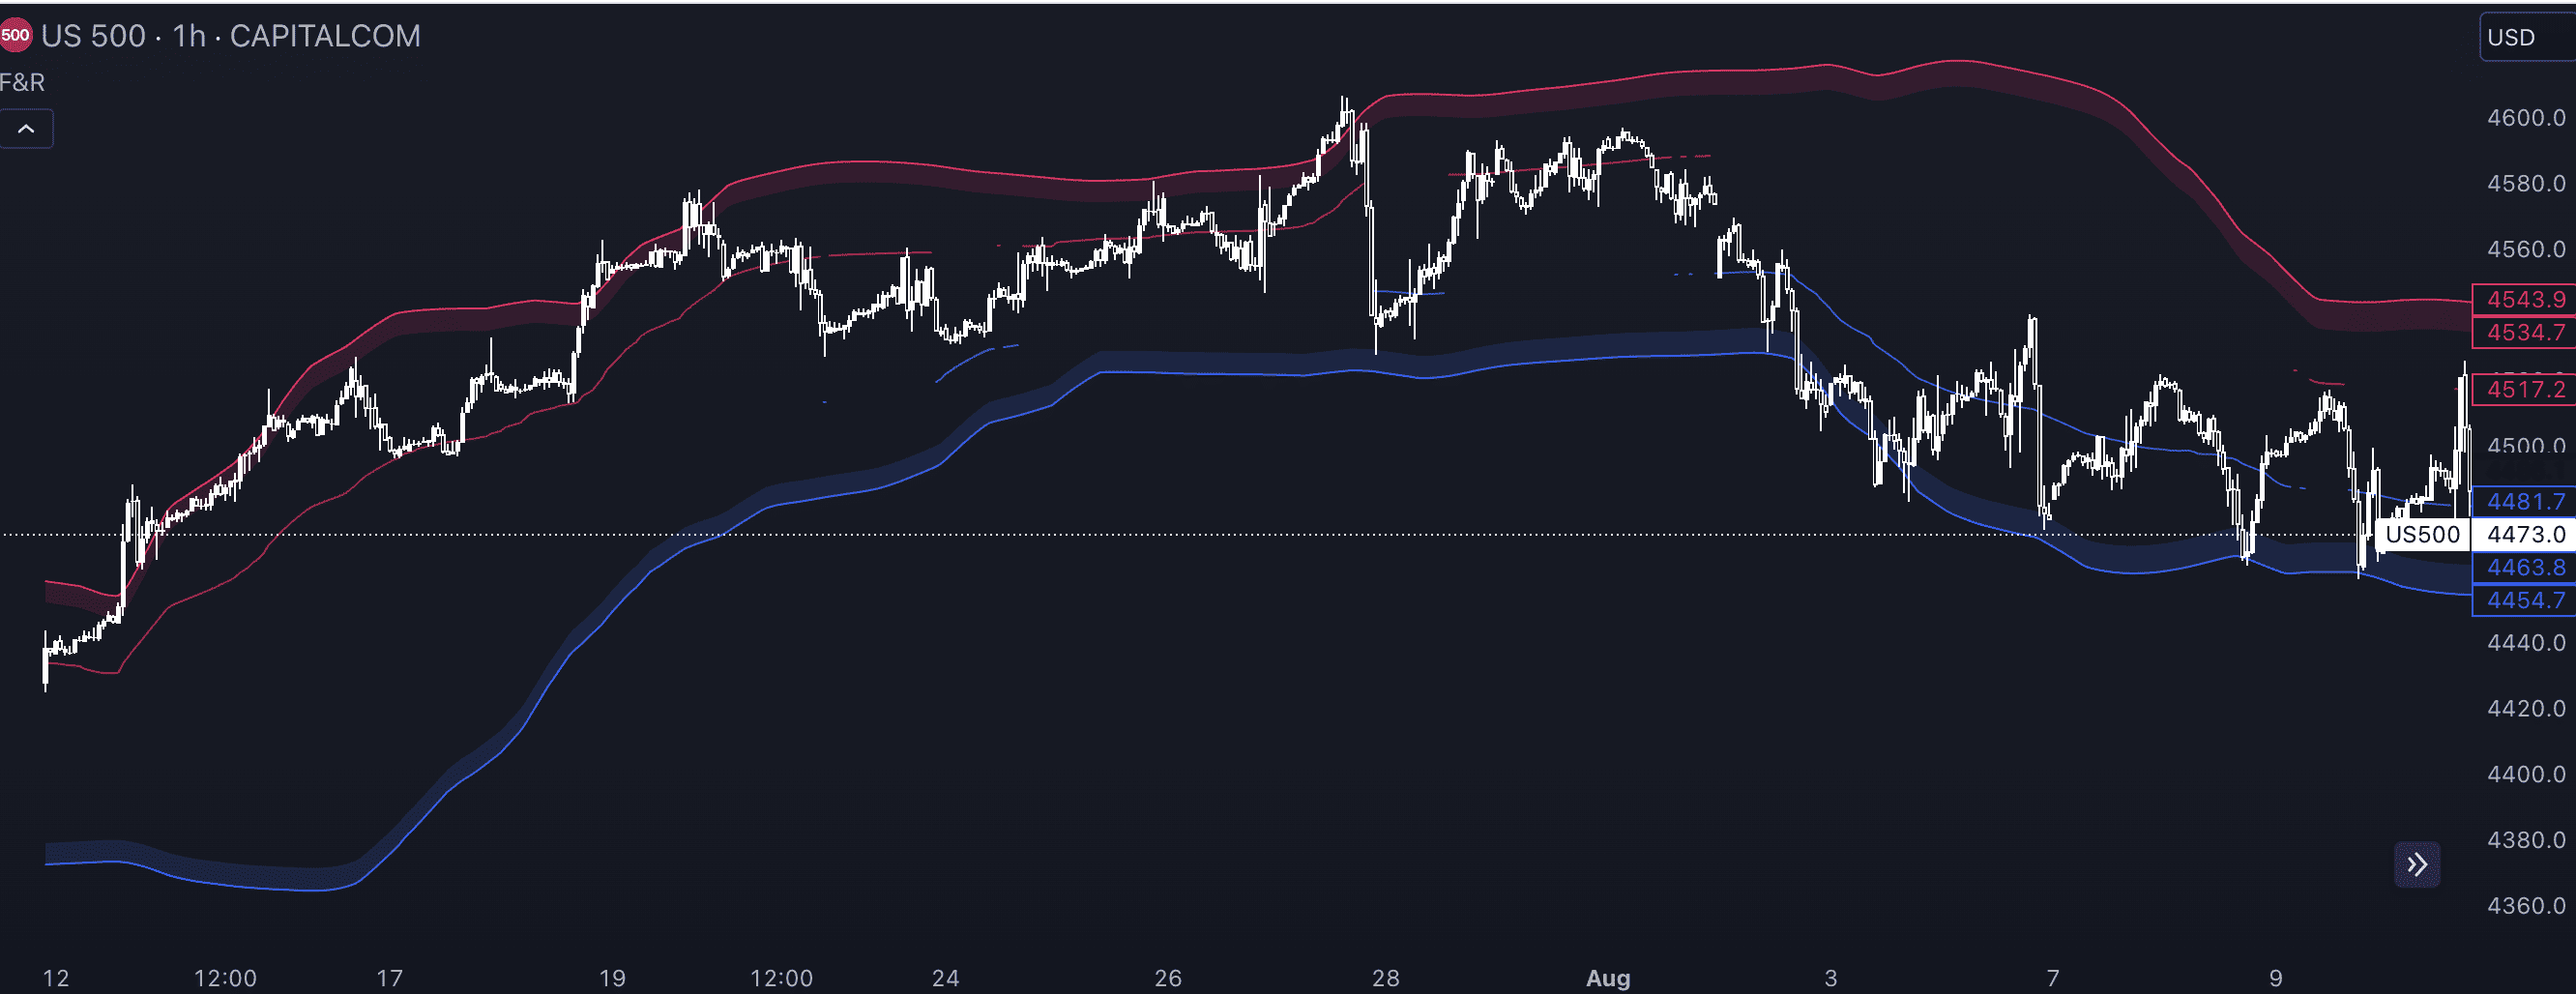
The upper and lower bands are usually charted two standard deviations away from the SMA or the middle line. And while the upper and lower bands show price extremes, the price following the middle band corresponds to it trading in a neutral range for the time being. The Upper-Lower narrative for trading Bitcoin is as follows:
These bands, in unison, encapsulate any crypto’s price movement. Analyzing the price movements in relation to Bollinger Bands can help trade reversals, price surges, falling knife dips, and other aspects of trading.
The concept of standard deviation
The width of the bands — the distance between the upper/lower and the middle band determines the extent of volatility across the market. For the unversed, standard deviations are statistical estimates reflecting the extent of dispersion in data points! When it comes to the indicator, the deviation measures volatility and the default setting is two.
The two-standard deviation mark is what most traders go with. It covers 95% of the data points and offers a balanced view of the price action. This means when the price approaches the upper band for a possible correction or the lower band for a possible rise, the calculations strike the best balance between risk and reward.
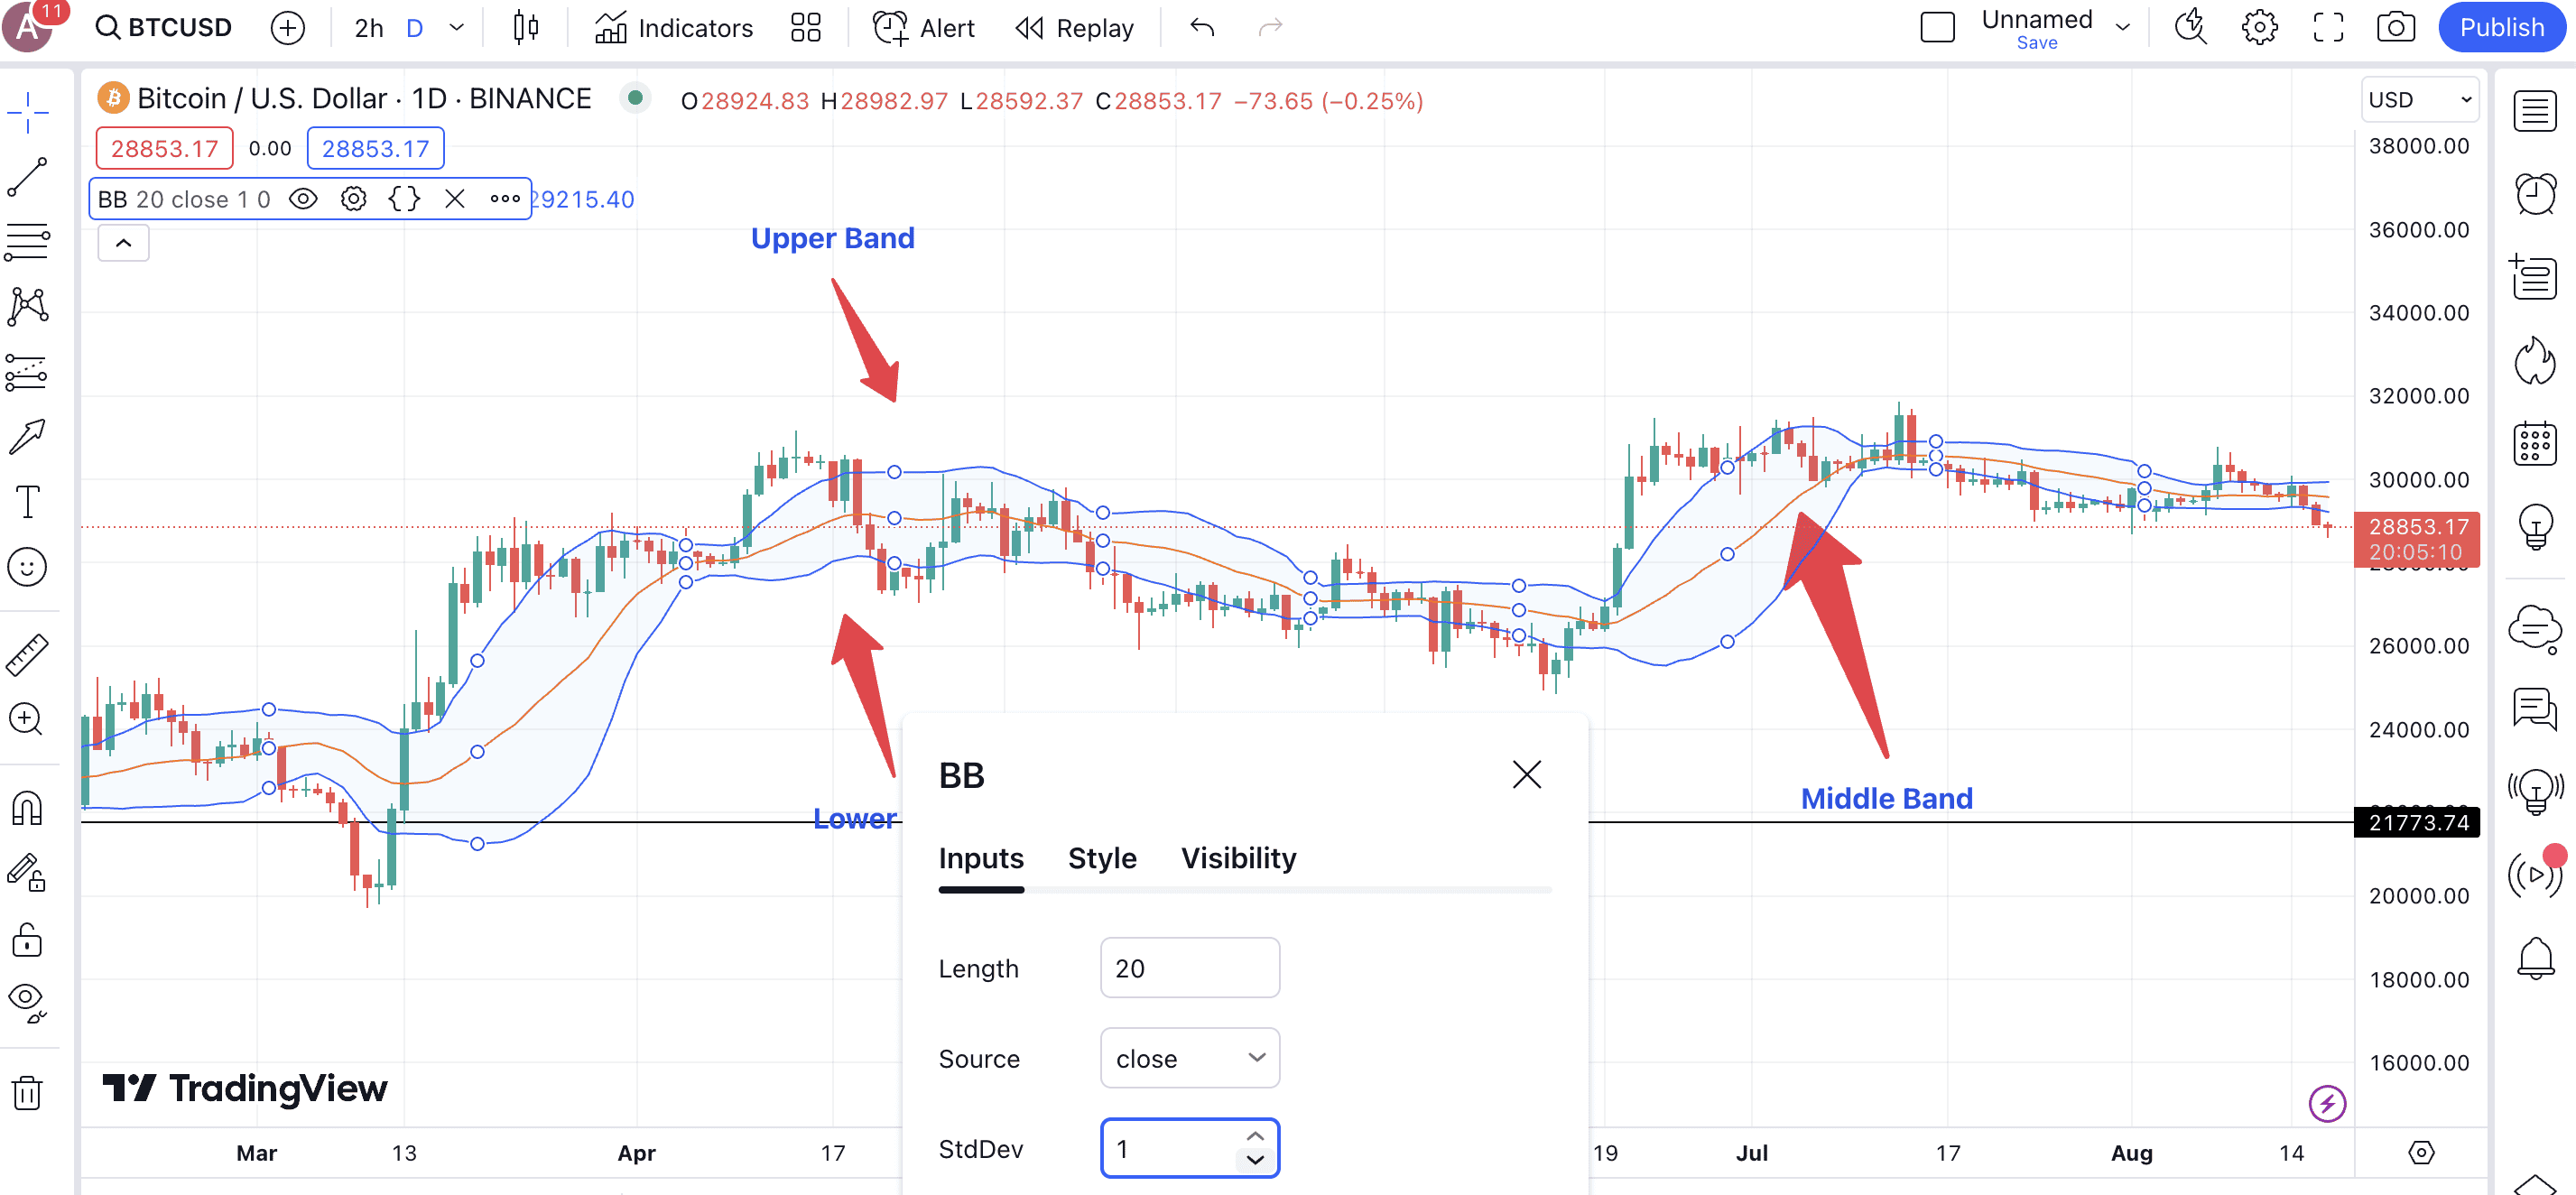
You can even open the settings in your choice of trading platform to change the standard deviation to either one or three. One, as expected, only covers 68% of the data points. This means the upper and lower bands per the one standard deviation setting would be closer to the middle band. As a result, you can expect several more signals as the prices will frequently touch the upper and lower bands based on market scenarios. Yet, more signals come for the sake of low reliability.
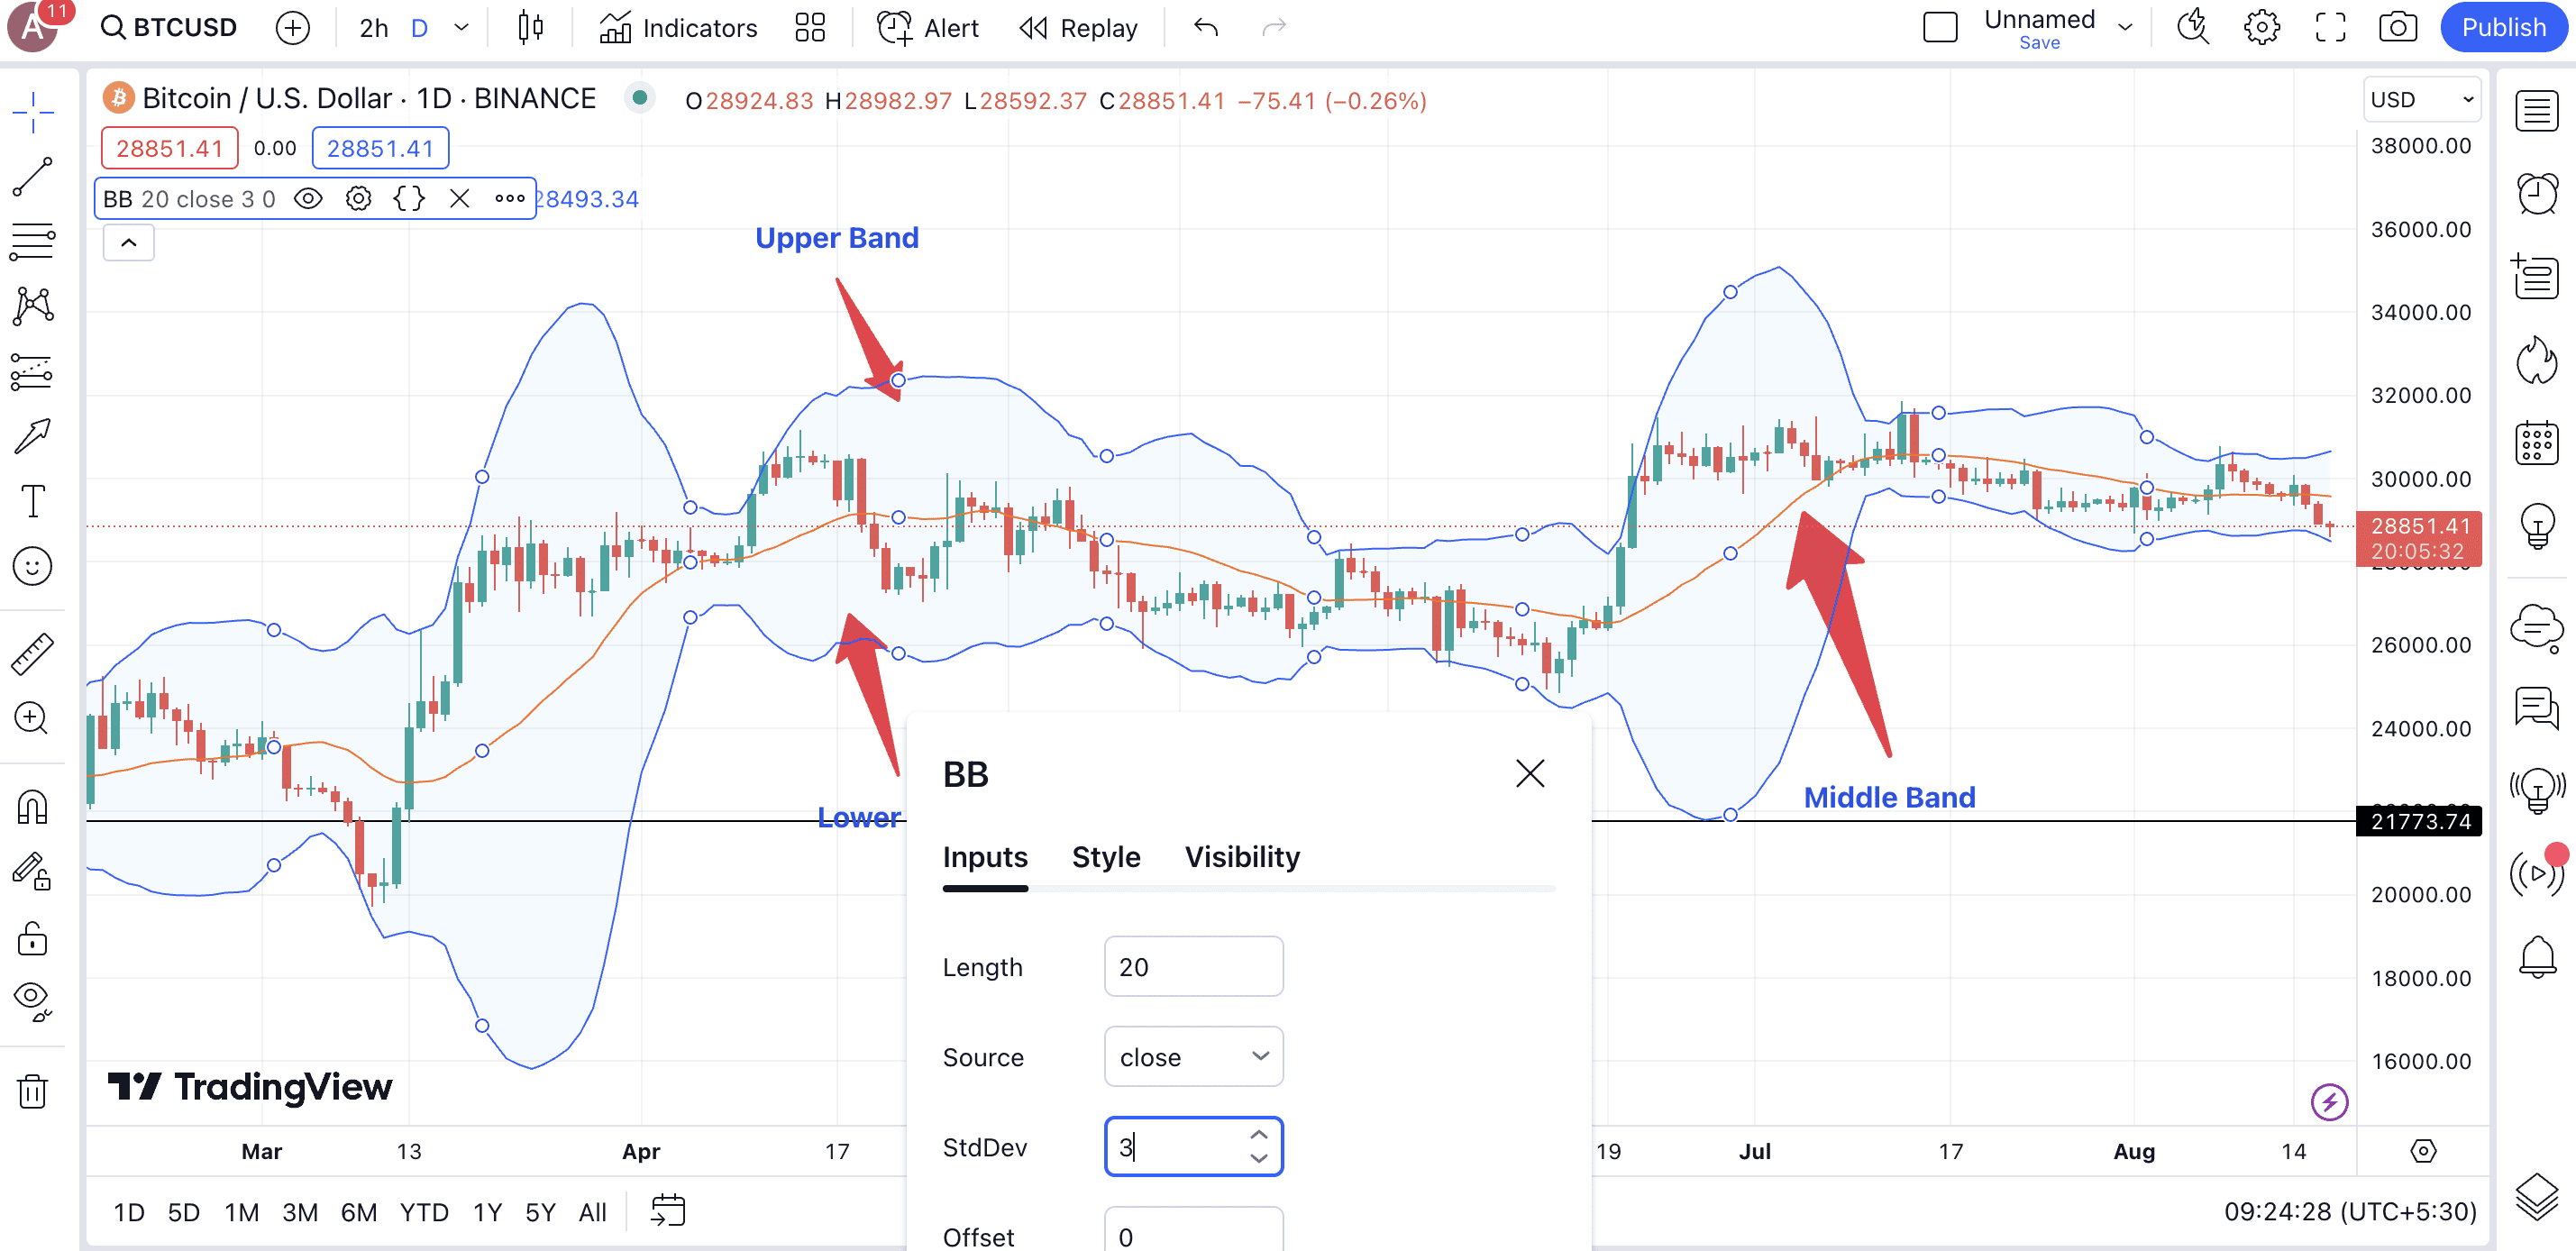
Choosing three as the standard deviation is for the more conservative trader. This approach covers 99% of the data points, and rarely would the prices touch the extreme bands. However, when they do, the results are expected to be much more reliable as they filter out most of the market noise.
You can choose the best settings for Bollinger Bands based on your needs. Here is a quick demo to understand the tool better:
How to use Bollinger Bands in crypto trading?
The best way to use Bollinger Bands is to use the indicator for day trading or swing trading. Here is a quick explanation:
- Understand the Bollinger Bands.
- Look for trade reversals when the price touches the upper or lower bands (Bollinger Bounce).
- Watch for a Bollinger Squeeze by identifying potential breakouts.
- Combine with other indicators like RSI or MACD to confirm Bollinger Band signals.
- Adjust Band settings as needed.
The idea here is to use the width of the bands or, rather, the bandwidth of the Bollinger Bands to analyze market conditions and then see how the prices move in relation to the bands. For a more detailed explanation, continue reading.
Elements to consider for crypto trading
Before we delve into the depths of crypto trading, let us understand the basic functions of the Bollinger Bands. Firstly, if you see large expanding bands, you can rest assured that the market is exploding in a certain direction. In that case, you are better off checking for corrections and surges, courtesy of the Bollinger Bounce phenomenon. Clubbing this approach with indicators like Parabolic SAR can even help determine trend reversals.
Secondly, if the bands are squeezed together, showing the market in consolidation, the indicator can hint at a potential breakout. However, trading breakouts using the Bollinger Bands indicator are based on luck unless you plan on using it with other crypto trading indicators.
While strategies leveraging Bollinger Bands can be used across a wide range of asset classes, it makes a lot of sense for crypto trading. The reason for that is simple — cryptocurrencies can showcase spurts of volatility, allowing users to ride trends per the risk tolerance. Also, once squeezes are encountered, the breakouts are usually rewarding, provided you can identify the right trend beforehand.
Another interesting aspect of a Bollinger Squeeze is that a prolonged period of band constriction should be viewed in relation to the volume. In a bullish market, such a phase corresponds to the bulls accumulating. Hence, there are a lot of ways to interpret the crypto signals offered by Bollinger Bands.
Let us take an example:
How to use Bollinger Bands for day trading?
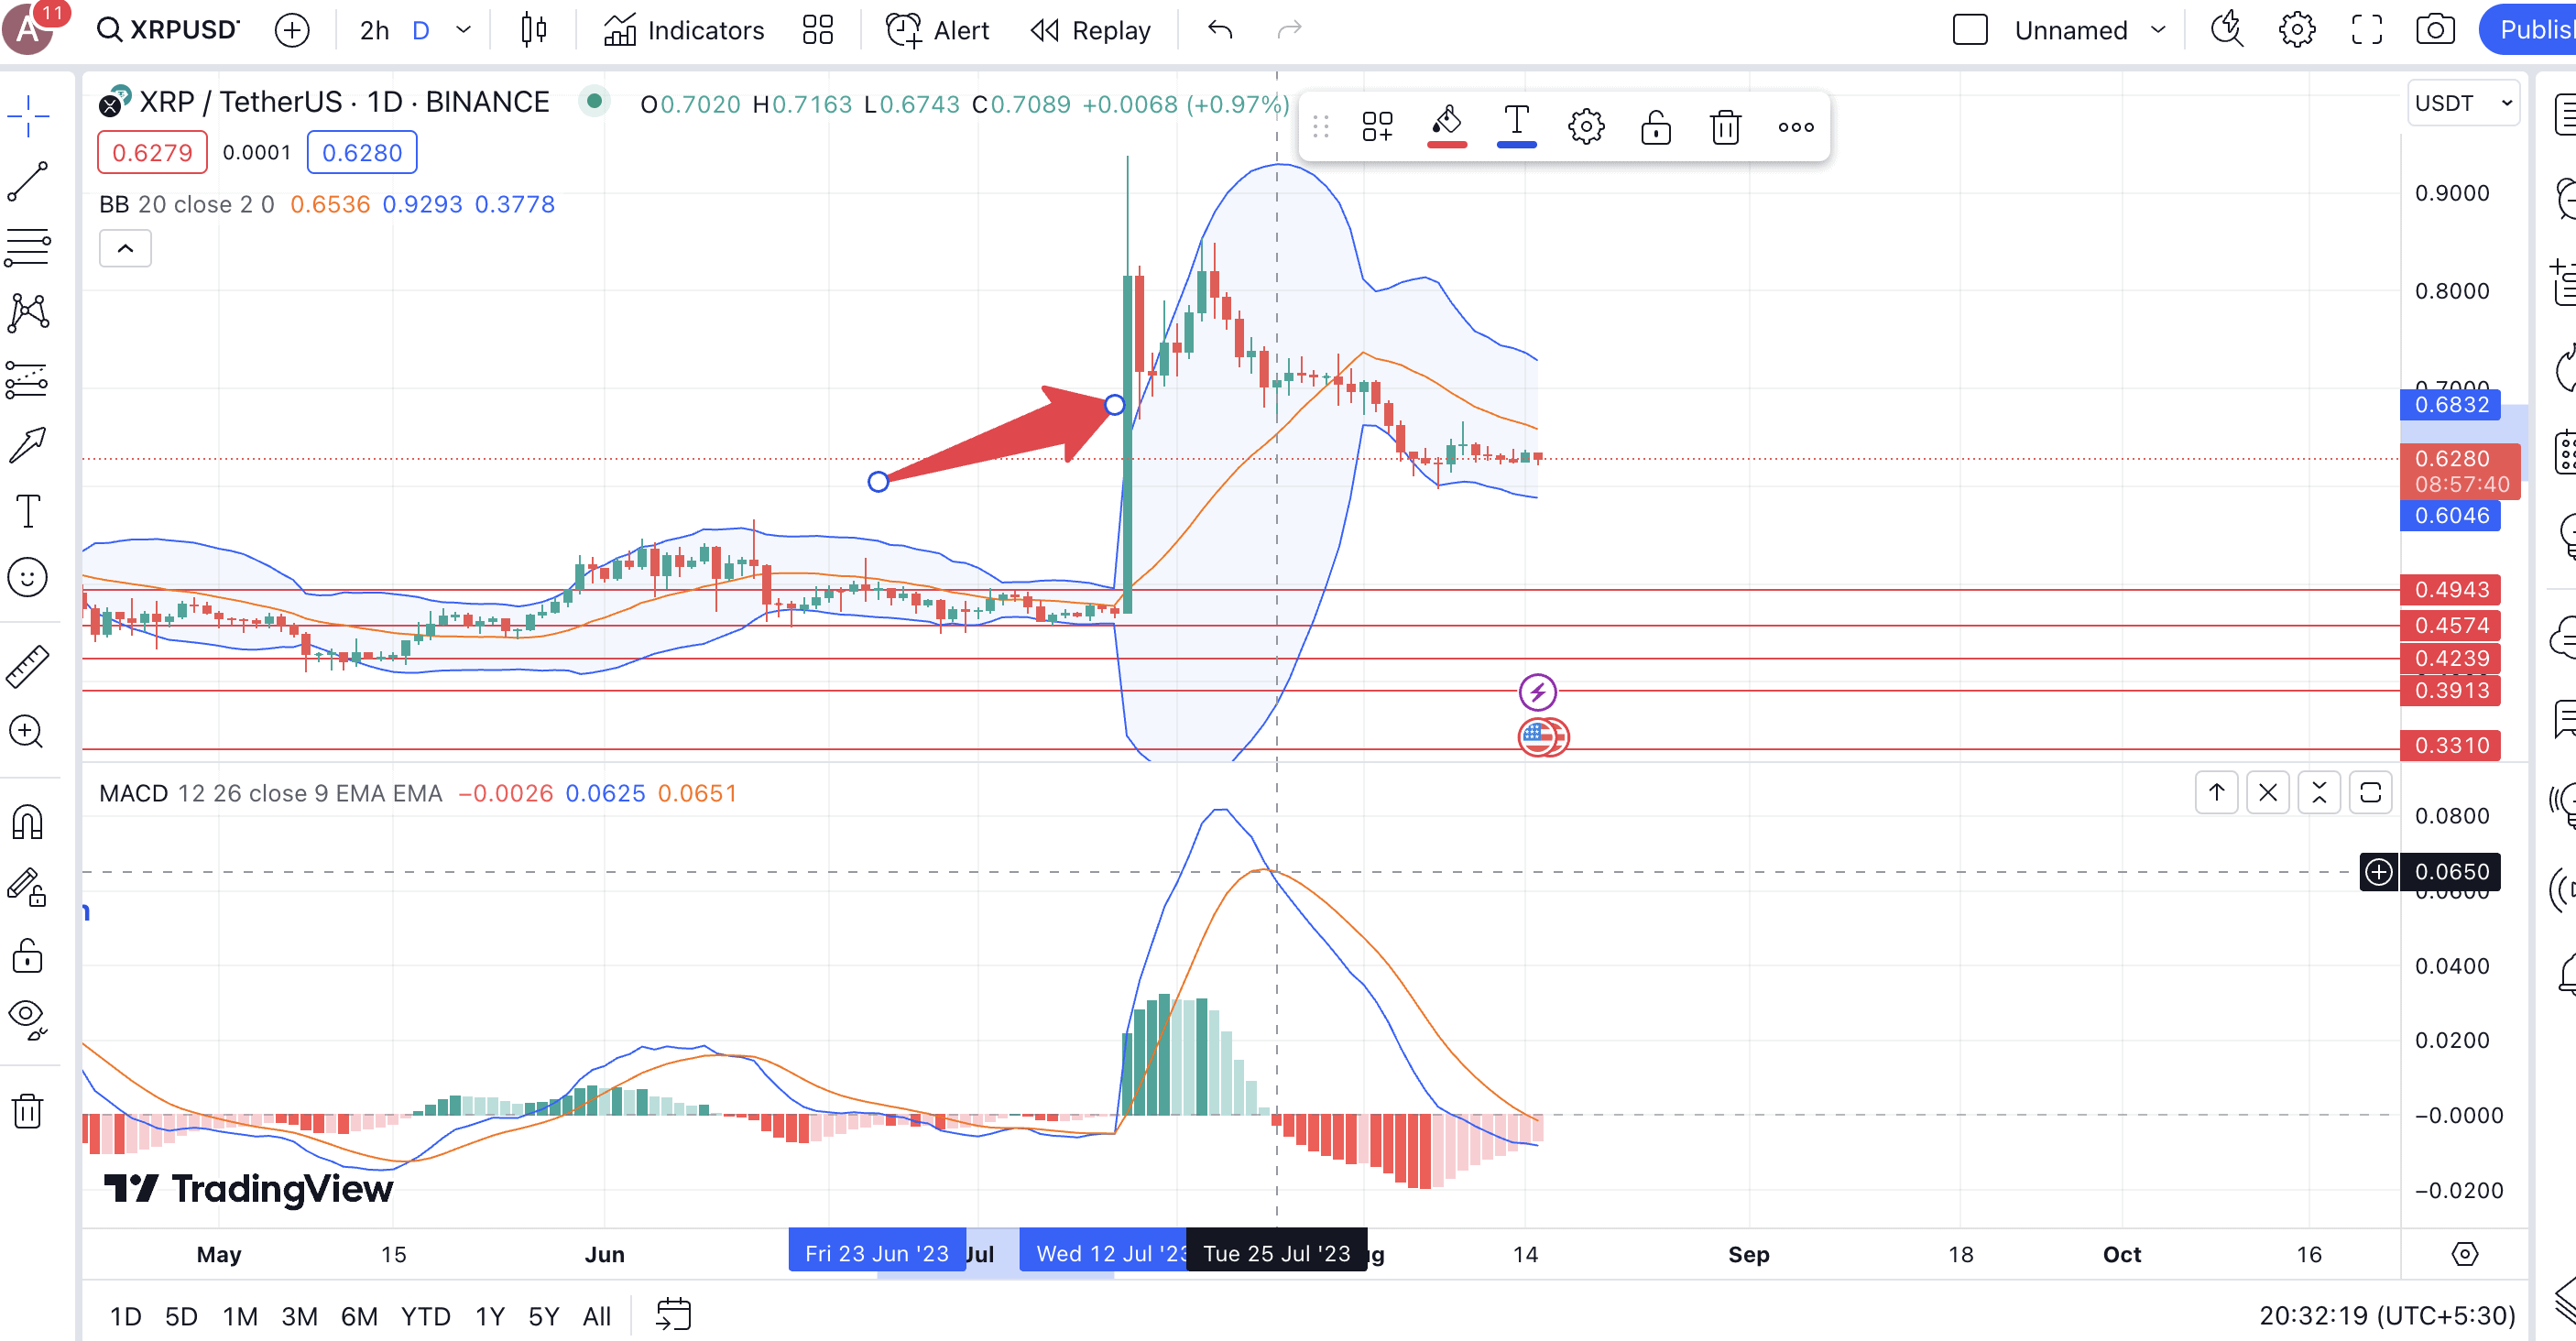
Let’s use day trading XRP as an example. If you look at XRP’s chart, the squeezing of Bollinger Bands led to a positive breakout.
It is worth noting that the first instance marked on the chart has a relatively extended period of consolidation. In this case, the confirmation of a breakout was given by the MACD indicator with the MACD line crossing above the signal line.
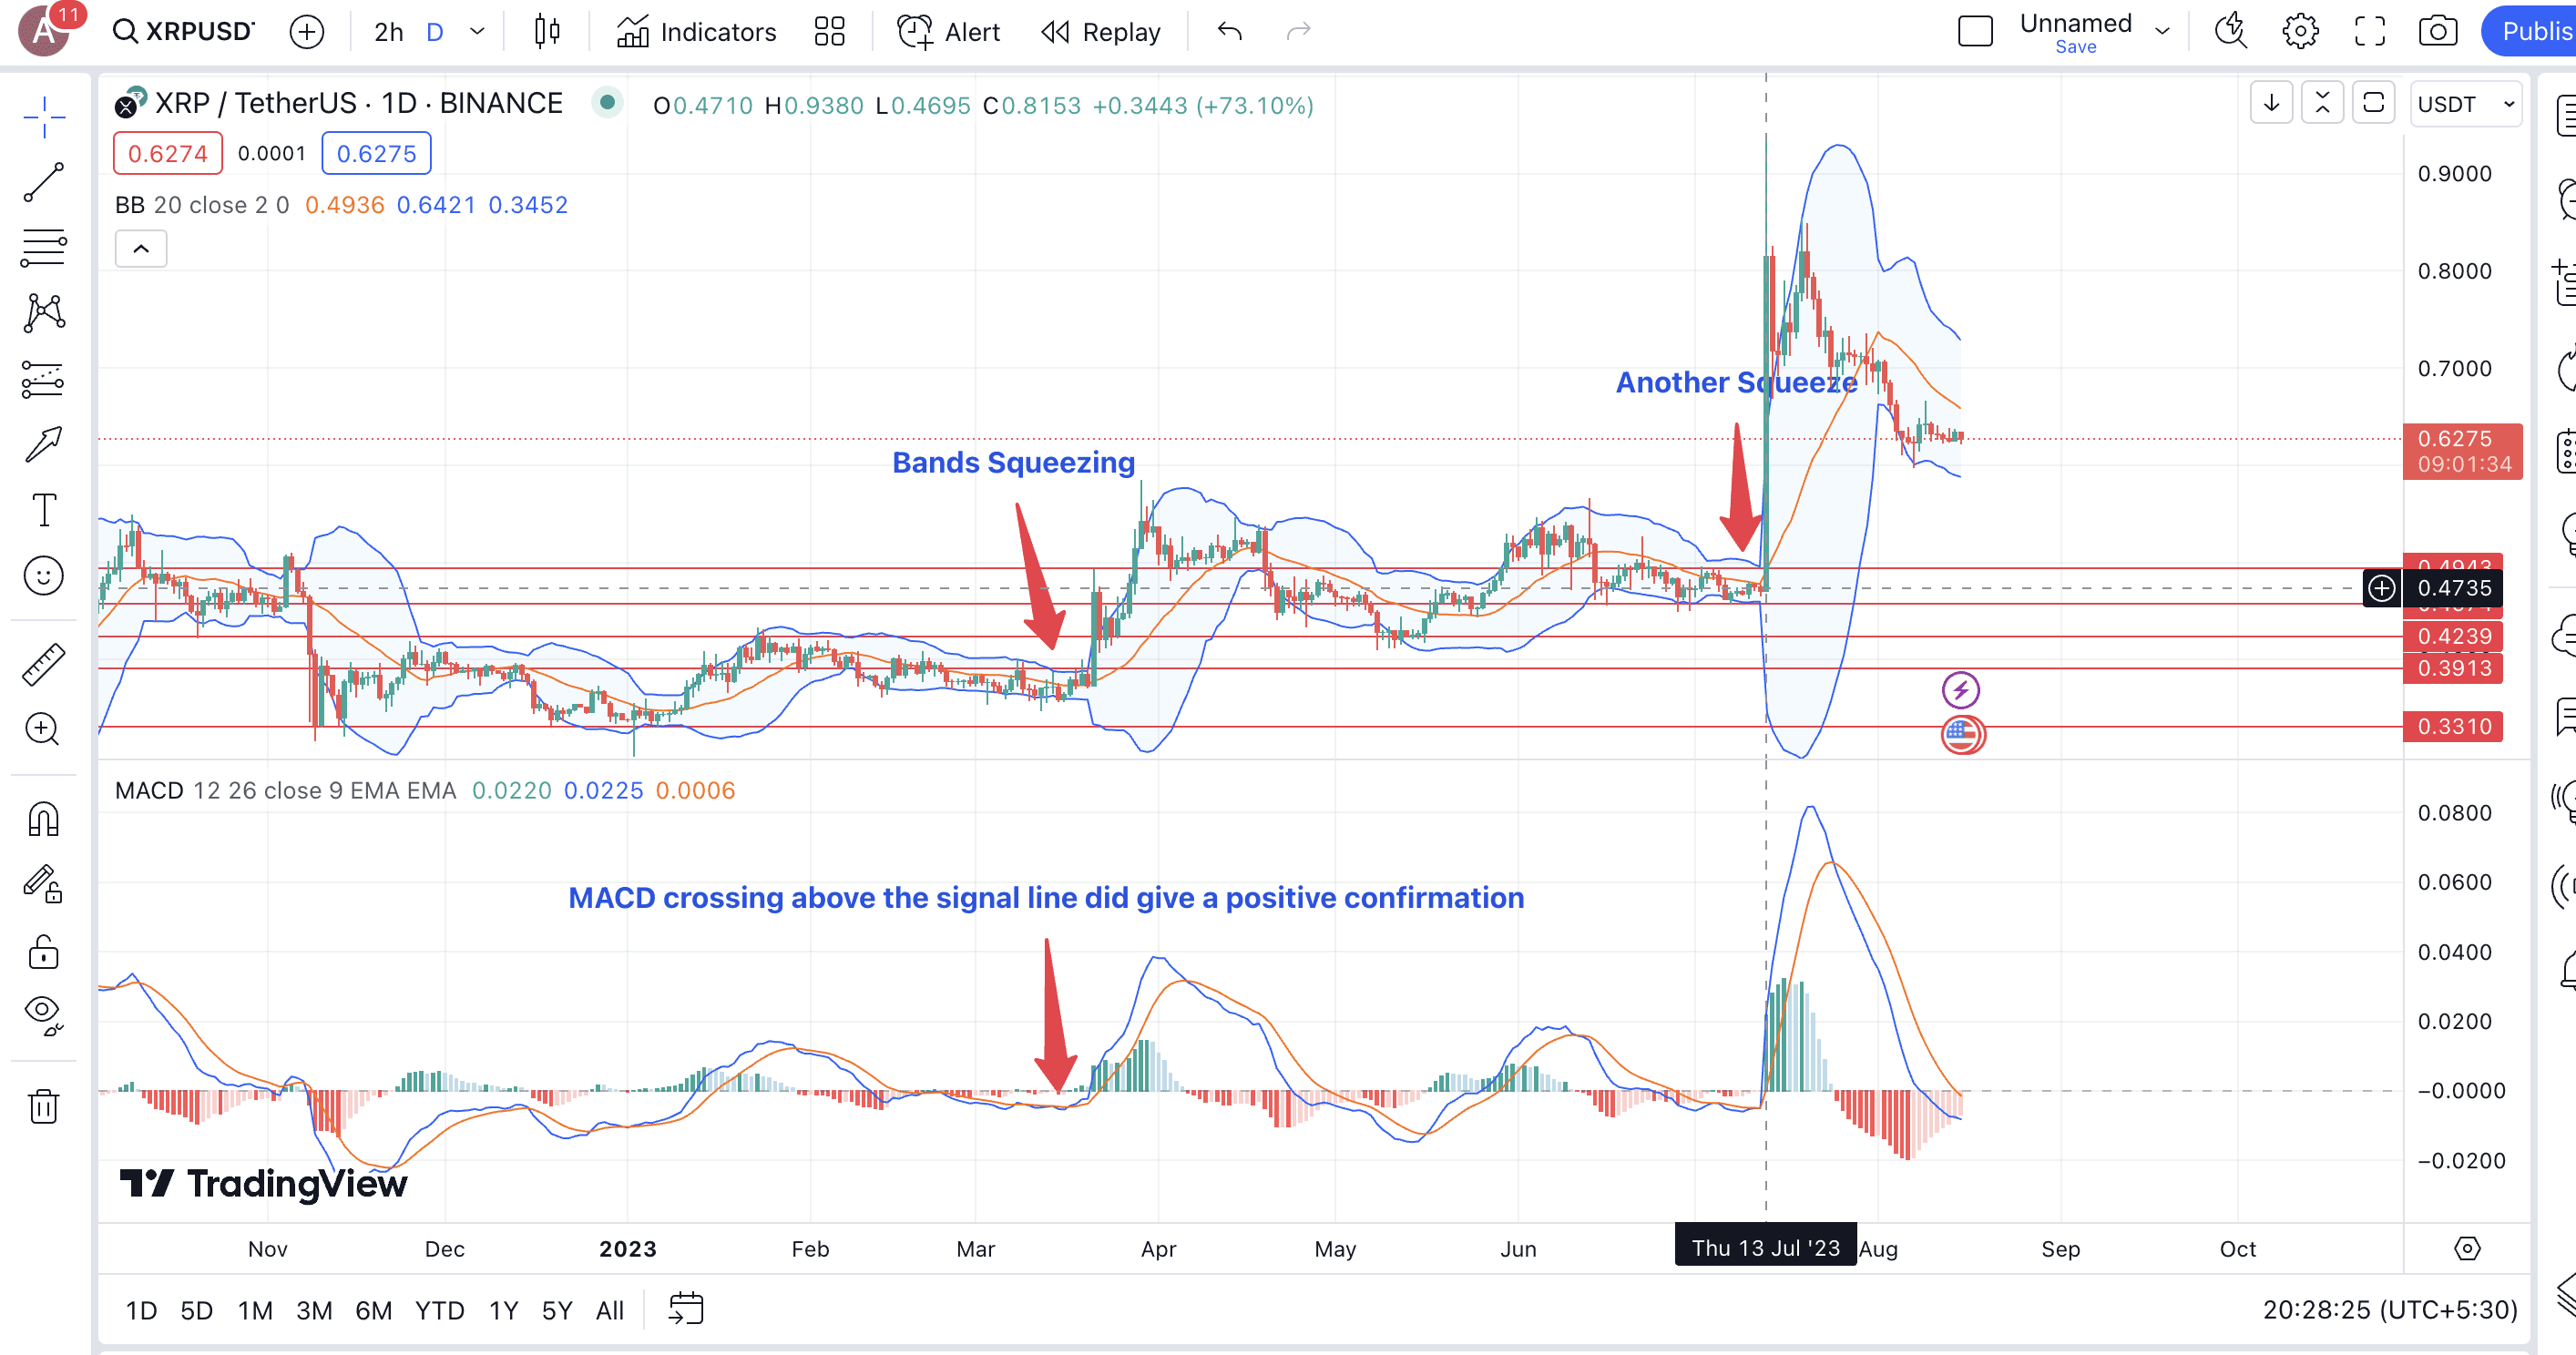
Do note that in this case, MACD’s bearish stance was discovered later, days after the price standard retracing. This shows that as an indicator, Bollinger Bands are faster than the likes of MACD or even RSI, for that matter.
Now that we have touched upon other indicators let us see how Bollinger Bands work with them hand-in-hand.
What do Bollinger Bands tell you?
While the trading strategies involving Bollinger Bands extend beyond band interpretations, here is a simple approach to studying crypto prices in relation to the indicator:
- If the security price touches or even crosses the upper band, the counter might be overbought, and you can expect a correction.
- Similarly, the counter might be oversold if the security price touches or even drops under the lower band. In this case, you can expect a price rise, which might be a buy signal.
- The middle band or the 20-period SMA can work as another line of confirmation.
Do note that these are only the standard indications and are best read and confirmed using other indicators.
Bollinger Bands formula and best settings
As mentioned earlier, Bollinger Bands can help uncover potential reversals using market volatility as a tool. Let us now look at the mathematical construction of the same, one band at a time.
The middle band is nothing but a 20-period simple moving average (SMA).
Middle Band= ∑Close Price/ Number of Periods (This Bollinger Bands formula gives you the flexibility to change the SMA time period if needed)
Using the middle band and standard deviation, we can set up the other two bands:
Upper Band = Middle Band + (Number of Standard Deviations x SD of Price)
Lower Band = Middle Band – (Number of Standard Deviations x SD of Price)
Where SD stands for Standard Deviation.
These formulas work in the background; the regular trader doesn’t need to wrap their heads around it. Still, there is no harm in knowing them.
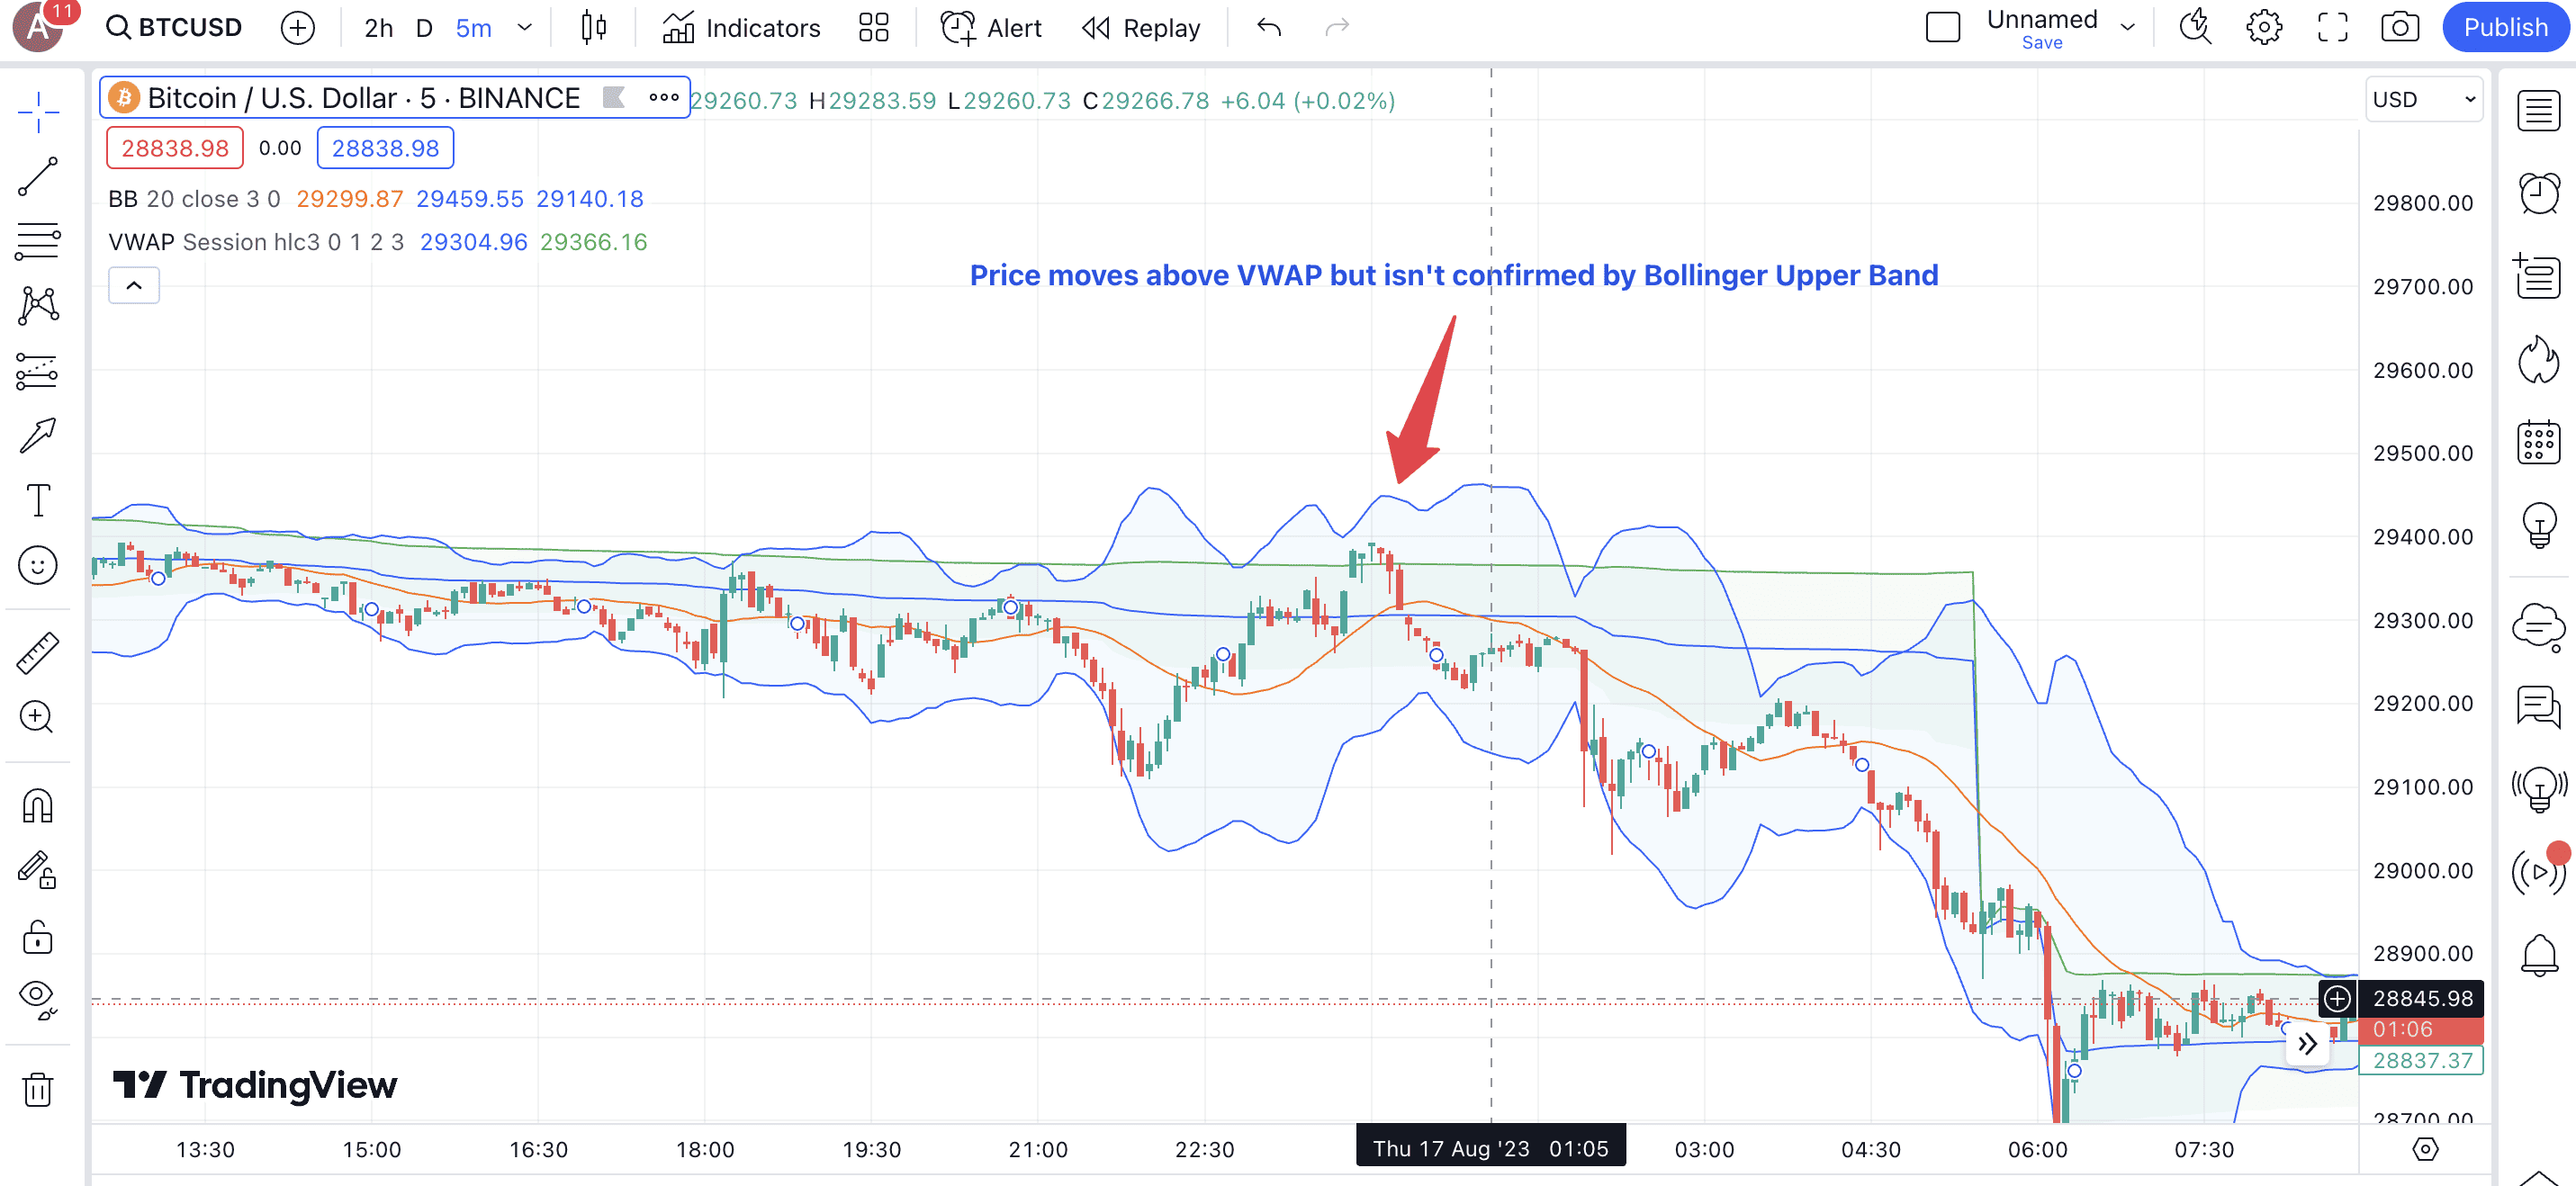
As for the settings, we had already mentioned how traders usually work with the default setting of two standard deviations for band formation. However, the more aggressive one would be one where the likes of three standard deviations can be used for very short-term trades — the ones where the VWAP indicator can be used for added confirmation. The three standard deviation setting is safer than the others and can offer better scalping signals.
What is the strategy for Bollinger Bands? Using it as a standalone tool
Like any other technical analysis tool, even Bollinger Bands works well with other indicators. However, as it comprises multiple elements, it can also be used as a standalone tool for offering a dynamic picture of potential reversals, price trends, and volatility.
Here are the phenomenons that you might want to consider for crypto trading:
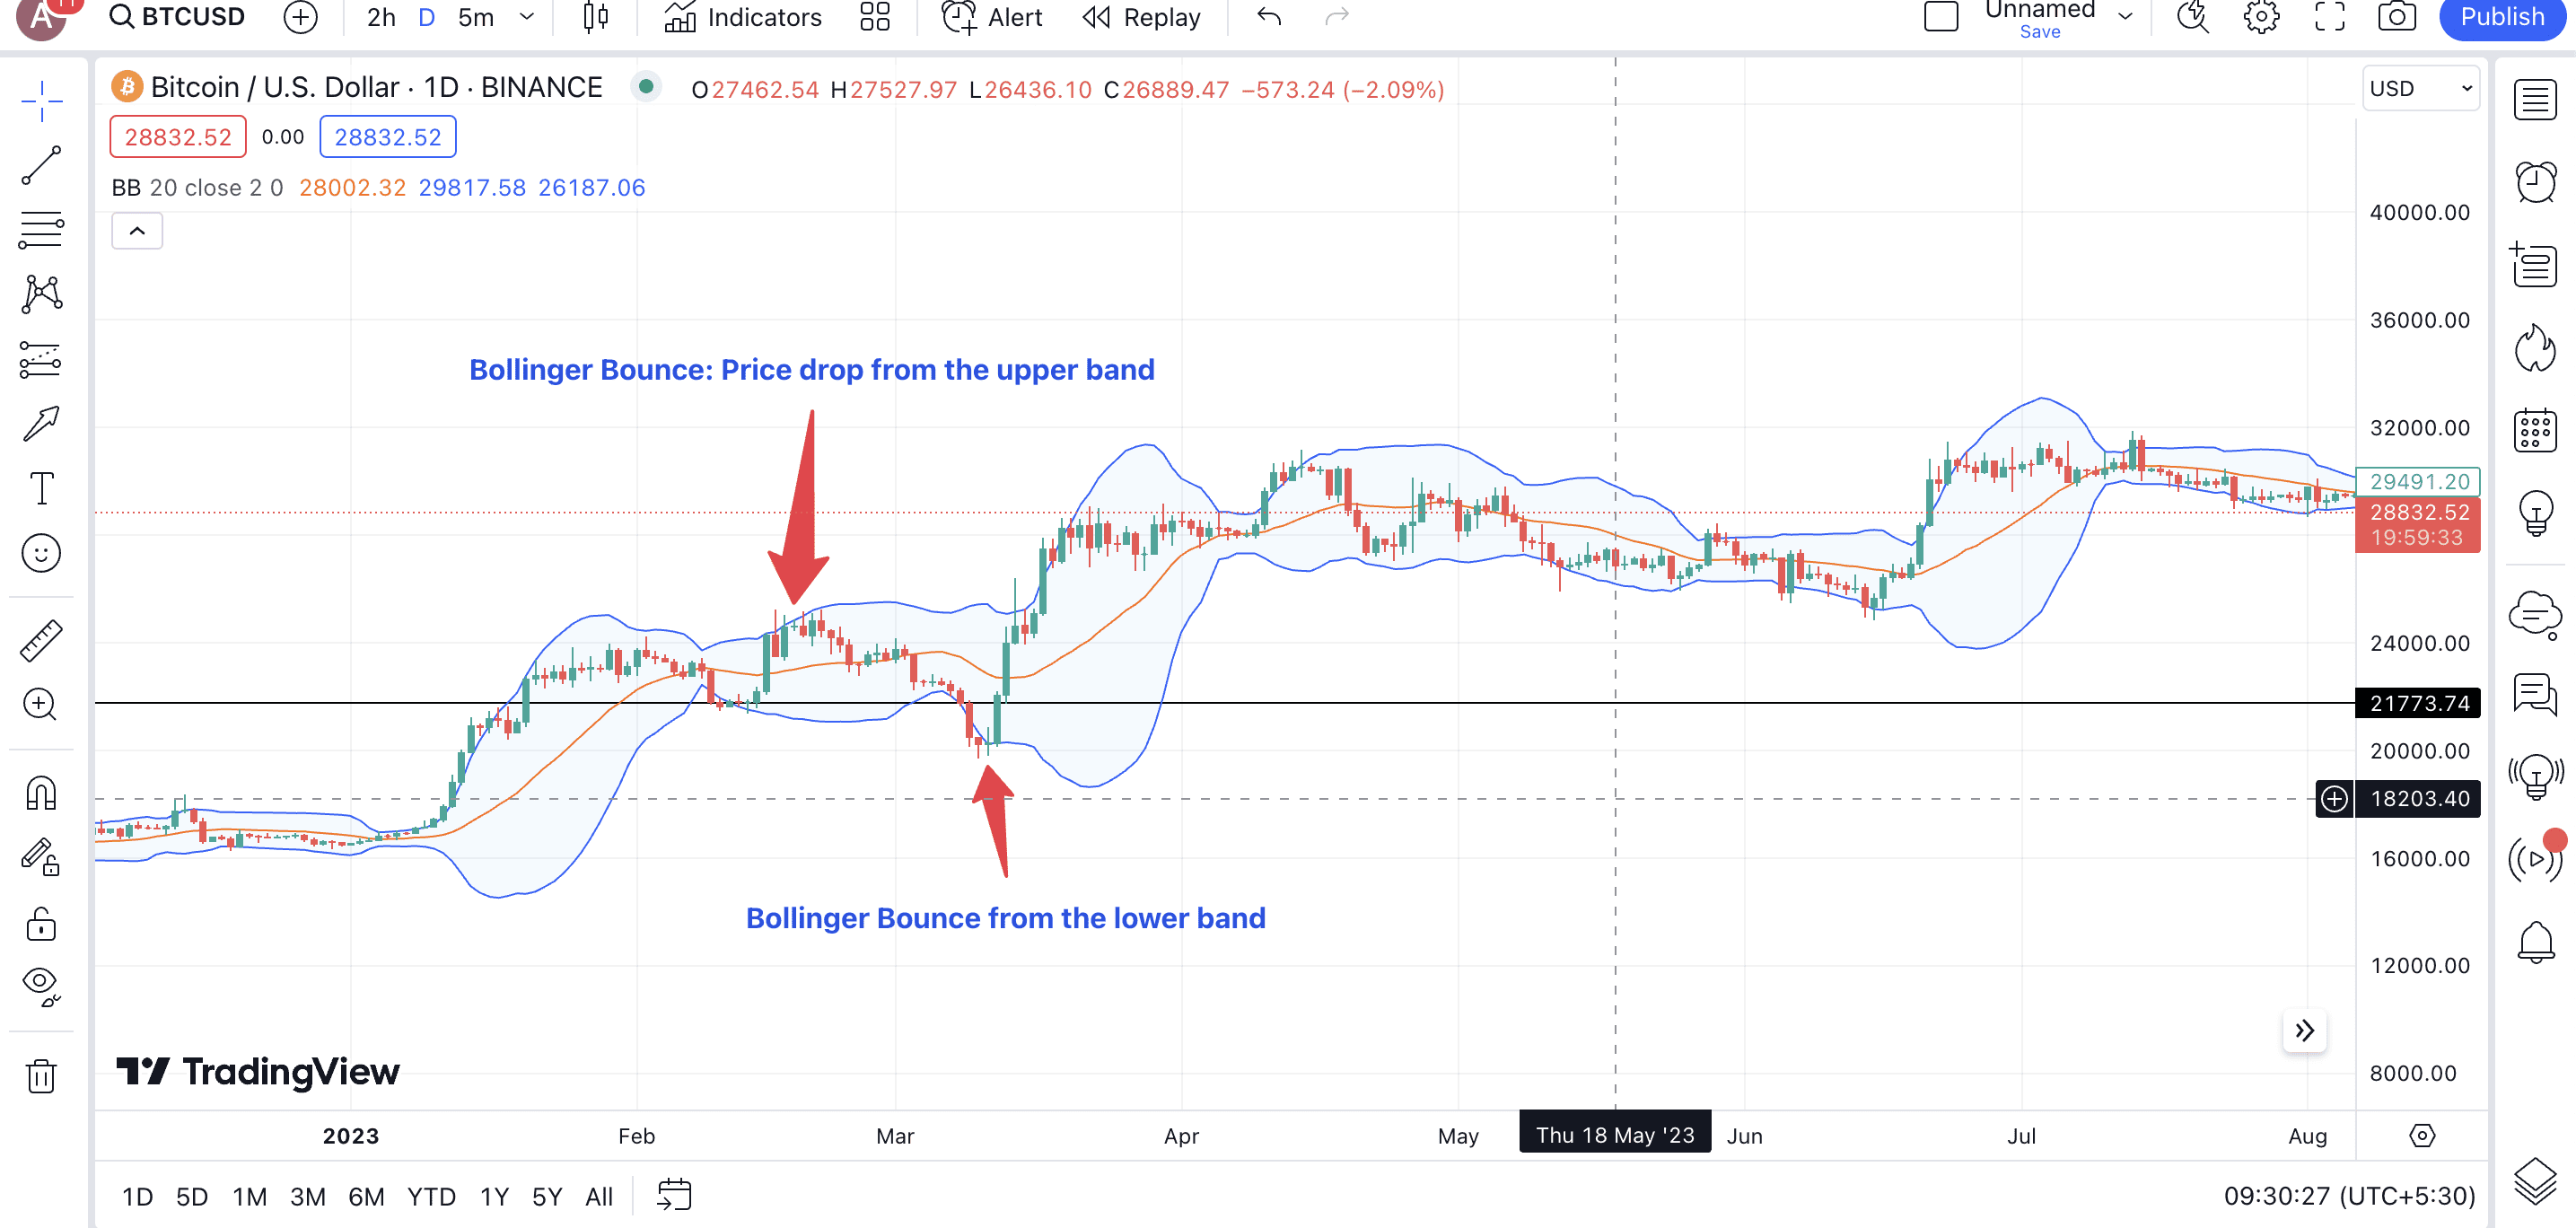
Bollinger Bounce
This trading phenomenon happens when the price of a crypto or any other high-beta asset bounces off the upper or lower bands. As mentioned previously, this happens as the extreme bands act as dynamic support and resistance lines. Therefore, when the price reaches and touches the upper band, there is a chance that it will revert to the middle band. Conversely, a bounce off the lower band can lead to a price rise. In these cases, the middle band acts as an additional confirmation line.
SMA-led Bollinger Bands
Moving averages can help you analyze market trends. Yet, if you are unsure as to how to use them, you can simply chart the Bollinger Bands and get started. The middle band acts as the 20-period SMA, and prices above or under the same can hint at an uptrend or a downtrend. As a trader, this type of market view helps analyze the direction.
Also, a shorter timeframe moving average, say the 10-period SMA crossing above the 20-period middle band SMA, can also work like a golden crossover. This supporting phenomenon can offer an additional bullish signal in case you want to take buy or sell calls based on the middle band itself.
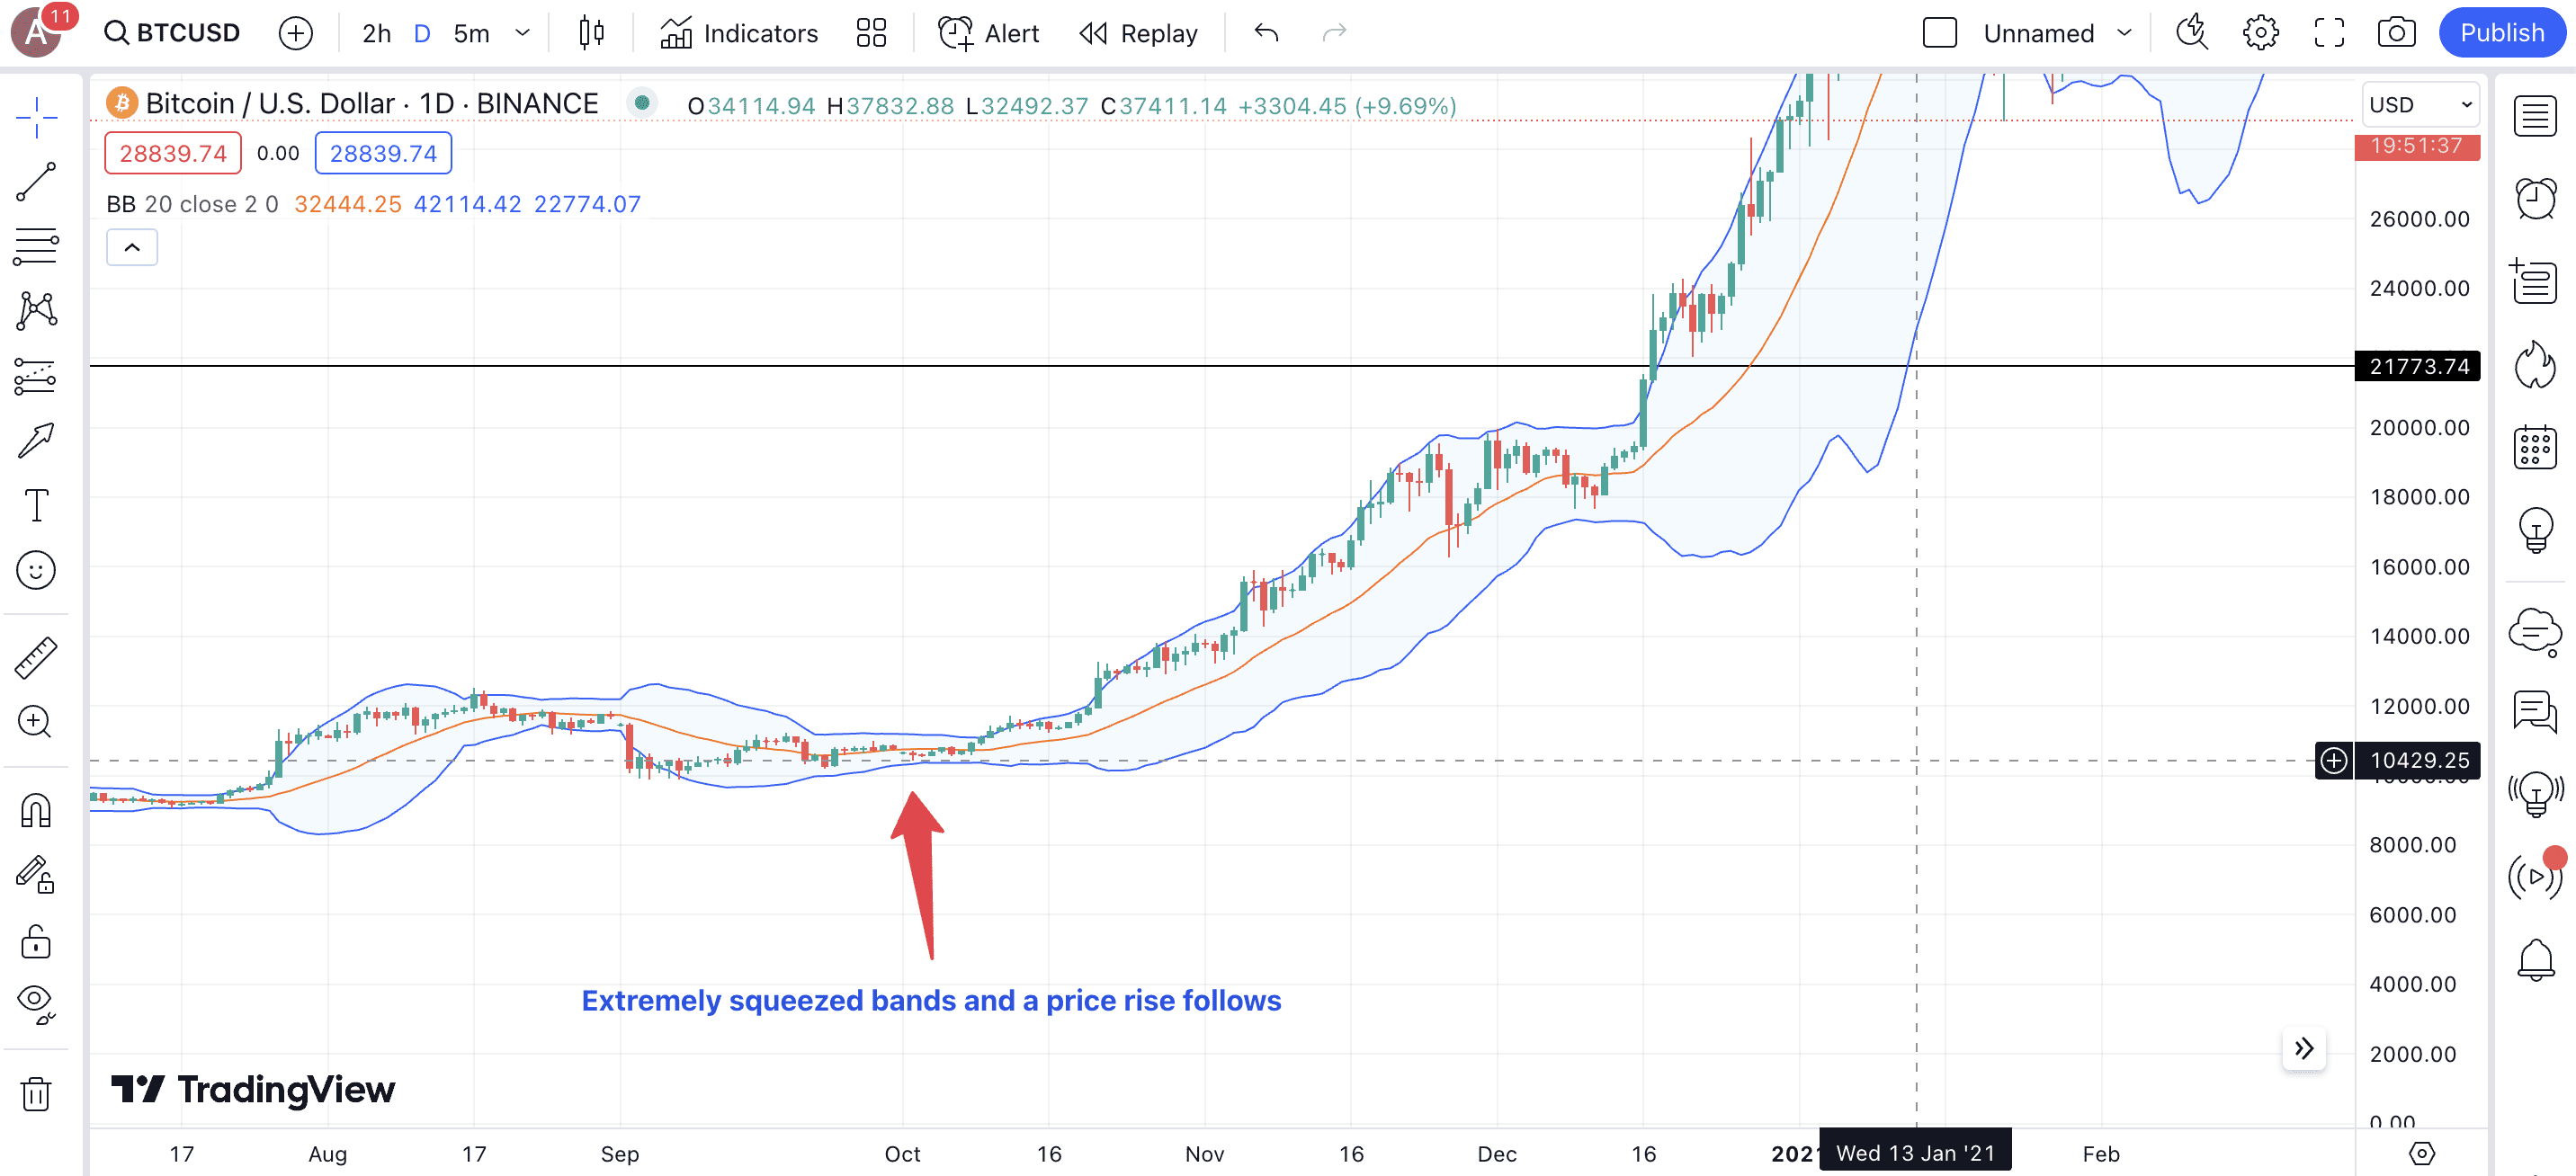
Bollinger Squeeze
Bollinger Squeeze is an innovative Bollinger Bands strategy where a trader is always on the lookout for a deep squeezing of the upper and lower bands. The pattern has to look like a conduit. Squeezing of the bands shows that the volatility is down, and the market is gearing up for its next move. In most cases, a squeeze is a breakout confirmation. However, the direction can be on the downside or the upside, depending on what other indicators reveal.
Here is an interpretation of the band tightness:
Some might even term this the Bollinger bandwidth phenomenon, where the distance between the upper and lower bands, relative to the middle band and themselves, is used to see if the market is trending, consolidating, or on the verge of a breakout.
Double Bollinger
Here is an advanced Bollinger Bands strategy where traders often use two sets of the same indicator to locate the best buy or sell levels. The idea here is to play around with the standard deviation count of each set. This approach forms multiple zones on the chart, helping better identify the more nuanced trends. Here is how traders riding BTC’s late 2020 uptrend could have used the same.
Seasoned traders could have used the Double Bollinger trading strategy to capture BTC’s ascent from $18,000 in December 2020. The best approach would have been to use two Bollinger pairs — the first with one standard deviation as the inner Bollinger and the second with two standard deviations as the outer Bollinger.
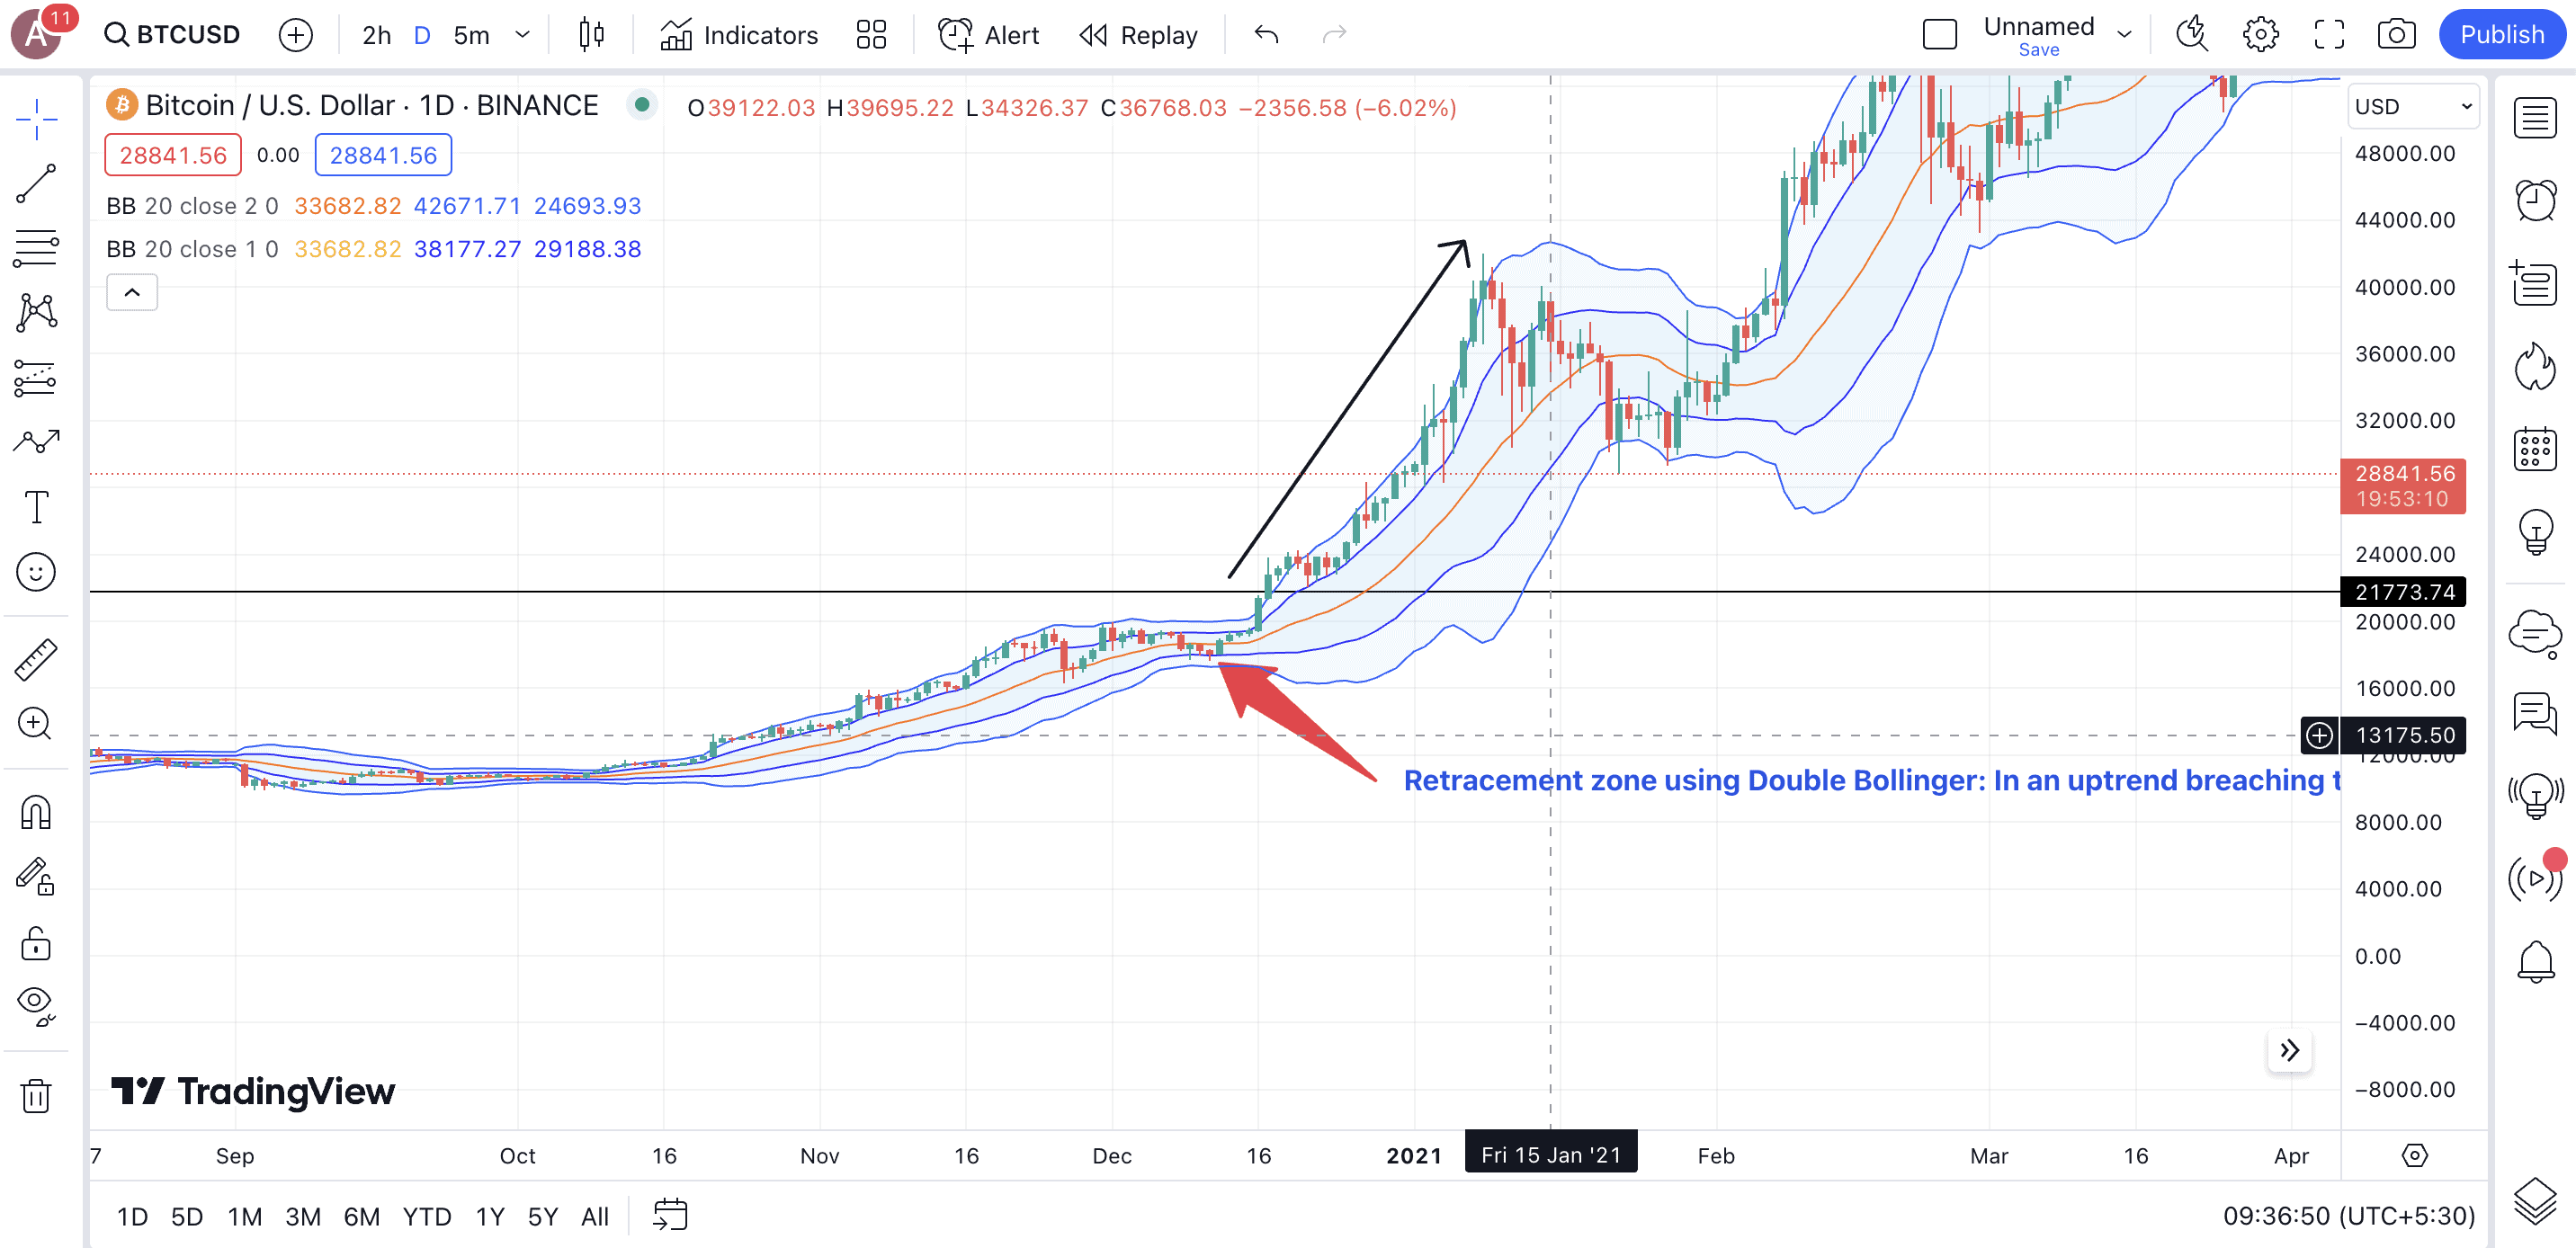
The idea here was to identify potential buying points every time BTC crossed the upper band of the inner Bollinger. A move towards the upper band of the outer Bollinger could have indicated zones to book profit in expectation of a retracement. Therefore, the inner band or another set of Bollinger Bands worked as additional resistance and support lines for someone trying to trade Bitcoin in late December 2020.
Bollinger Bands and candlesticks
Bollinger Bands for crypto trading are effective. Yet, they work even better when paired with candlestick patterns and formations. Let us look at a few scenarios where Bollinger Bands can work directly with the price action, especially when you use the candlestick chart:
The M-Top
If you see the price pattern making two highs, with the first crossing the upper band and the second barely making it to the upper band, you can expect the prices to correct.
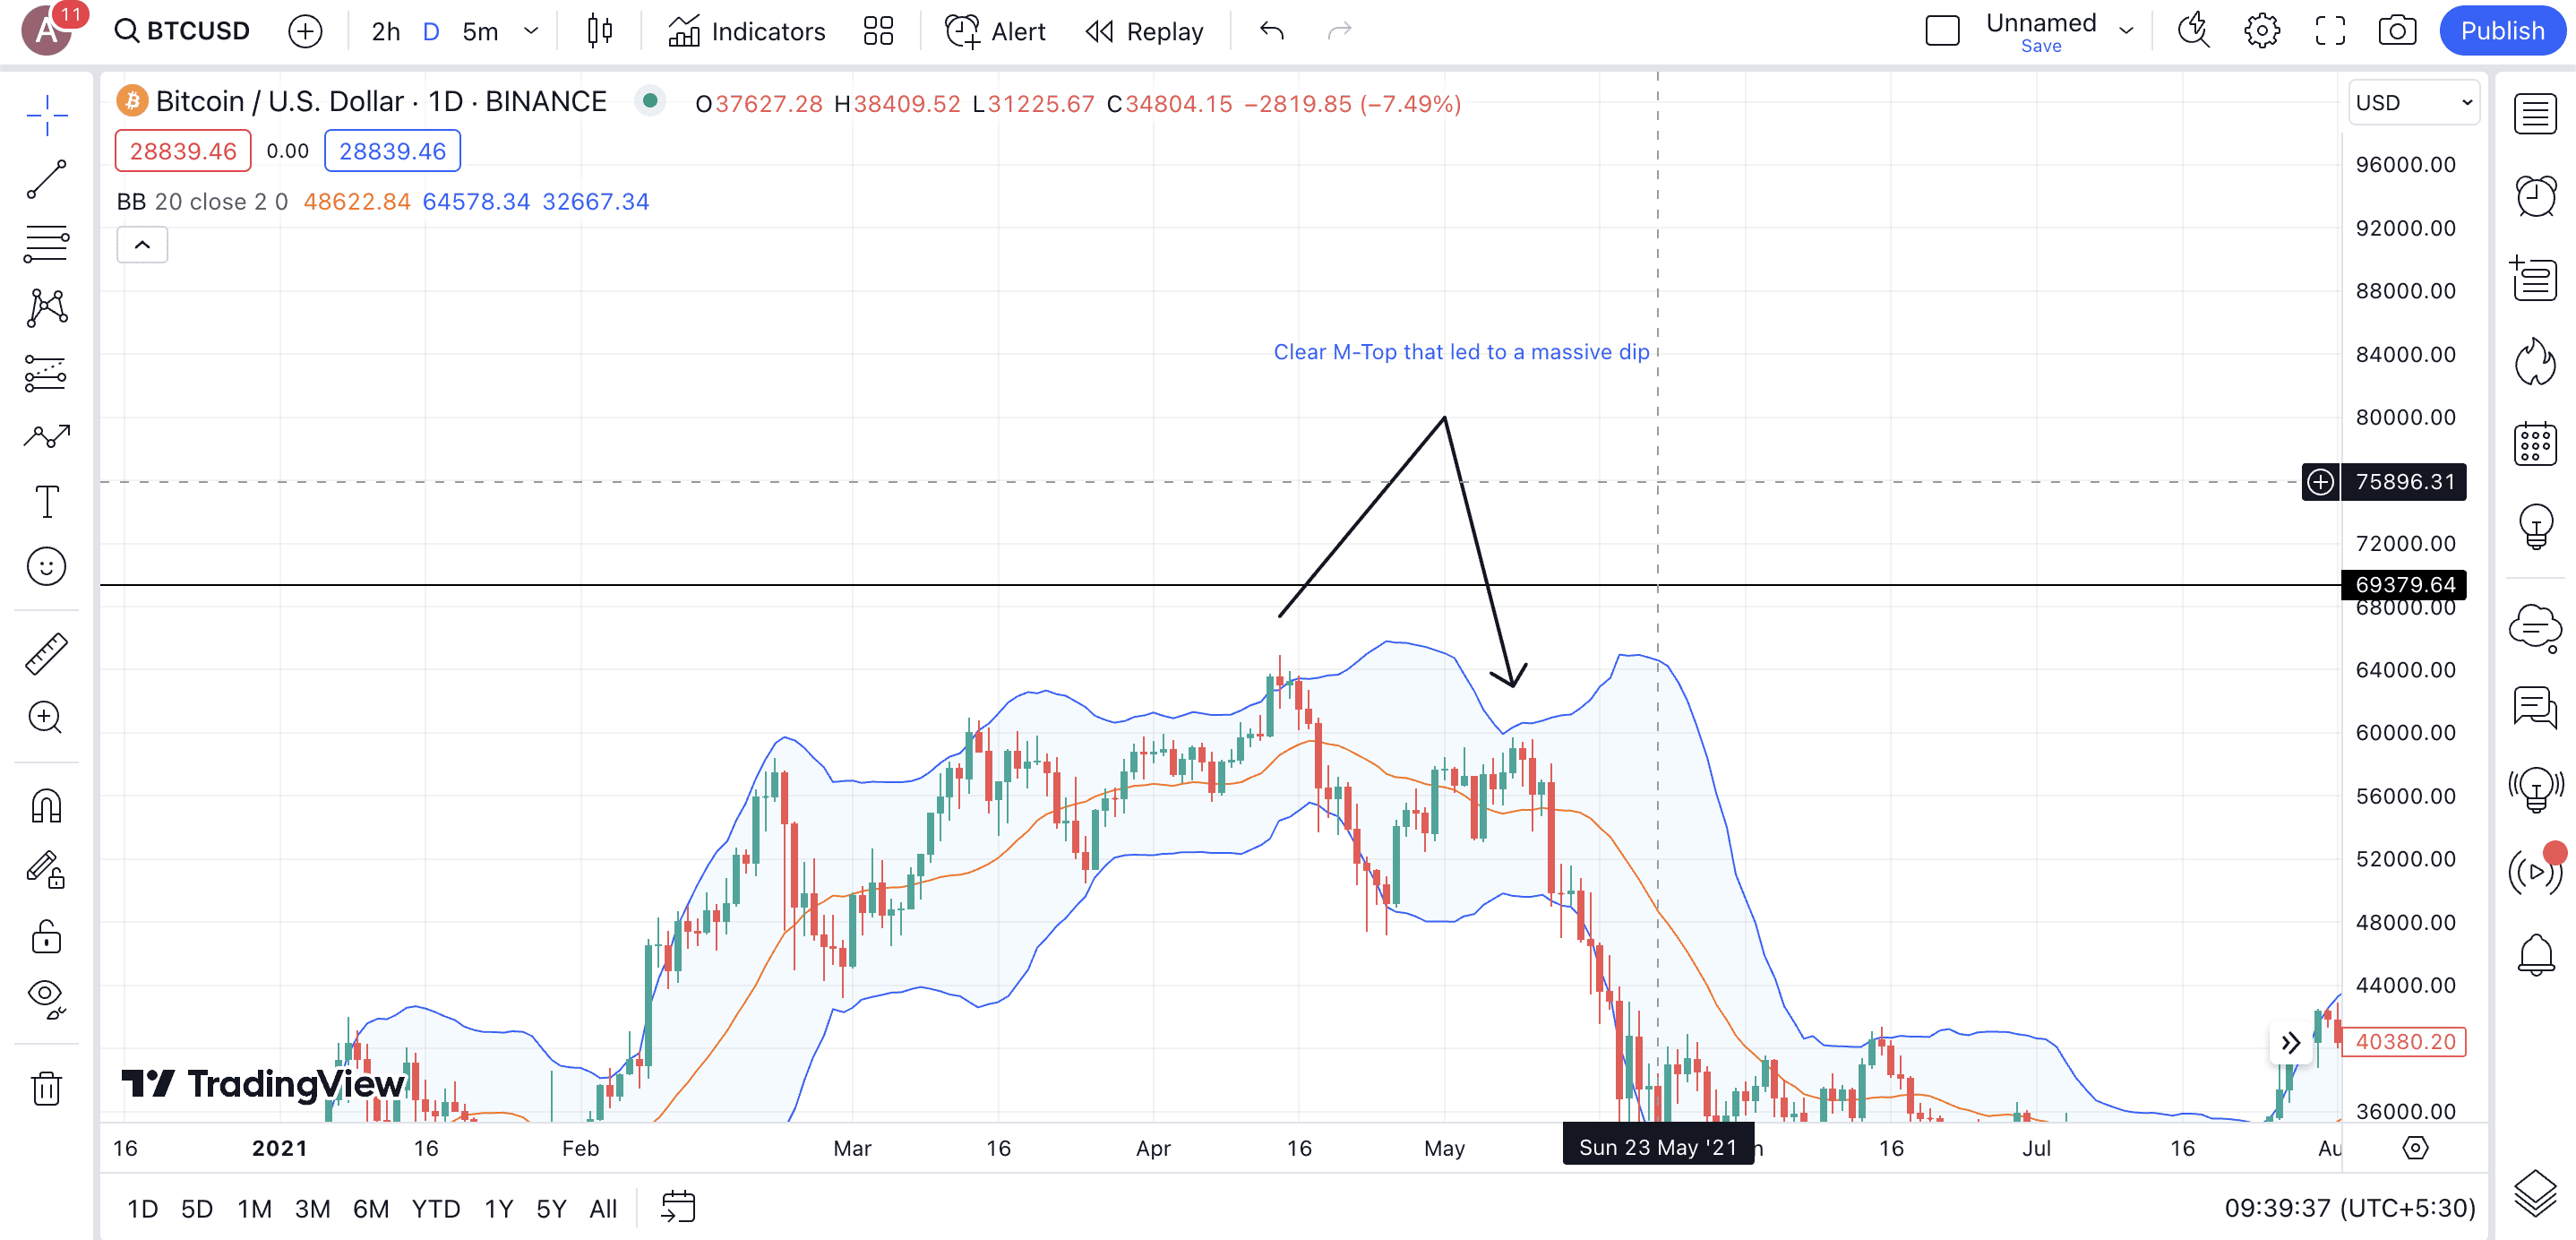
A quick confirmation here would be the presence of a bearish candlestick like the hanging man or a bearish pattern like the harami.
Did you know? Traders often see familiar patterns in charts, like the M-Top, when they aren’t there. This is a psychological phenomenon termed Pareidolia. This is where additional indicators are necessary to eliminate bias and misinterpretations.
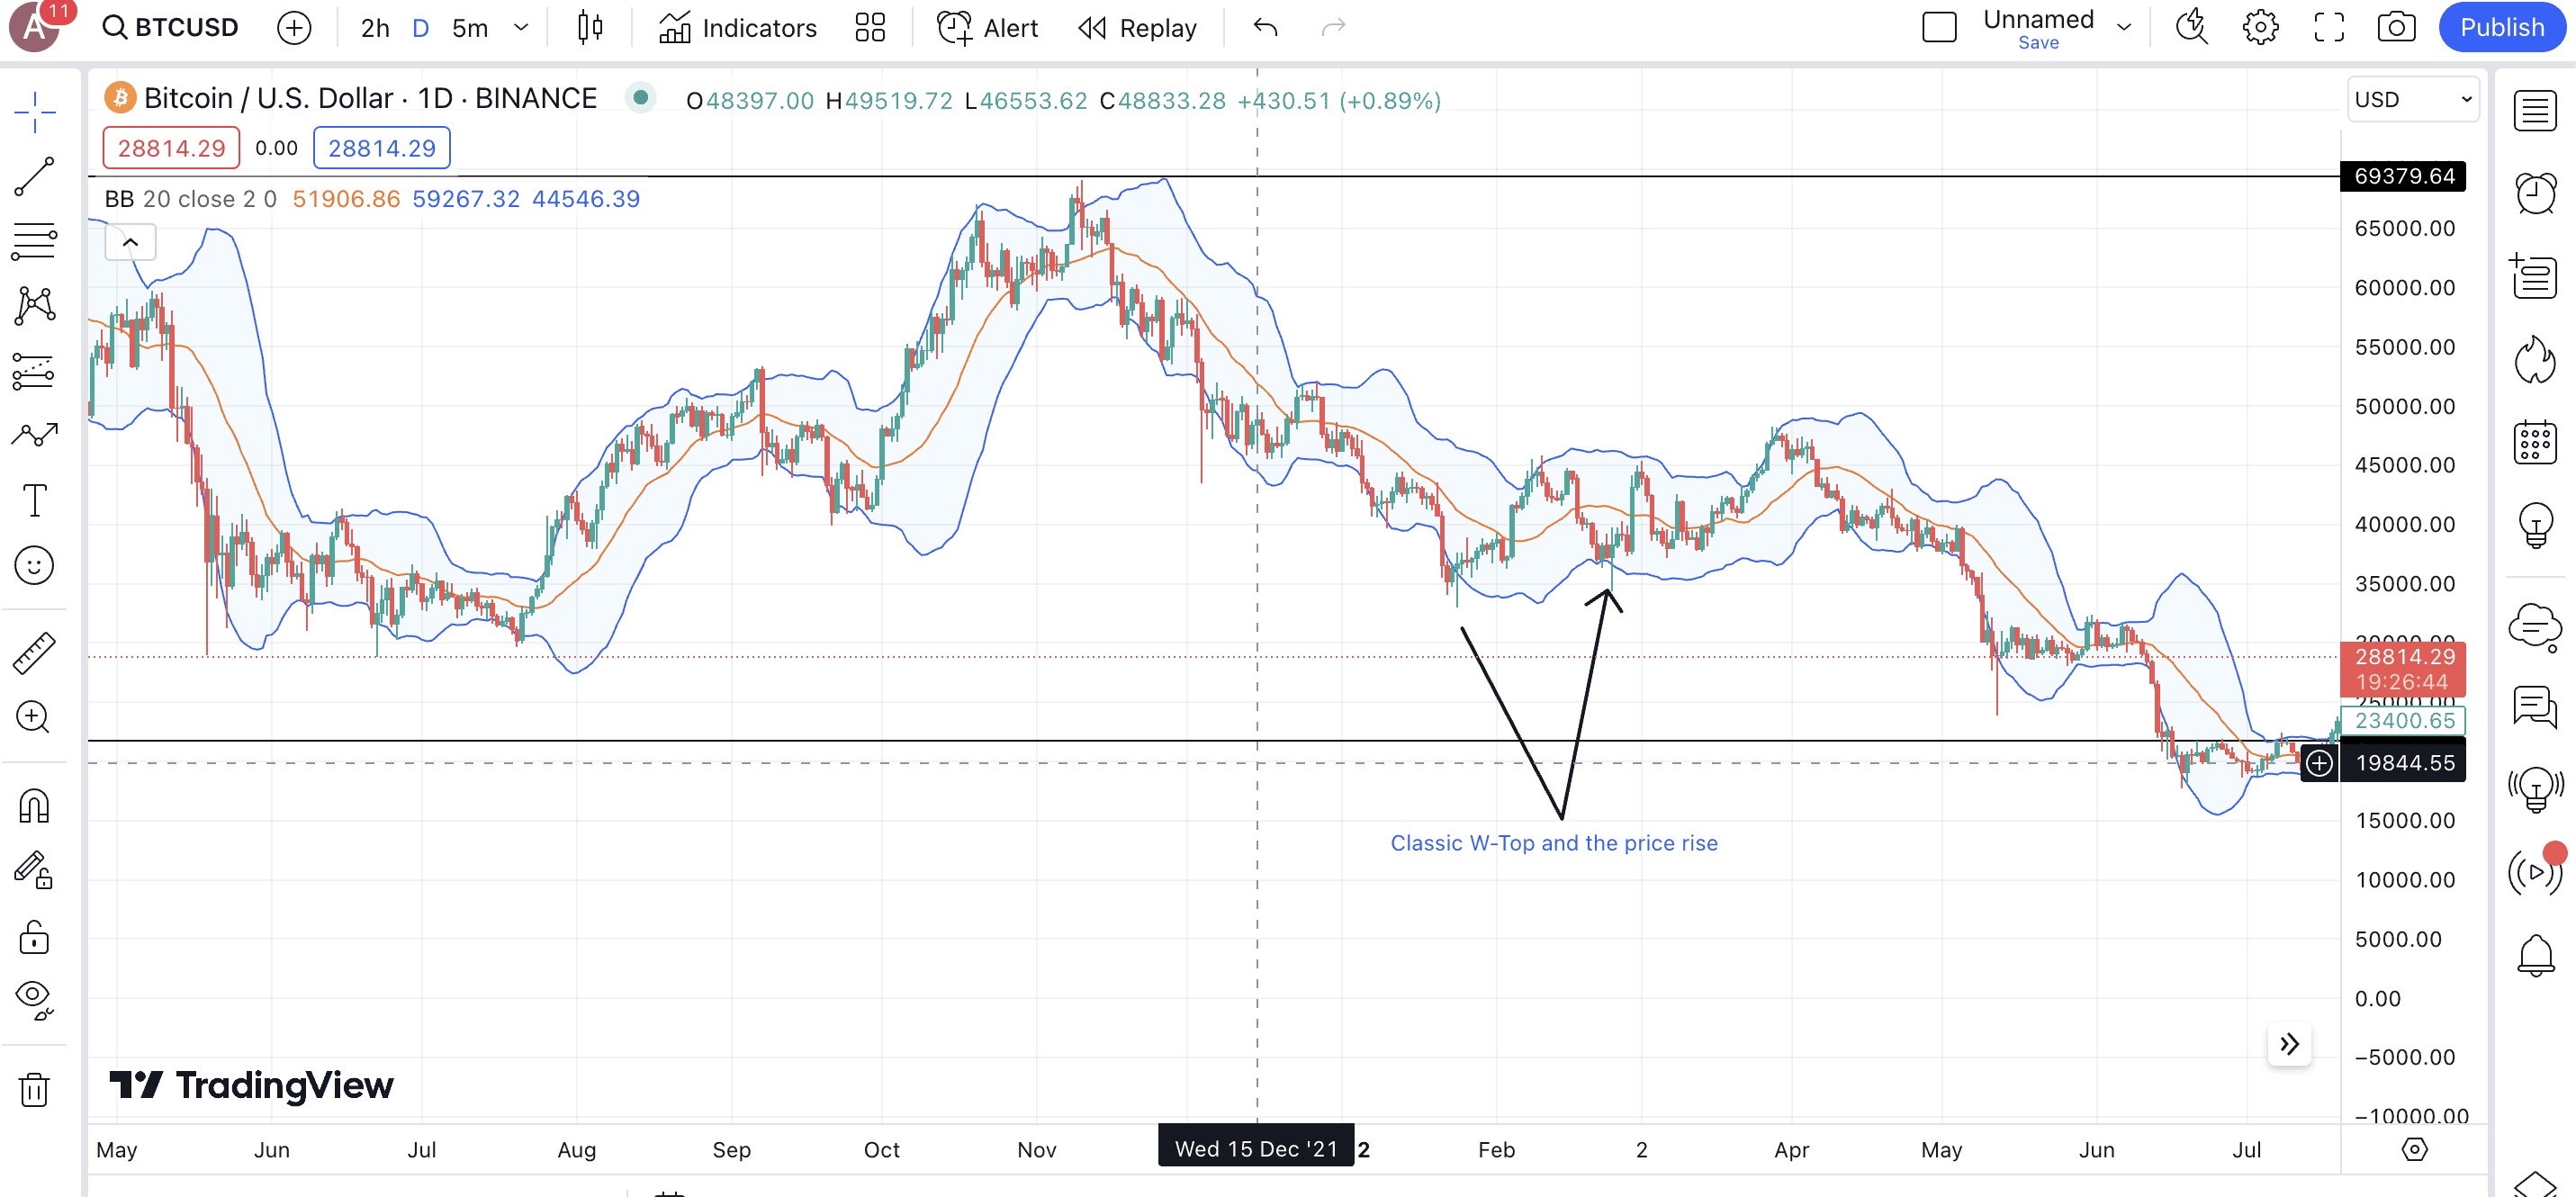
The W-Bottom
This is a Bollinger-led double-bottom formation where the price touches or crosses the lower band as the first low and then barely touches the line for the second bottom. This signals a strong upward momentum, showing that the bears are losing hold. A strong confirmation would be a candlestick pattern like the bullish harami or the hammer.
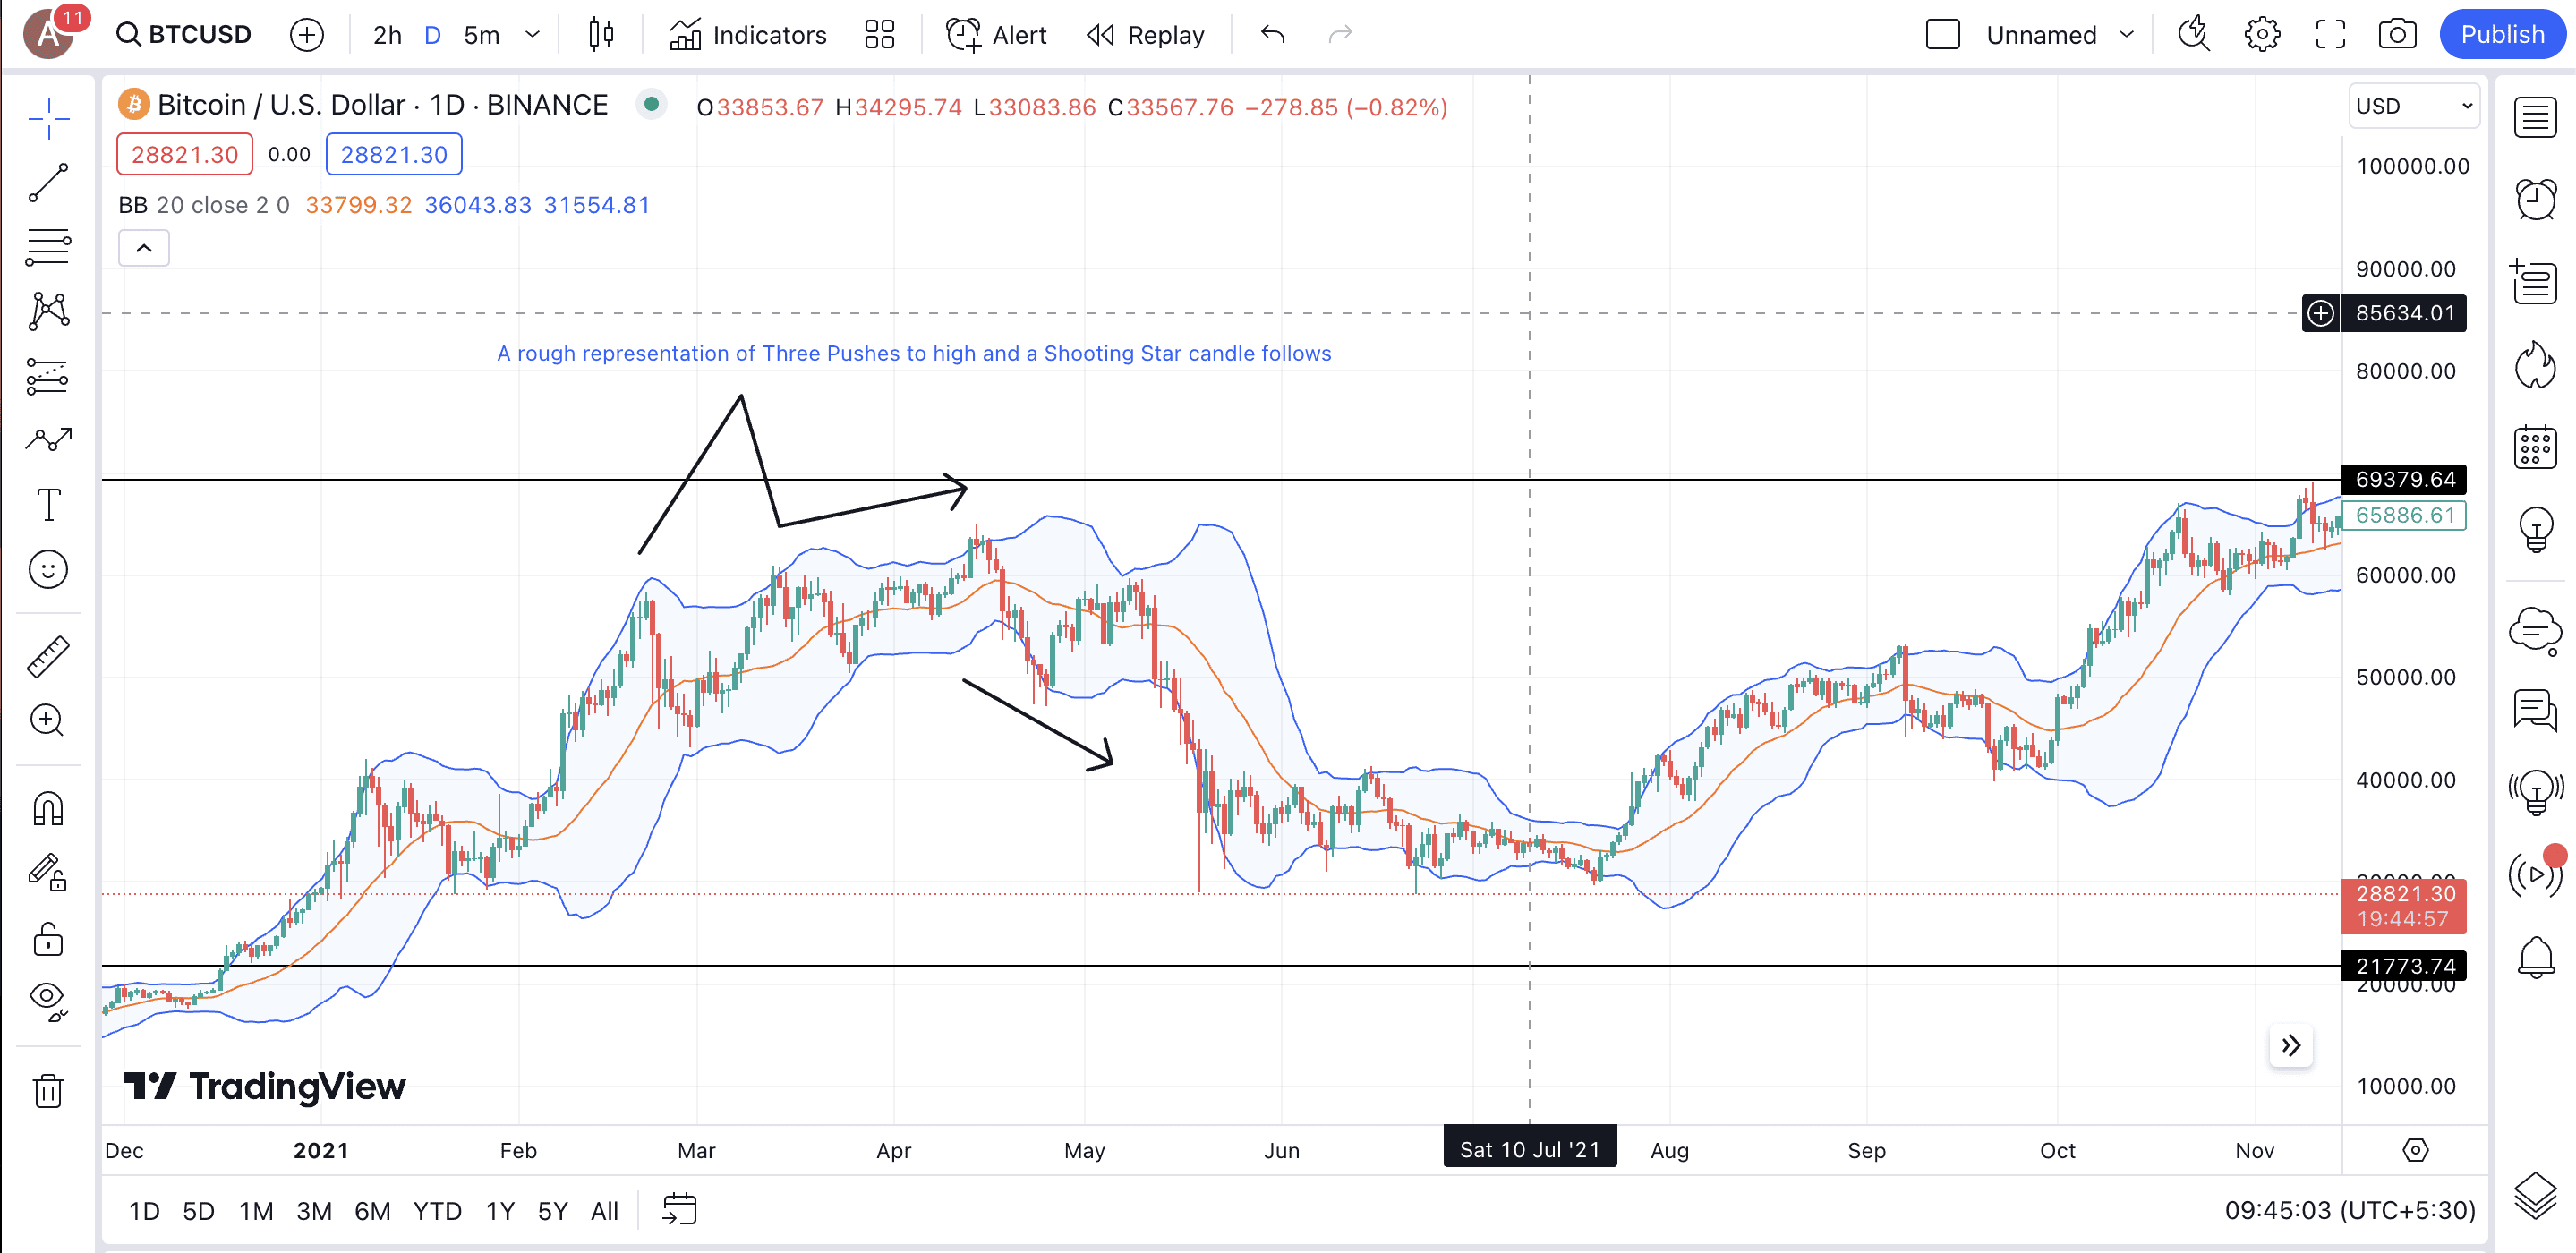
Three pushes
This pattern is more like a triple-top formation where each top is a lower-high formation. This shows weakening momentum and might drive a correction in the presence of bearish patterns like the shooting star.
Squeeze and the stick
If you have just encountered a Bollinger squeeze but are unsure about other direction-confirming indicators, you can rely on candlestick patterns for this. Anything like a bullish engulfing pattern or even a hammer can push the prices higher, whereas a bearish engulfing or any other bearish candle can push the price downwards.
Continuation patterns
And finally, you might see that in some cases, the price of crypto keeps rising, with the upper bands growing further, still aligned with the prices. This kind of move happens during a bullish uptrend and can be confirmed by bullish candlestick patterns like the “three white/green soldiers” and more.
Integrating Bollinger Bands with other indicators
As stated previously, Bollinger Bands work best when paired with other indicators. If used correctly — with the appropriate accessories — they can help with arbitrage trading, find the right regions to enter or place a stop loss order, or even initiate grid trades.
Using Bollinger with other metrics:
But then, finding the correct indicator to use at the right time is often challenging. Luckily, we’ve explained below what you need and when.
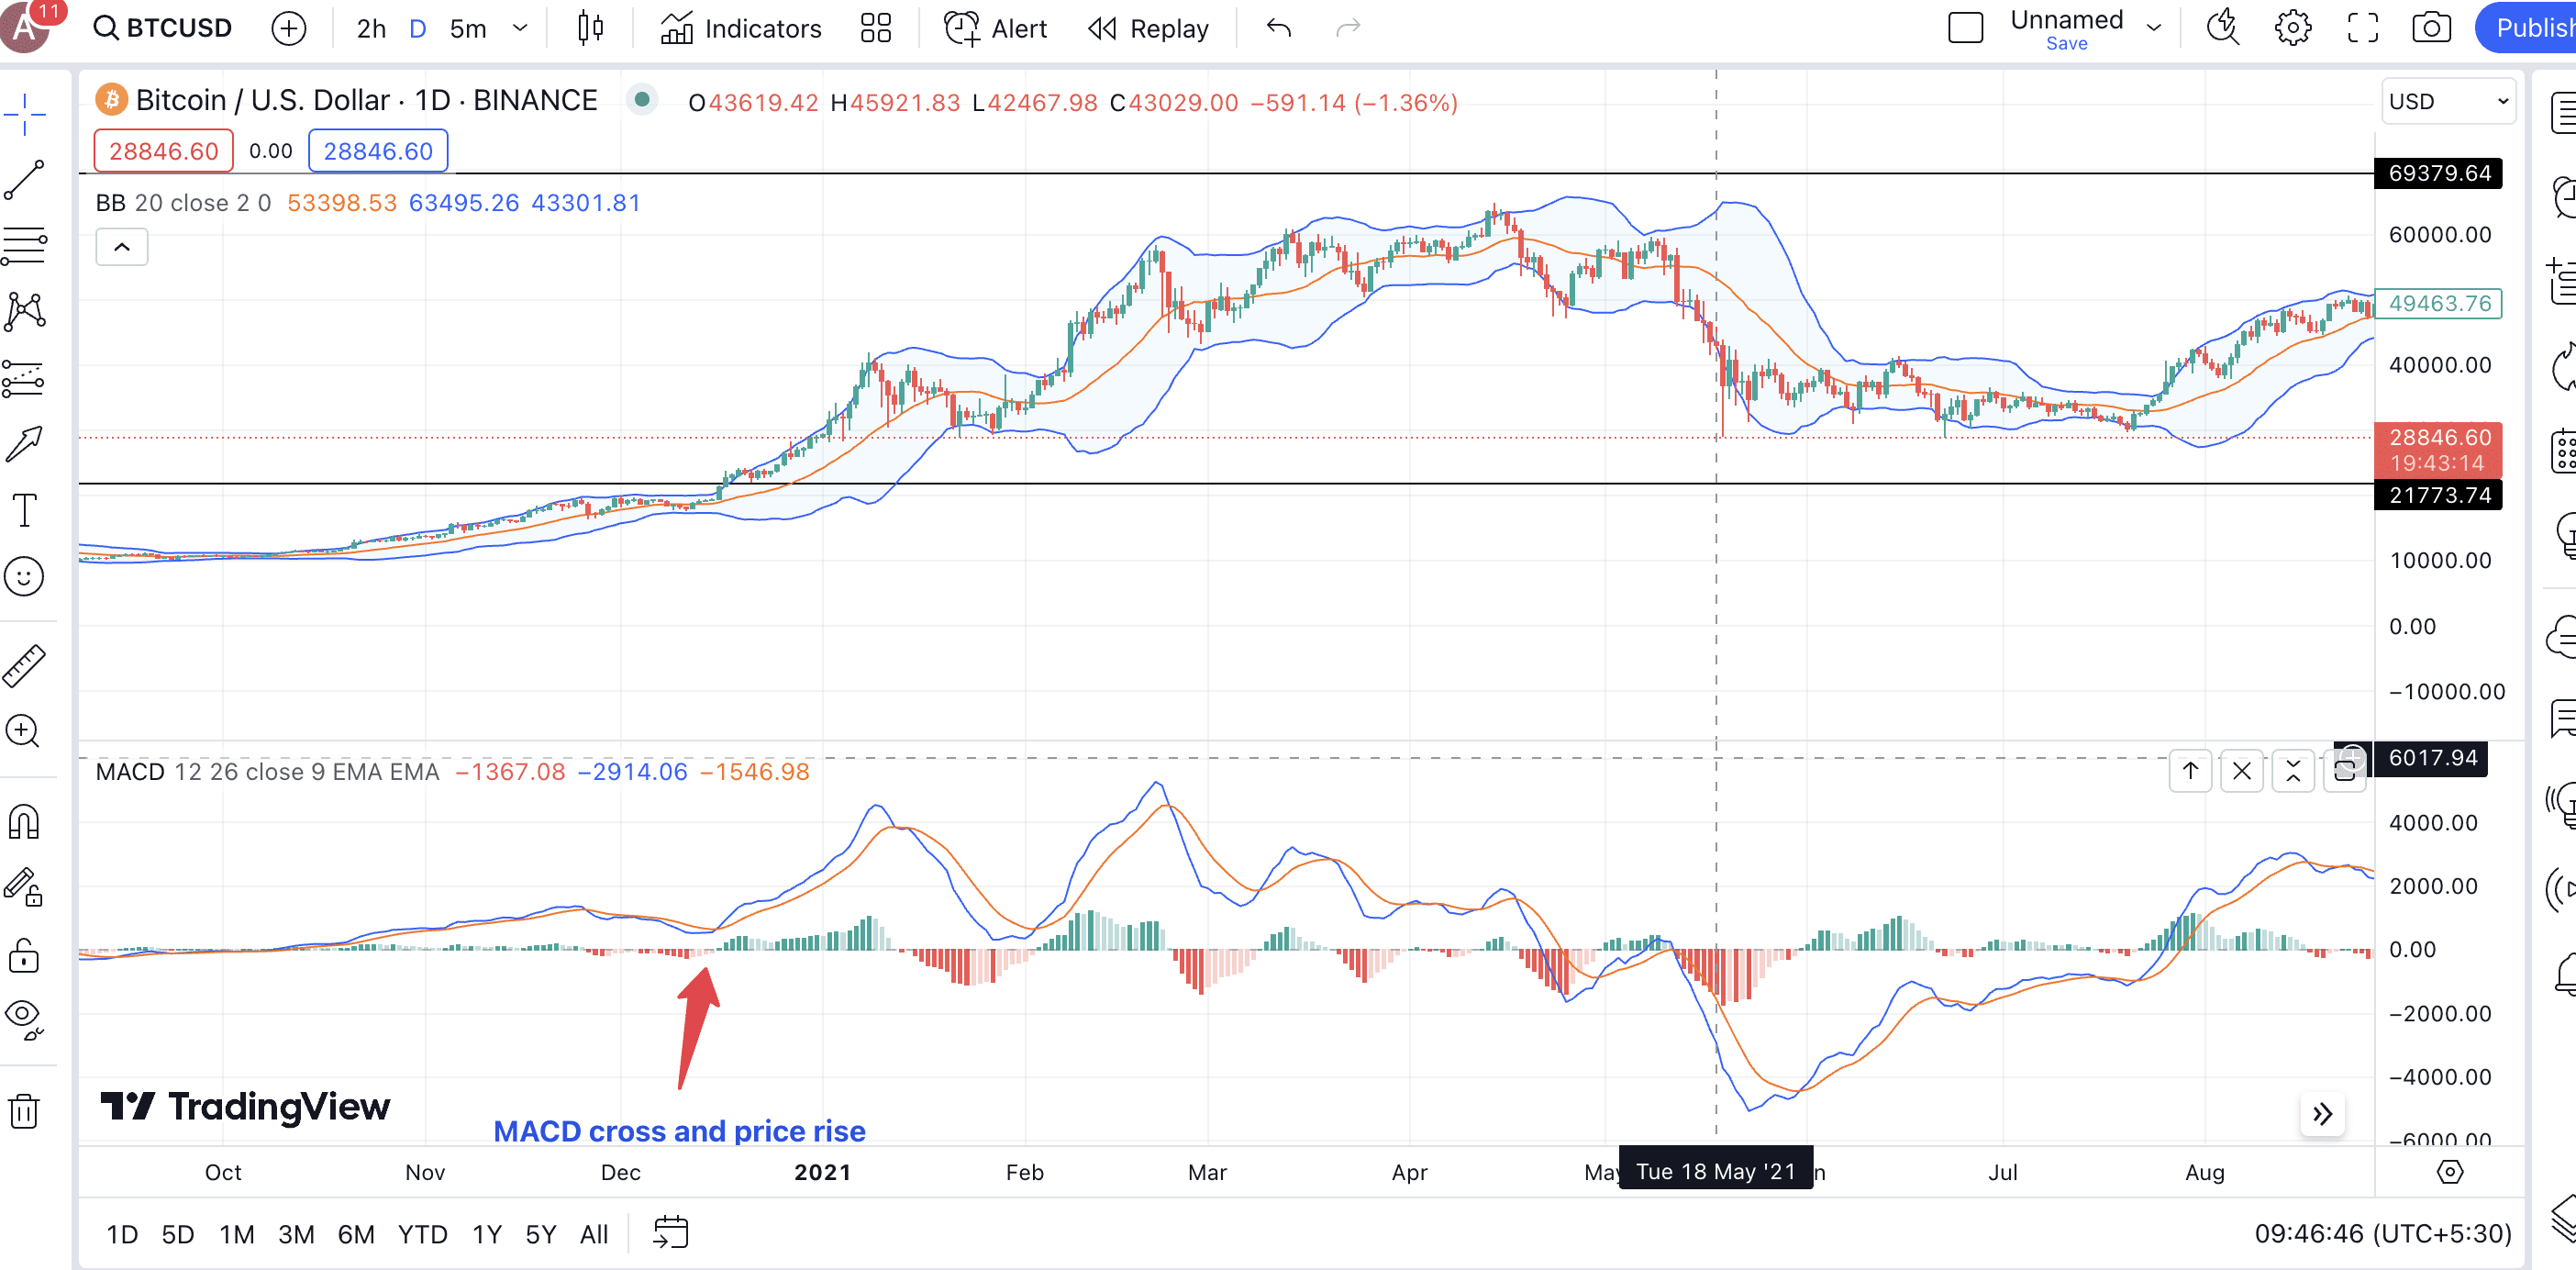
Bollinger Bands and MACD
We saw a MACD-led example while exploring XRP’s past price moves. That said, MACD can really help confirm the Bollinger-created signals. The idea is to check for the MACD line crossing the signal line when there is a Bollinger squeeze or when the prices move very close to the lower Bollinger band. This confirms a breakout on the upside or even a short-term surge in prices.
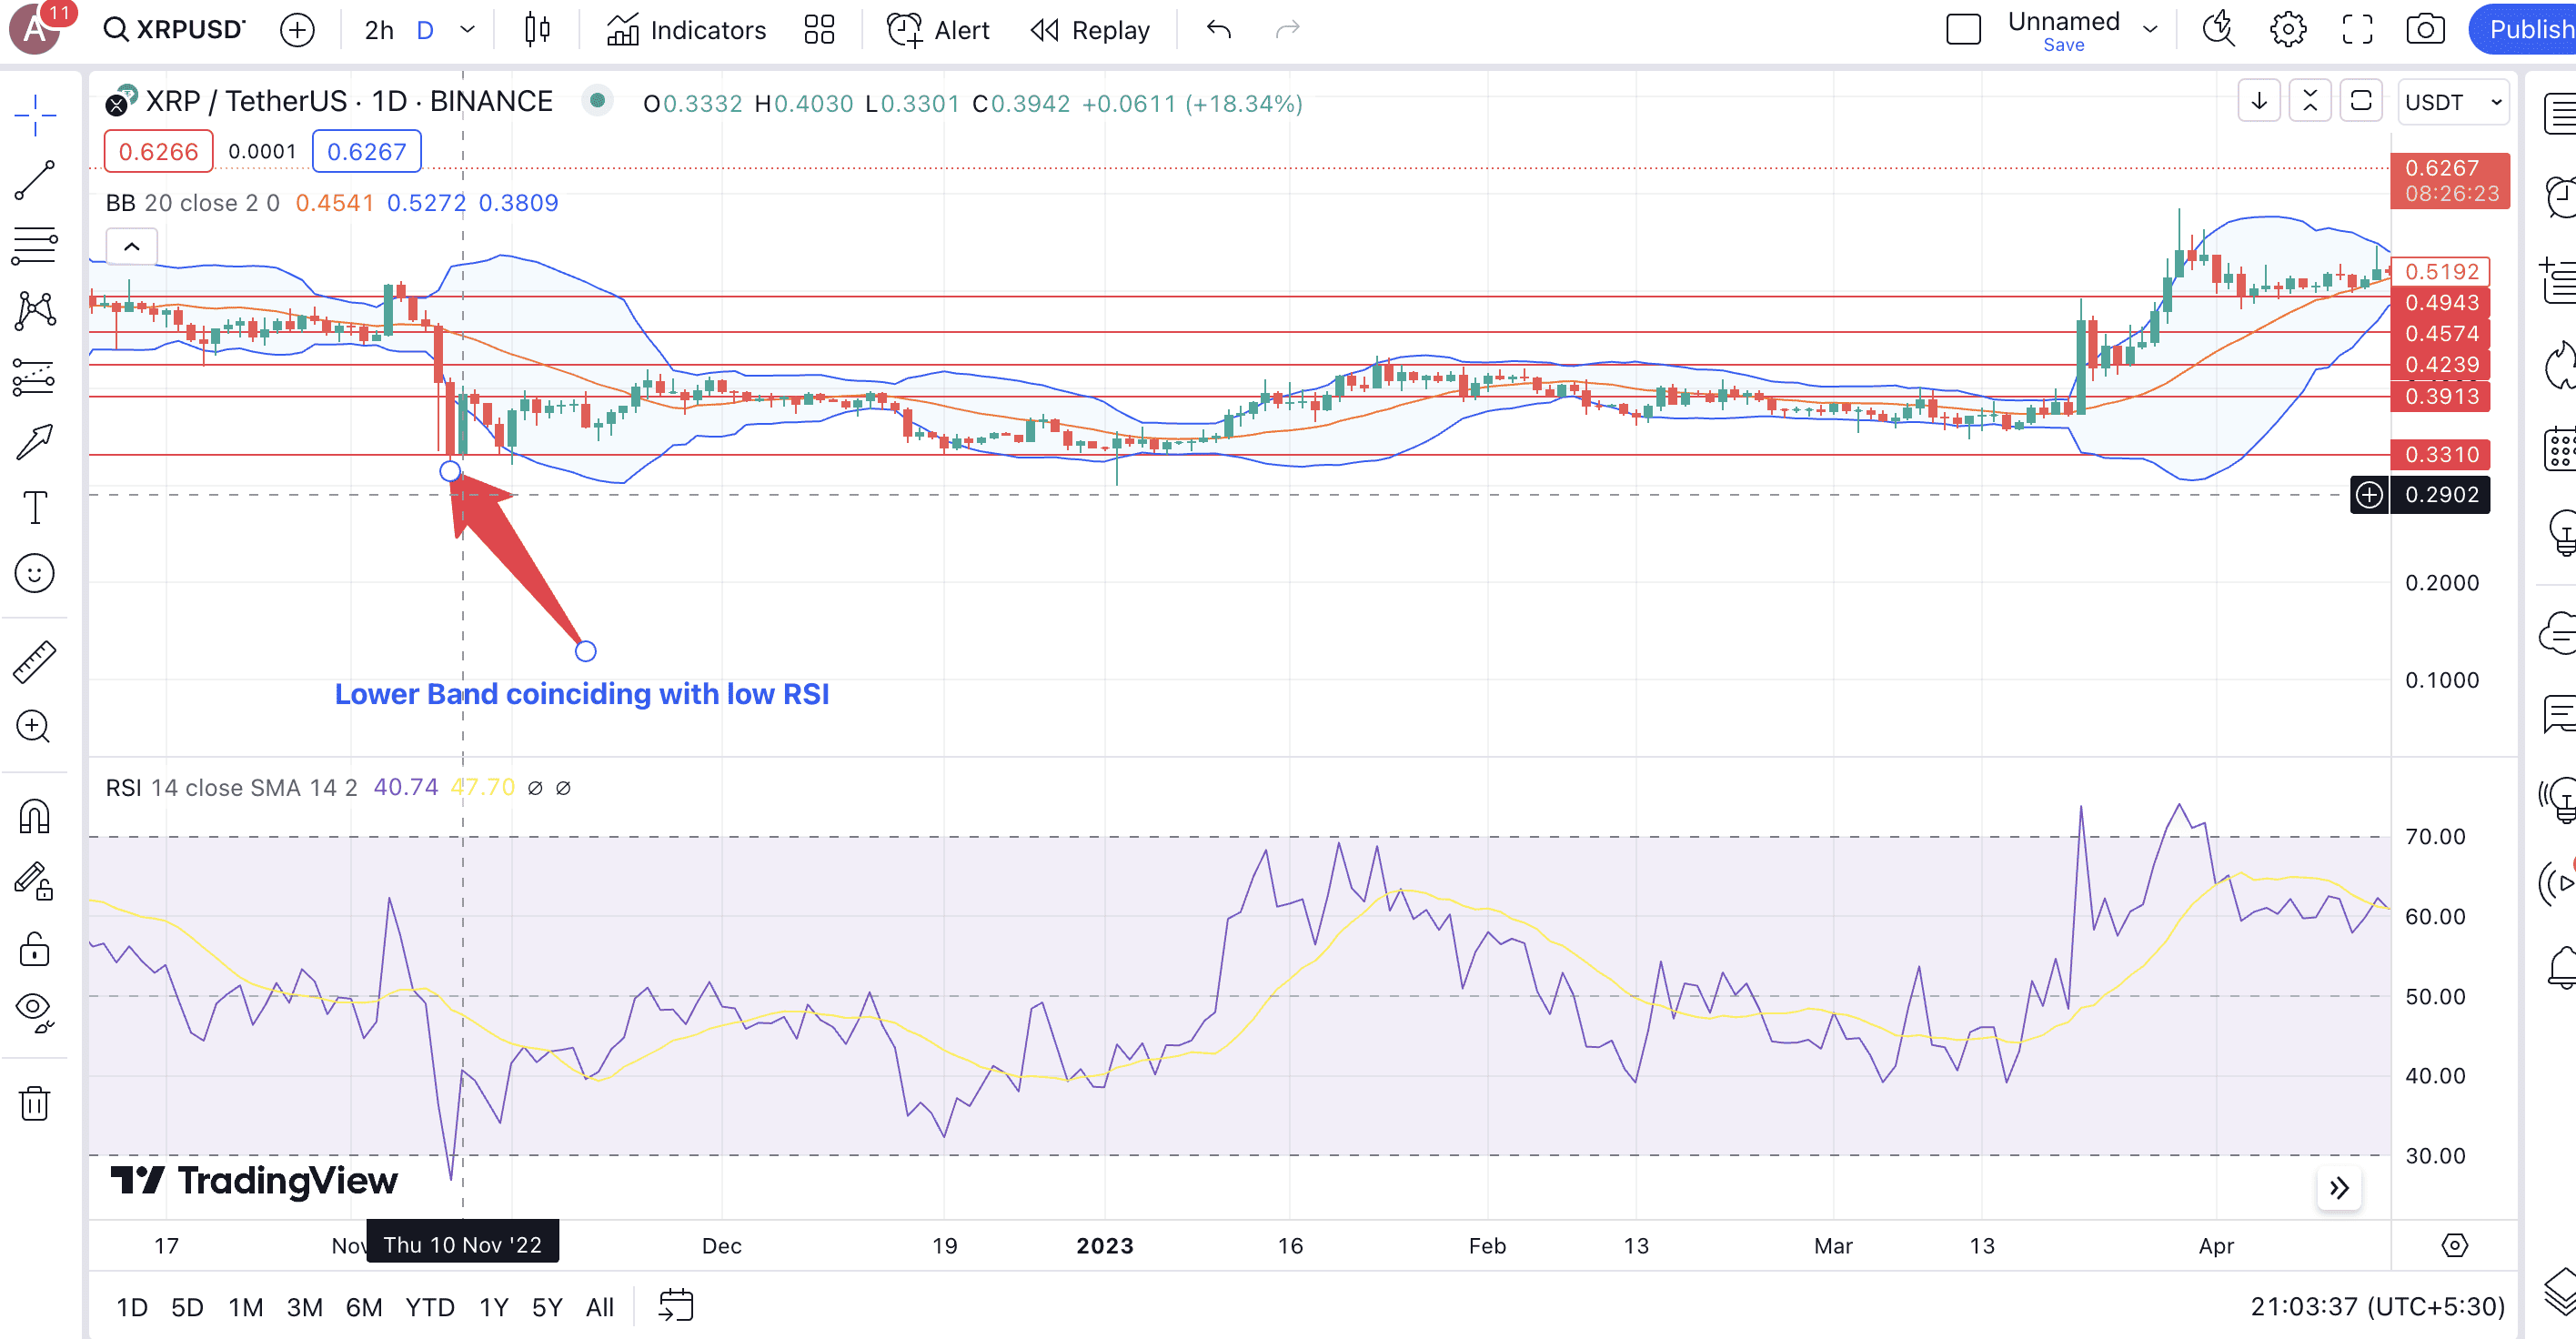
Bollinger Bands with relative strength index (RSI)
This is a phenomenon where you can determine if the price is in the overbought or the oversold region. For instance, if the price has just touched the upper band and even the RSI is below 70 — the overbought region — we can expect a price correction or a retracement. Similarly, the price bouncing off the lower band might actually be in the oversold region if the RSI is between 30 and 40. The idea is to use RSI with the Bollinger Bounce phenomenon.
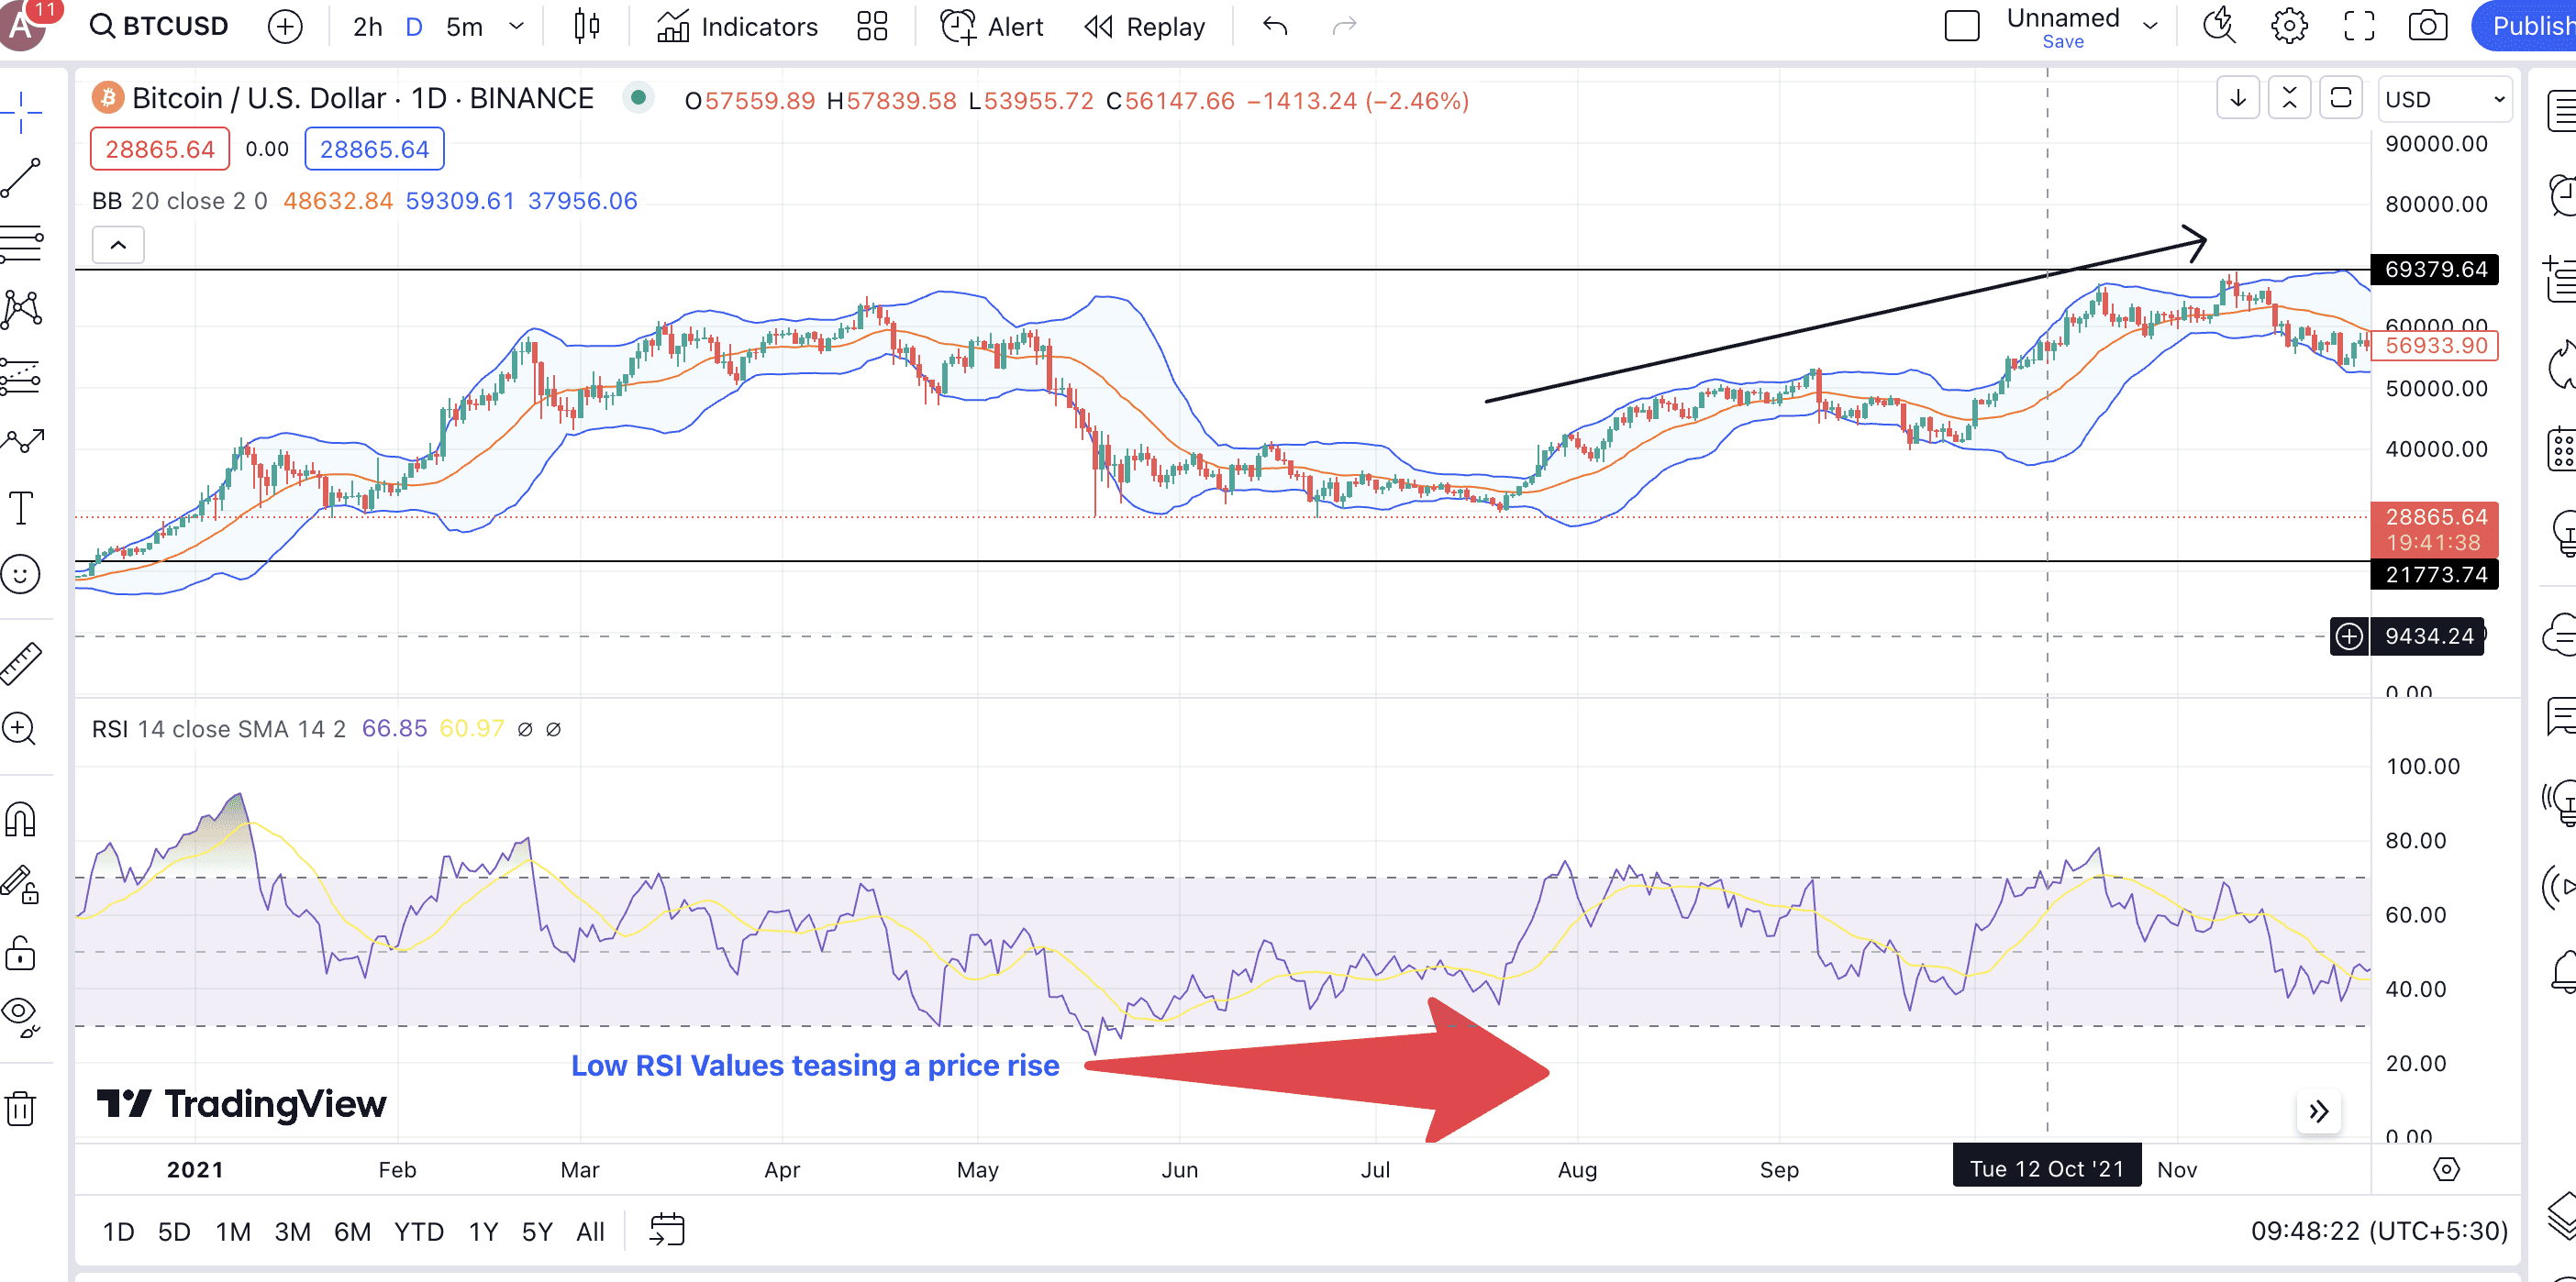
In that case, there might be a price surge on the cards. However, the price and RSI of any crypto asset can hover around the oversold region — lower Bollinger band and RSI levels between 30-40 — for a while before moving higher. The same holds true for the overbought region.
Apart from RSI and MACD, Bollinger Bands can be used with the likes of the Stochastic Oscillator, Volume-Weighted Average Price (VWAP), Parabolic SAR, and more. However, your indicator choice should depend on how familiar you are with the market and the technical analysis tools.
Can you win crypto trades with Bollinger Bands?
Not everybody uses Bollinger Bands. While they are relatively easy to read and analyze, most risk-averse folks hardly prefer relying on volatility to do their bidding. Yet, if used correctly, Bollinger Bands is a powerful technical analysis tool and can help you front-run some of the most explosive breakouts. Still, like any other indicator, they are most effective in the presence of other momentum-analyzing indicators like MACD, RSI, or even reliable candlestick patterns.


