


The Stellar (XLM) price has fallen since November 13 and trades close to a critical horizontal support area at $0.11.
The reaction to it will be paramount in determining the future trend. Will XLM bounce or break down?
Stellar Fails to Sustain Increase
The technical analysis from the weekly timeframe shows that XLM has increased alongside an ascending support line since the start of the year. The upward movement led to a new yearly high of $0.196 in July.
This seemingly caused a breakout above the $0.125 horizontal resistance area. However, the XLM price fell shortly after the high, failing to bounce in the area. Instead, it validated it as resistance and created a long upper wick last week (red icon).
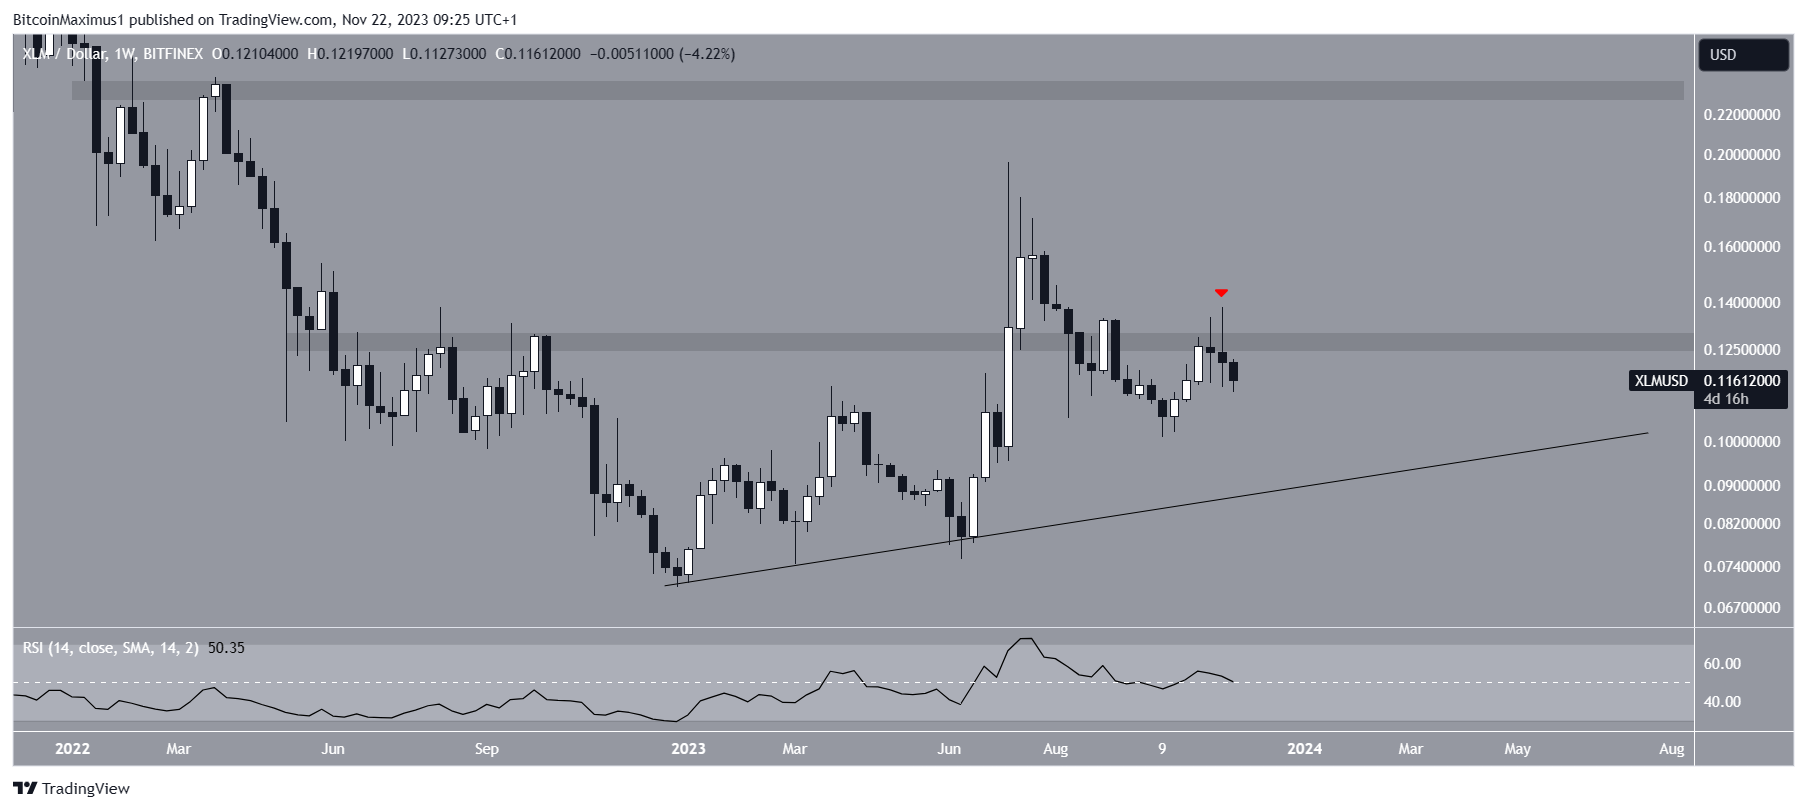
The weekly timeframe Relative Strength Index (RSI) for XLM gives an undetermined reading.
With the RSI as a momentum indicator, traders can determine whether a market is overbought or oversold and decide whether to accumulate or sell an asset.
Bulls have an advantage if the RSI reading is above 50 and the trend is upward, but if the reading is below 50, the opposite is true. The weekly RSI is right at 50, indicating an undetermined trend.
What Do the Analysts Say?
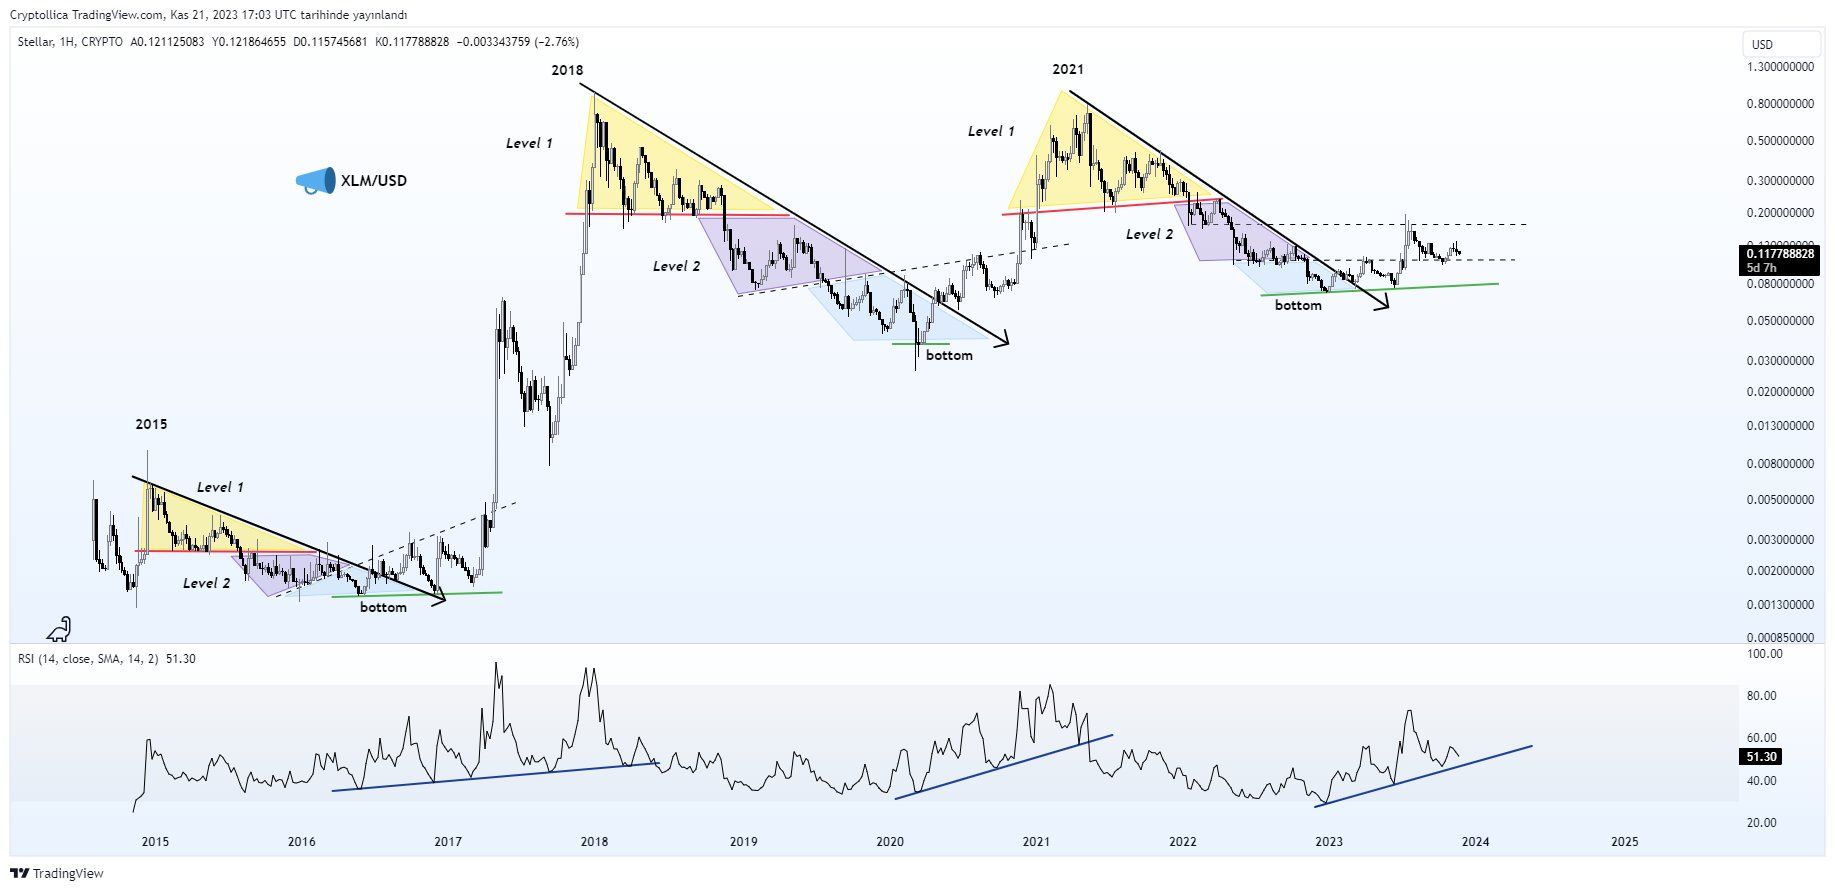
Cryptocurrency traders and analysts on X mostly give positive predictions for the XLM price.
Cryptollica tweeted a long-term fractal, which led to significant upward movements in both previous cycles.
Mister Moon is also bullish but is so because of the short-term movement. He outlined an inverse head and shoulders pattern that could initiate a significant upward movement, tweeting:
Stellar is currently hovering in a key support zone. If price finds support here, we could see the formation of a head and shoulders pattern, a classic signal for potential upward momentum. I’m also observing for a confirmed breakout above the descending channel, which would be my opportunity for a long position entry. Targets are set at the neckline and higher resistance levels. Stay Updated. Trade Responsibly.
It is also worth mentioning that the Stellar team announced that Alchemy Pay joined the Stellar ecosystem to offer ramp services to developers and decentralized applications (dApps). Alchemy Pay will provide users with a cost-effective fiat-to-crypto transition.
XLM Price Prediction: What’s Next?
Similarly to the weekly one, the daily timeframe does not provide a clear direction for the future trend.
On the bullish side, XLM price broke out from a descending resistance trend line on October 20, reclaiming the $0.11 area shortly afterward.
However, the XLM price was rejected by the 0.382 Fib retracement resistance level at $0.138 (red icon), creating a long upper wick. The XLM price has nearly fallen to the $0.11 horizontal support area.
Similarly to the weekly timeframe, the daily RSI is undetermined since it is currently at 50.
Therefore, the reaction to the $0.11 area can be crucial for the future XLM price prediction. A bounce at the support area can initiate a 40% increase to the 0.618 Fib retracement resistance at $0.161.
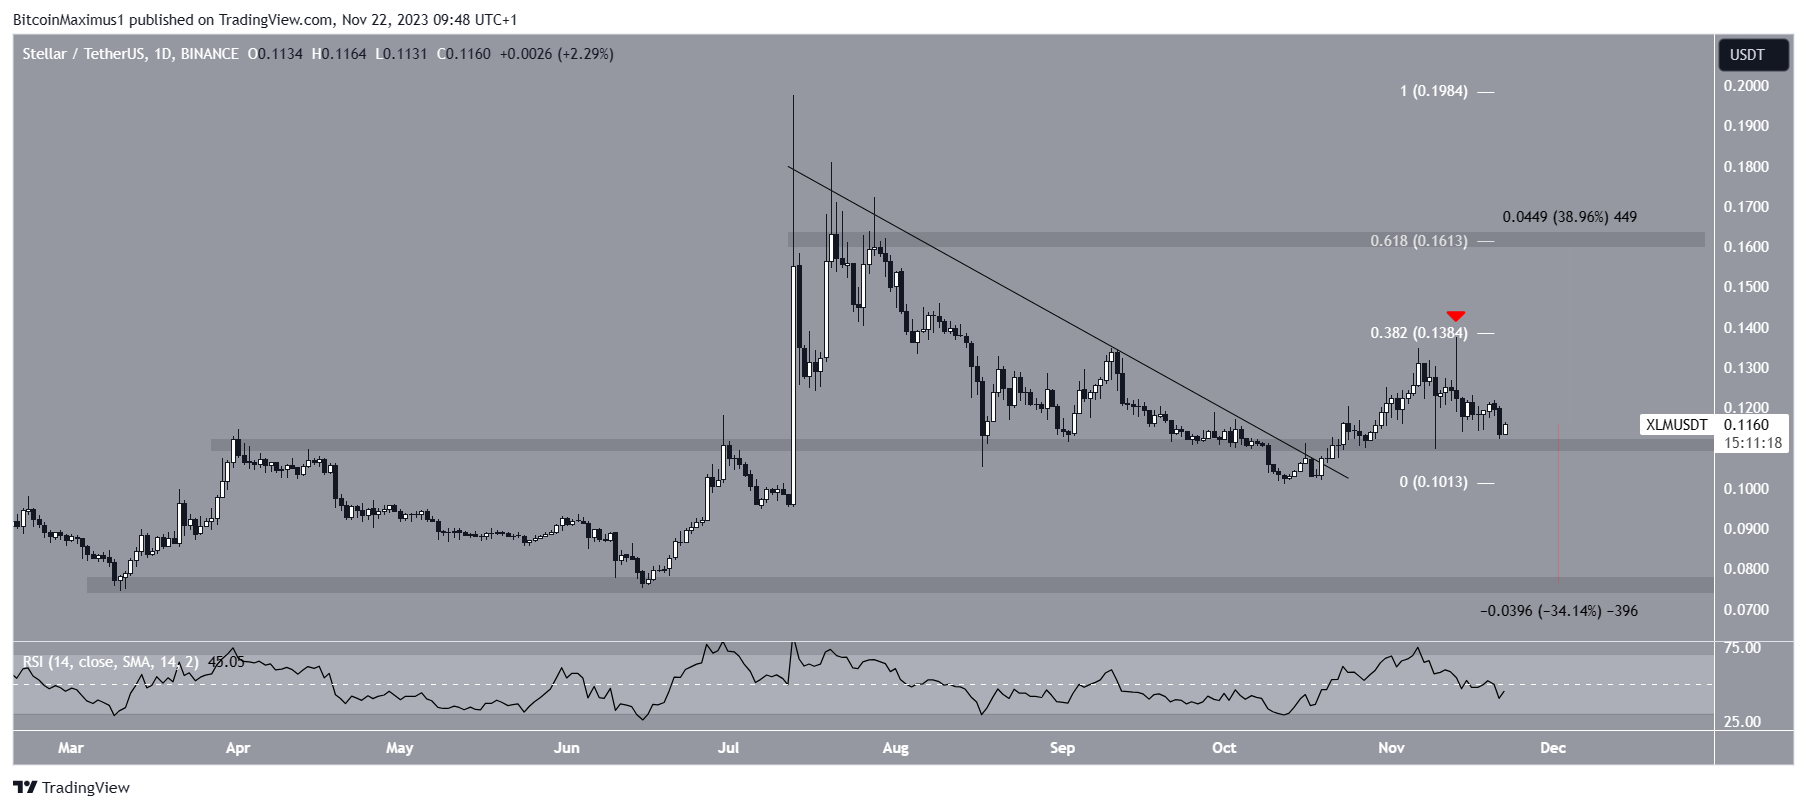
If the XLM price breaks down from the $0.11 area instead, it can catalyze a 35% drop to the next closest support at $0.078.
Interested in AI Trading? 9 Best AI Crypto Trading Bots to Maximize Your Profits
For BeInCrypto’s latest crypto market analysis, click here.


