


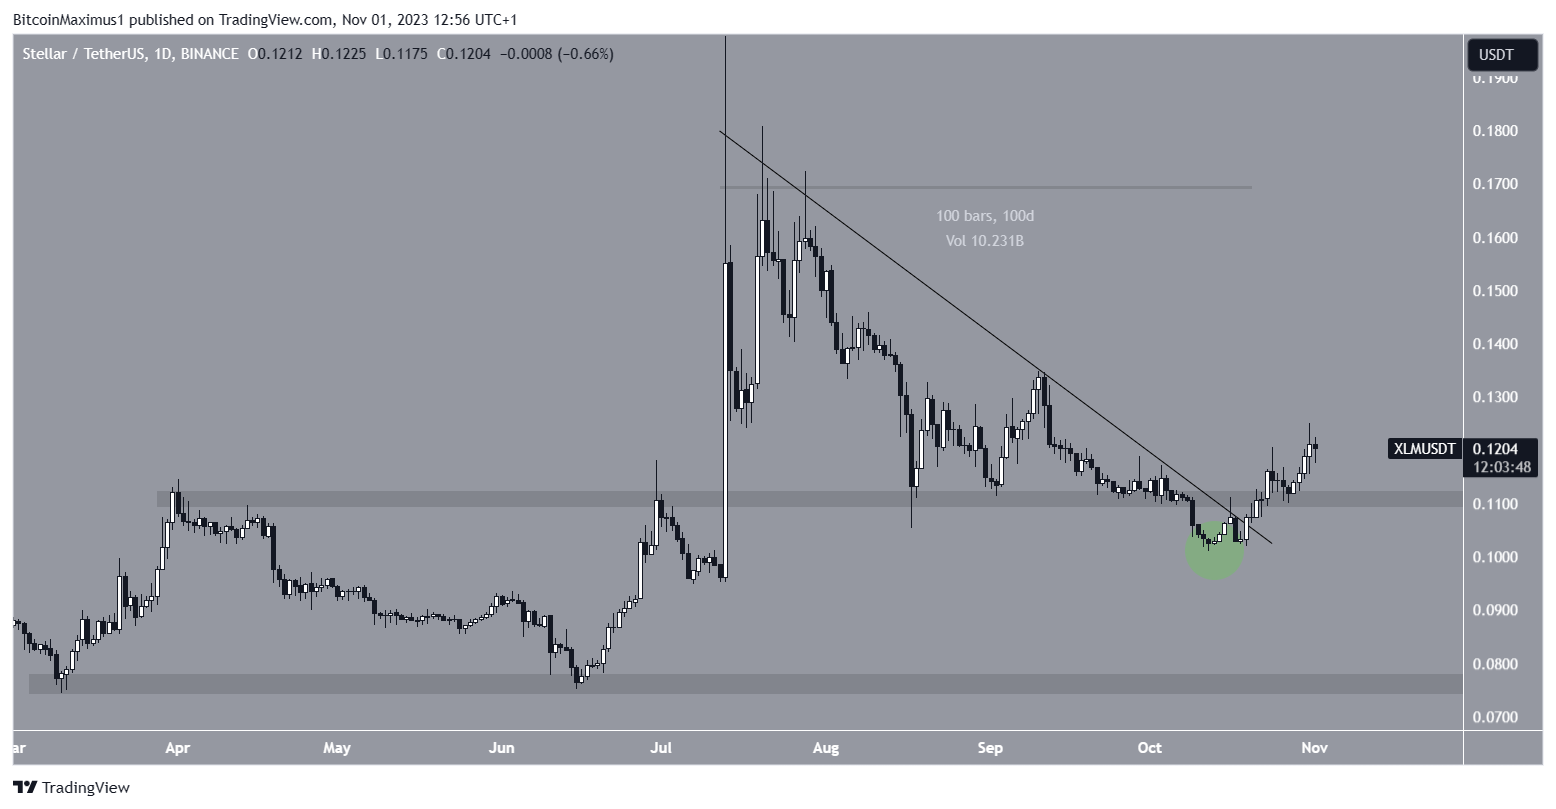
The Stellar (XLM) price broke out from a 100-day descending resistance trendline on October 19.
Four days later, it moved above the $0.110 horizontal resistance area, below which it had previously fallen.
Stellar Reclaims Support After Deviation
The daily timeframe chart shows that XLM has fallen under a descending resistance trendline since July. The decrease led to a low of $0.101 on October 12.
While the drop caused a breakdown from the $0.110 horizontal support area, the price regained its footing shortly afterward.
On October 19, the price broke out from the descending resistance trendline, which had been in place for 100 days.
The XLM price reclaimed the $0.110 horizontal area four days later, rendering the previous breakdown a deviation.
The Stellar Foundation posted its third quarter review yesterday, which shows the strides they have made on its roadmap.
The highlights include the smart contracts platform Soroban inching closer to its mainnet and new features on the Stellar Asset Sandbox, a testing group for asset tokenization on the Stellar Network.
XLM Price Prediction: Has the Reversal Begun?
A closer look at the Relative Strength Index (RSI) from the daily timeframe supports the ongoing increase.
Traders utilize the RSI as a momentum indicator to assess whether a market is overbought or oversold and whether to accumulate or sell an asset.
If the RSI reading is above 50 and the trend is upward, bulls still have an advantage, but if the reading is below 50, the opposite is true.
The daily RSI is above 50 and increasing, both signs of a bullish trend.
Well-known cryptocurrency trader Sherlockwhale also believes that this upward movement will continue since the deviation and reclaim a strong bullish sign.
If the XLM price increases, it can reach the next resistance at $0.160. The resistance is created by a horizontal resistance area and the 0.618 Fib retracement resistance level.
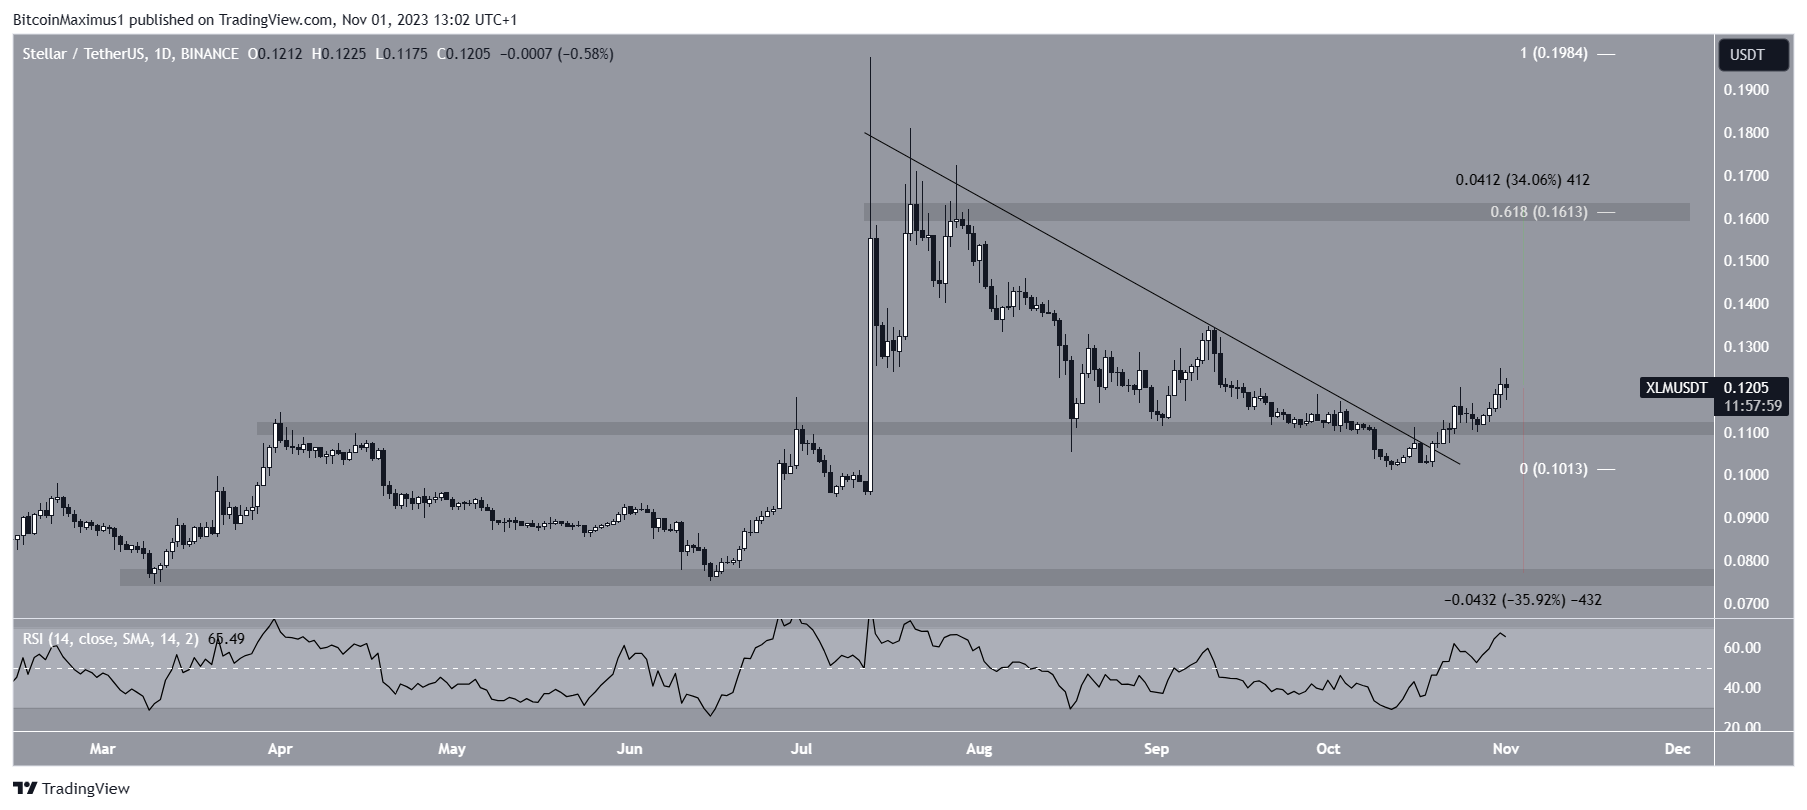
Despite this bullish XLM price prediction, a daily close below the $0.110 horizontal area will invalidate the breakout and reclaim. In that case, a 35% drop to $0.077 will be expected.
Interested in AI Trading? 9 Best AI Crypto Trading Bots to Maximize Your Profits
For BeInCrypto’s latest crypto market analysis, click here.


