


Knowing how to read crypto charts is a big advantage when trading crypto. It will provide a better idea of when to enter or exit a trade, increasing potential profitability. This guide will offer an introduction into the popular technical indicators used for bitcoin and other cryptocurrencies.
How to read crypto charts?
When analyzing a market, there are two primary methods used; technical and fundamental analysis. This guide deals with the technical aspect of chart analysis. Fundamental analysis deals with all aspects of the market including news, events, wider financial and economic impact, and industry conditions, whereas technical analysis deals primarily with charts.
Fundamental analysis attempts to measure an asset’s intrinsic value. It is purely based on objective reasoning. Technical analysis attempts to identify an asset’s patterns and trends. If you want to know how to read crypto charts, you must learn technical analysis.
Trading is one of the most popular ways to earn money with crypto assets; however, some technical knowledge is required before taking the plunge. Cryptocurrency prices are volatile, to say the least, and the trading environment is a lot livelier than forex or stocks. It is best practice to start out simple before trading seriously.
If you want to learn how to read and understand crypto charts, you should definitely take our TA training course, which includes a demonstration from our Senior Analyst. The first video is free to watch for anyone who follows the link and joins our Telegram community.
What is technical analysis?
In essence, technical analysis (TA) is the process of taking a look at current market conditions, in order to predict future movements. It focuses on using a price chart to identify the trend, support and resistance, and momentum to help traders get into and out of higher probability trades.
It operates on the premise that prices move in trends, and these movements generally follow established patterns which are partly attributed to market psychology. This behavioral assumption is based on the belief that traders react in a similar fashion when faced with similar situations.
Technical analysis does not attempt to measure a crypto asset’s underlying value. It employs mathematical indicators and recognized crypto chart patterns in order to predict the probability of a future movement.
Crypto market sentiment: bulls vs bears
Bitcoin and crypto markets move in three directions; upwards, downwards, and sideways. A market that is moving upwards is considered to be bullish, whereas a downwards market is bearish. A sideways market is considered range-bound or consolidating.
A bullish market means that prices of assets are rising or many people are buying. A bullish market means that prices are falling or many people are selling. Bullish and bearish represent trends of how people respond to the market. The single most pertinent saying when it comes to crypto charts is:
“Trend is your friend”
Price direction is far more likely to follow the current trend than to reverse it. Market sentiment also follows this as long term trends do not change very often. Bitcoin bull and bear markets can last a couple of years before they finally reverse.
Within a trend can be several rallies, corrections, or pullbacks where it appears to reverse, only to resume the original trend after a period of time. After all, prices do not move in a straight line. Using crypto price analysis and chart patterns can reveal these potential changes in a trend on different time frames.
Moving averages
Moving averages are one of the more commonly used technical indicators placed on crypto charts. They work by filtering out the ‘noise’ from random short-term price fluctuations and providing a trend-tracking lagging indicator. There are two types of moving averages used on crypto charts, simple and exponential.
Simple and exponential
- SMA – Simple Moving Average uses the arithmetic mean of a given set of prices over a set number of days.
- EMA – Exponential Moving Average uses a weighted average giving greater importance to more recent days making it more responsive to new information.
Moving averages are often used together to provide a better indication of when a trend will reverse. The number of days used to calculate the moving average also differs.
Two of the more commonly used moving averages for crypto charts are the 50 day and the 200 day for identifying longer-term trend patterns and areas of support and resistance.
Adding these two indicators to a Bitcoin price chart can help to identify when prices are at the upper or lower limits of their potential movements and when a major trend reversal is in process.
When these two moving average lines cross, it is a major signal for future price movements and trend changes. They have been aptly named as follows:
- Golden Cross – occurs when the faster moving 50 day crosses above the slower 200 day. Bullish trend reversal pattern.
- Death Cross – occurs when the faster moving 50 day crosses below the slower 200 day. Bearish trend reversal pattern.
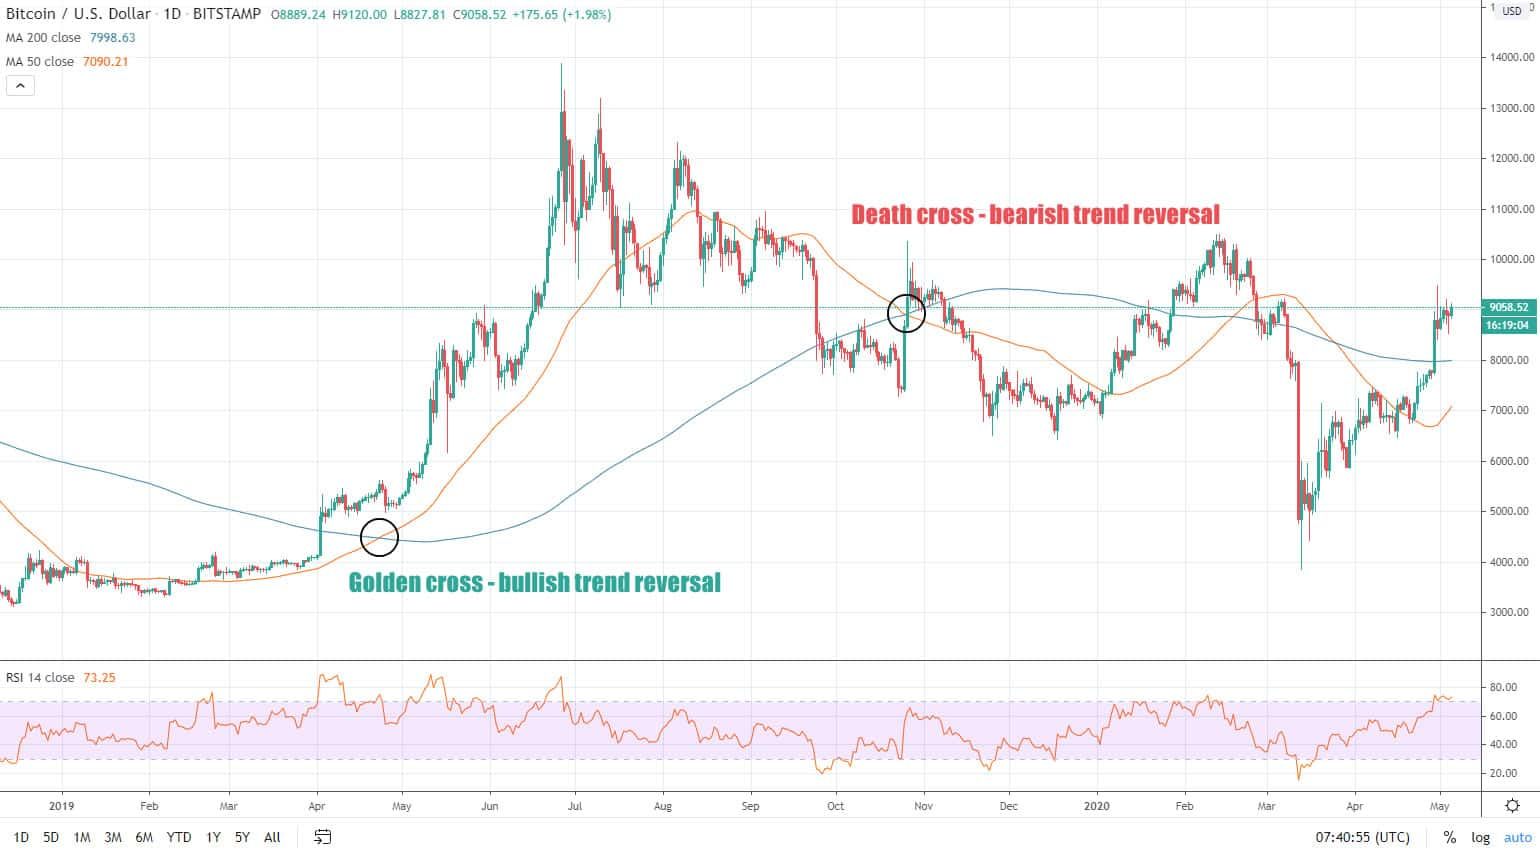
The Bitcoin price chart above shows two instances over the past year or so when these crypto patterns have been observed, and the prices have risen or fallen accordingly in the months that followed. Notice how they are lagging behind the actual bottom and top of the trend, as this confirmation pattern usually comes after the actual reversal.
Moving averages also often provide zones of support and resistance, indicating further momentum in that direction when they are crossed by the price.
Support and resistance
Support and resistance levels are key concepts to understand when dealing with crypto price charts, and are one of the most widely used indicators. Markets oscillate over time so areas where prices pullback are called resistance, while bounces from a downwards movements are at support levels.
When prices repeatedly return to the same level, without breaking above it, the resistance there strengthens. Likewise in reverse, when prices fall repeatedly to the same level but not below it, the support strengthens.
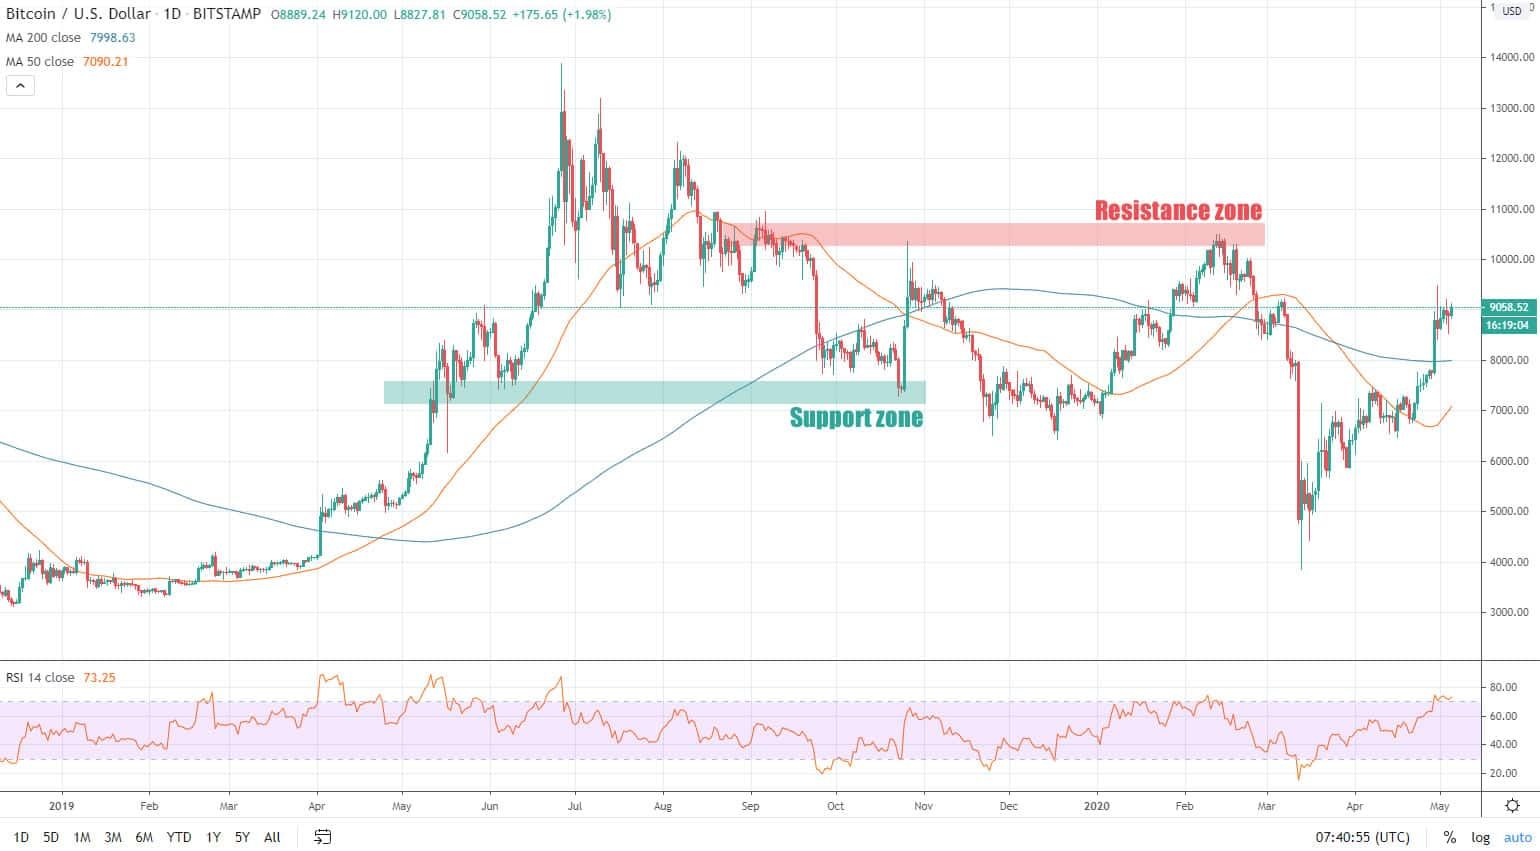
When prices pass through these zones it is known as a breakout, which will then find the next level of support or resistance below or above it.
Knowing how to identify these areas of support and resistance will help to make a better-informed trading decision based on market trends.
Fibonacci
Fibonacci retracement levels are also an important tool for the crypto trader’s armory. In brief, Leonardo Fibonacci was an Italian mathematician who discovered a simple series of numbers that created ratios describing the natural proportions of things in the universe.
The series of numbers gave rise to ratios (0.236, 0.382, 0.500, 0.618, 0.764) that can be applied to crypto charts in order to identify retracement levels. These levels are then used to predict areas of support and resistance.
Fibonacci retracement levels work on the theory that after a big price move in one direction, the price will retrace or return part of the way back to a previous price level, before resuming in the original direction.
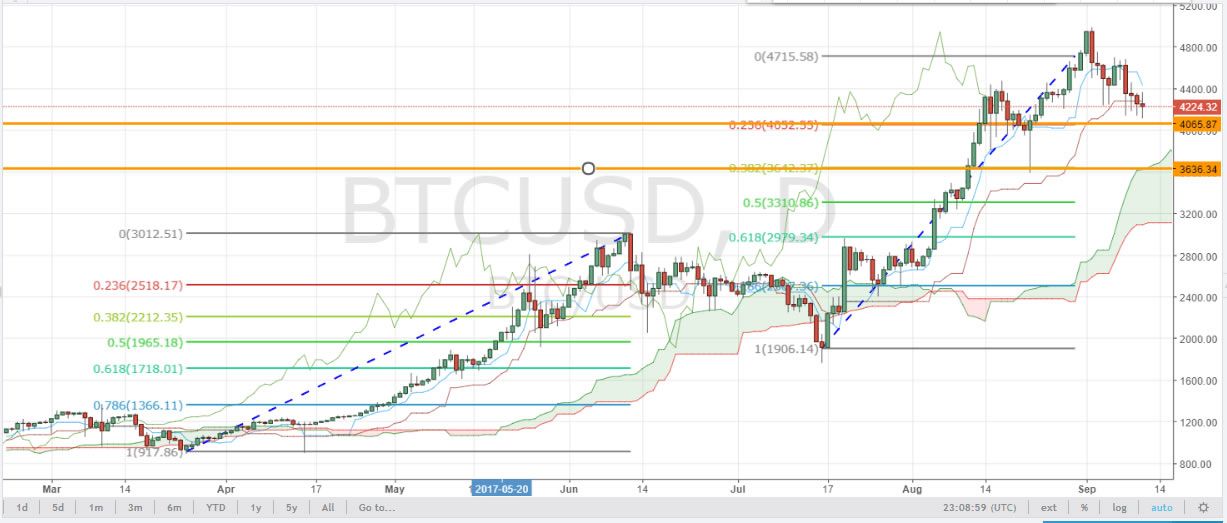
The chart above shows Fibonacci levels in action during Bitcoin’s 2017 rally.
Other technical indicators
Aside from moving averages and Fibo levels, there are a number of other technical indicators that can be applied to crypto charts for crypto graph analysis.
RSI
Relative Strength Index is a measure of whether an asset is overbought or oversold. It is used to help traders measure the strength of the market. The indicator usually runs below the chart and is scaled from 1 to 100, a reading below 30 indicates oversold conditions while above 70 signals that the asset is overbought.
MACD
Moving Average Convergence Divergence is another trader’s favorite which combines a number of moving averages to get the difference for more accurate trend identification. There is also a histogram that represents the difference between the fast and slow moving average.
Stochastic
This simple momentum oscillator measures the degree of change between prices from one closing period to predict the continuation of the current direction trend. It can also be used to tell if a crypto asset has been oversold or overbought.
Parabolic SAR
Stop and Reversal places dots on a chart above or below the candle that indicates potential reversals in price movement, and the end of a trend.
Bollinger Bands
This tool measures market volatility so when prices are sideways the bands are close together and when they’re pumping or dumping the bands move apart. The upper and lower bands also serve as resistance and support levels.
There are countless other indicators such as Ichimoku Kinko Hyo (IKH), Average Directional Index (ADX), and the Chaikin Oscillator, but they are beyond the scope of this guide.
There are also indicators that are specific to Bitcoin such as exchange volumes and liquidity, Hash Ribbons, Puell Multiple, Dynamic Range NVT Signal, Metcalfe’s law, UTXO metrics, and BTC Energy Value Oscillator. However, they too are beyond the basics of chart reading and fall into the realms of on-chain metrics and analysis.
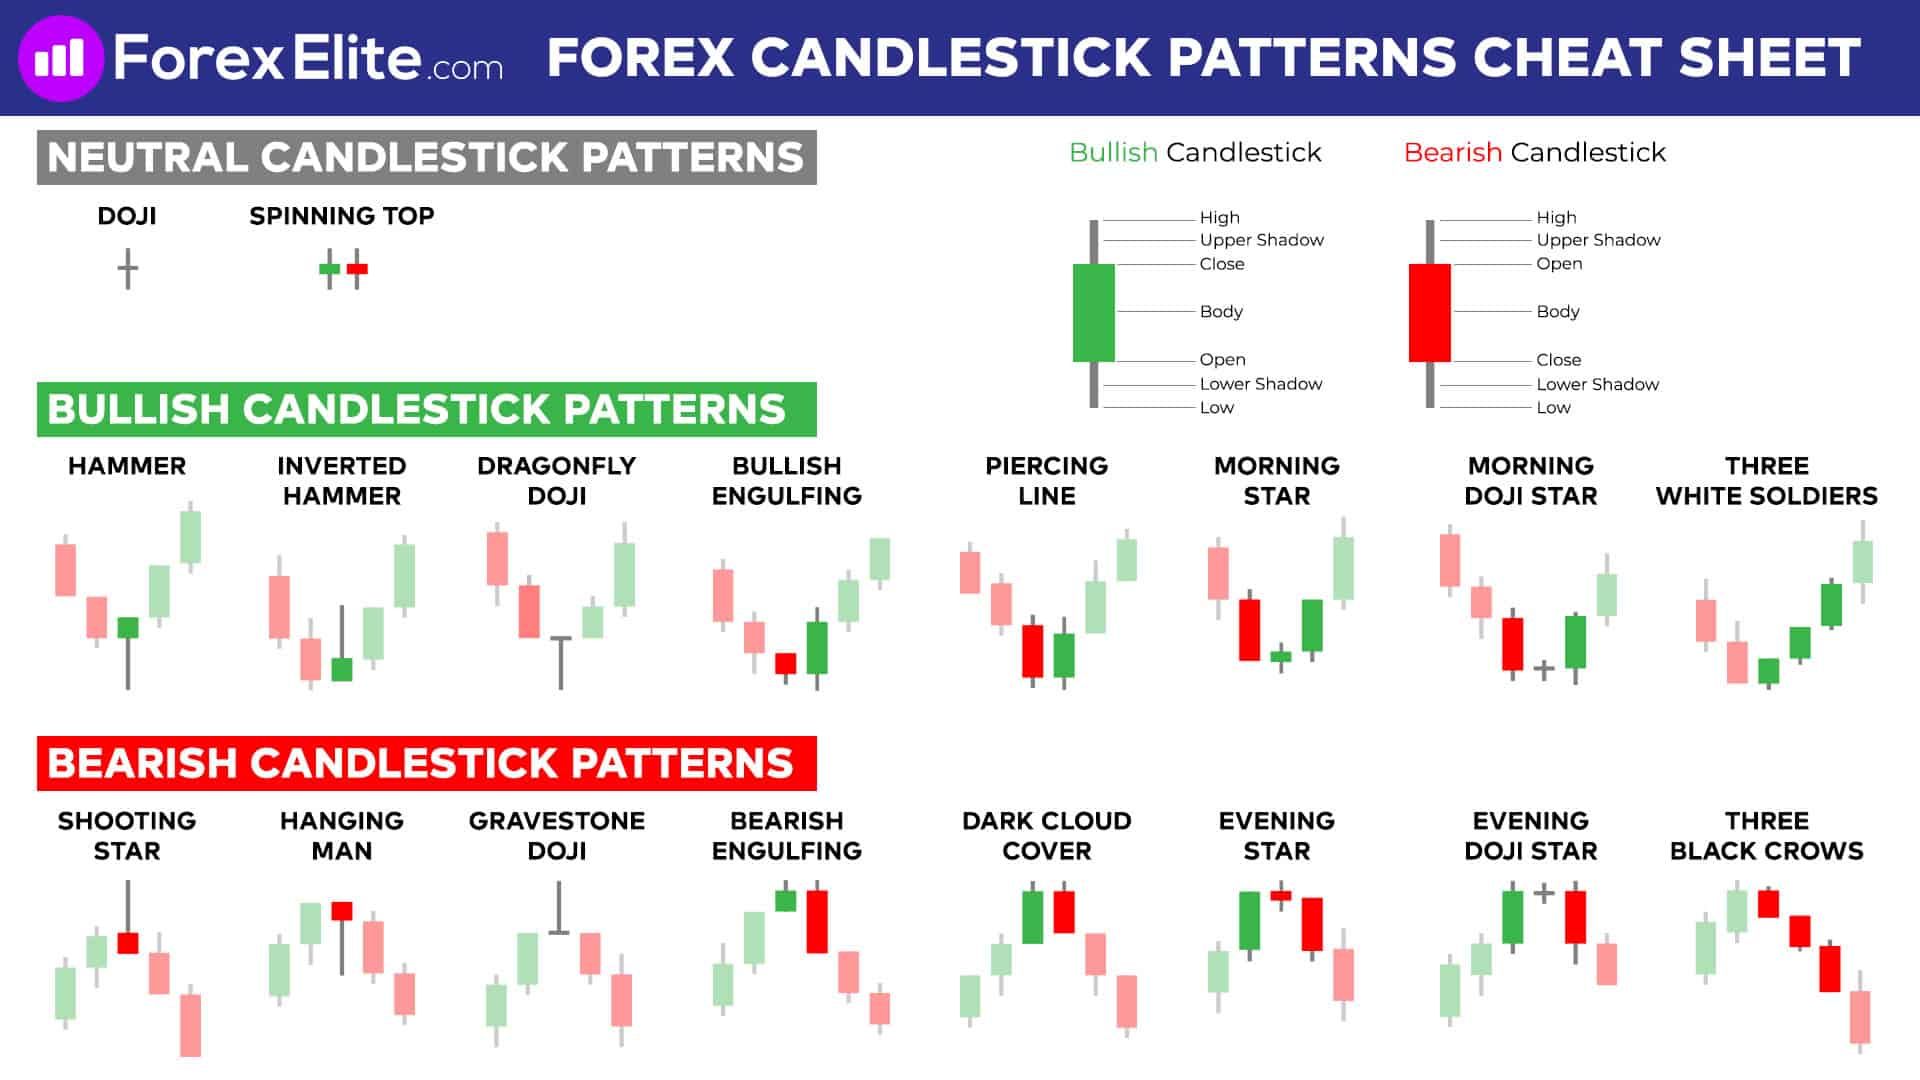
Candlesticks
A basic understanding of the Japanese candlesticks that make up crypto charts is also an advantage. Each candle is used to describe the price action during the given time frame. The solid portion of the candle is called the body and the extended stalks, the wick. They are formed using the open, high, low, and close prices of the chosen time (OHLC).
- Open — the first trade made during the specified time period.
- High — the highest traded price.
- Low — the lowest traded price.
- Close — the last trade made during the specified time period.
Candlesticks represent a time frame. This means that if the chart is for one hour, each candlestick body will show the opening and closing price for that hour. The candlestick’s wicks at the top and bottom show the highest and lowest price reached during that one hour period.
There are many different patterns and signals that these candles make which can also help determine price direction when combined with some of the technical indicators described above. The infographic below shows some of these common patterns.
Time Frames
Time frames are a very important aspect of reading a crypto chart. A chart can show a snapshot of the market in a range of different time frames which will change what the technical indicators are signaling. This is why it is very important to trade crypto using multiple time frames.
Popular charting software will usually display charts in time frames from 1 second up to one month. The time-frames you use will depend on what type of trader you are. Scalpers looking for tiny quick profits will trade on shorter time frames of a minute or less, while day traders may use the 15 minute, one hour and four hour charts. Long term traders and hodlers will only be interested in the daily, weekly, and monthly charts.
Reading charts on different time frames will give a much better view of the bigger picture and overall trend. Remember that saying “trend is your friend”!
If you want an advanced charting platform, why not try TradingView? Receive a $10 bonus for a monthly subscription and a $30 bonus for an annual subscription, after your first purchase on TradingView.
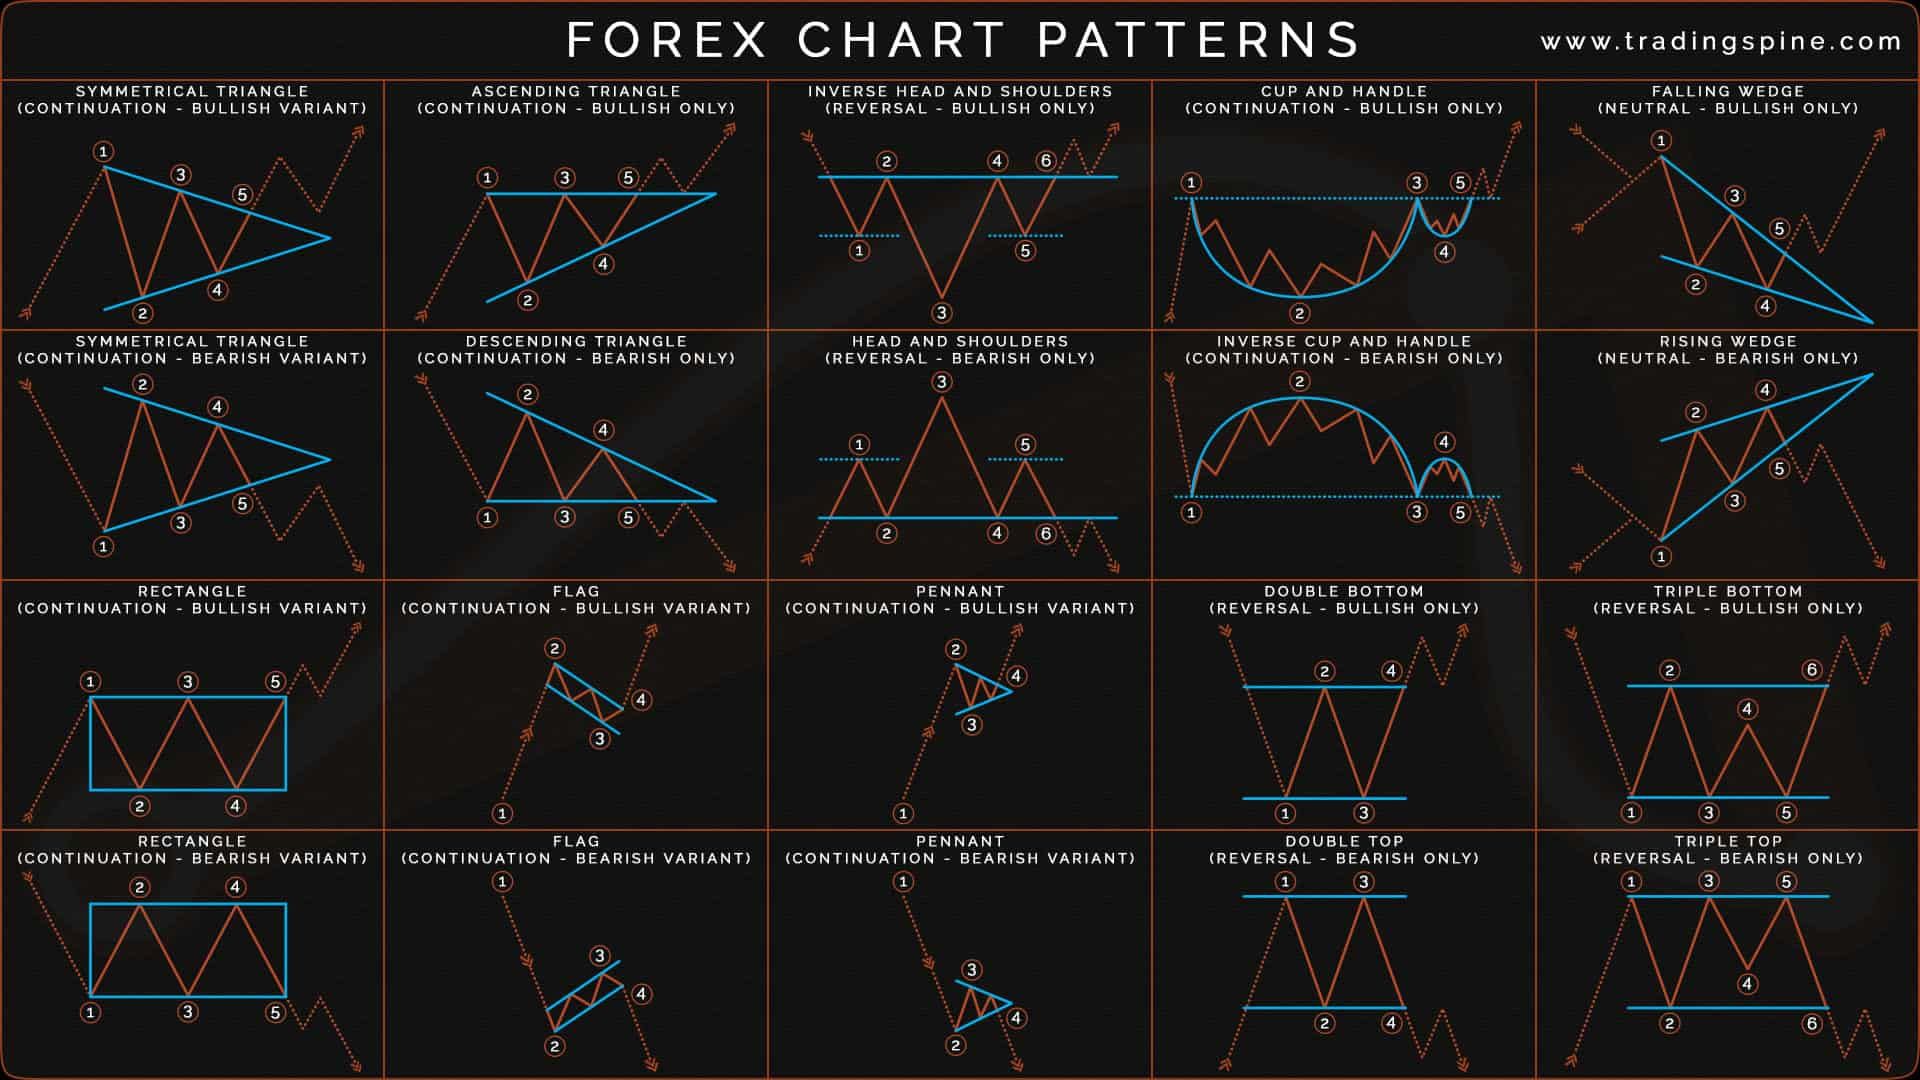
Crypto Chart Patterns
Patterns often emerge in crypto charts that lead to more predictable future price movements. These formations within the chart can be used to identify trend reversal, trend continuation, and bullish or bearish momentum.
Some of the more commonly recognized chart patterns for Bitcoin and cryptocurrencies are as follows:
- Reversal Patterns: Head and Shoulders, Inverse H&S, Cup and Handle, Double Top/Bottom, Rising and Falling Wedge.
- Continuation Patterns: Pennants, Rectangles, Flags, Rising and Falling Wedge.
- Bilateral Patterns: Symmetrical Triangles, Ascending or Descending Triangle.
A bilateral chart pattern is one that may result in a price breakout in either direction.
Many of the chart patterns used to trade forex are also applicable to crypto.
There are other ways to identify whether a trend is about to reverse or will continue.
- Higher high, higher low: A bullish pattern that indicates prices are still climbing and the uptrend is intact. Prices continue to beat their previous highs and pullbacks are not as low as ones before.
- Lower high, lower low: A bearish pattern that indicates prices are falling and the downtrend is intact. Prices cannot beat their previous highs, and new lows are formed on each pullback.
Chart patterns are important
These are very important to observe when trading Bitcoin and cryptocurrencies as they provide the bigger picture with regards to the overall trend.
Divergences can be observed when there is a disagreement between indicators and prices or chart patterns. In an uptrend, this occurs when price makes a higher high but the indicator does not, and in a downtrend, divergence occurs when price makes a lower low, but the indicator does not. When divergence is spotted, there is a higher probability of a price retracement.
There are other crypto chart patterns such as Elliot Waves which work on the natural rhythm of crowd psychology in the market, manifesting itself in waves. There are also fractals, which are naturally repeating patterns that are observed frequently on Bitcoin charts, however, these are beyond the scope of this article.
Order book and market depth
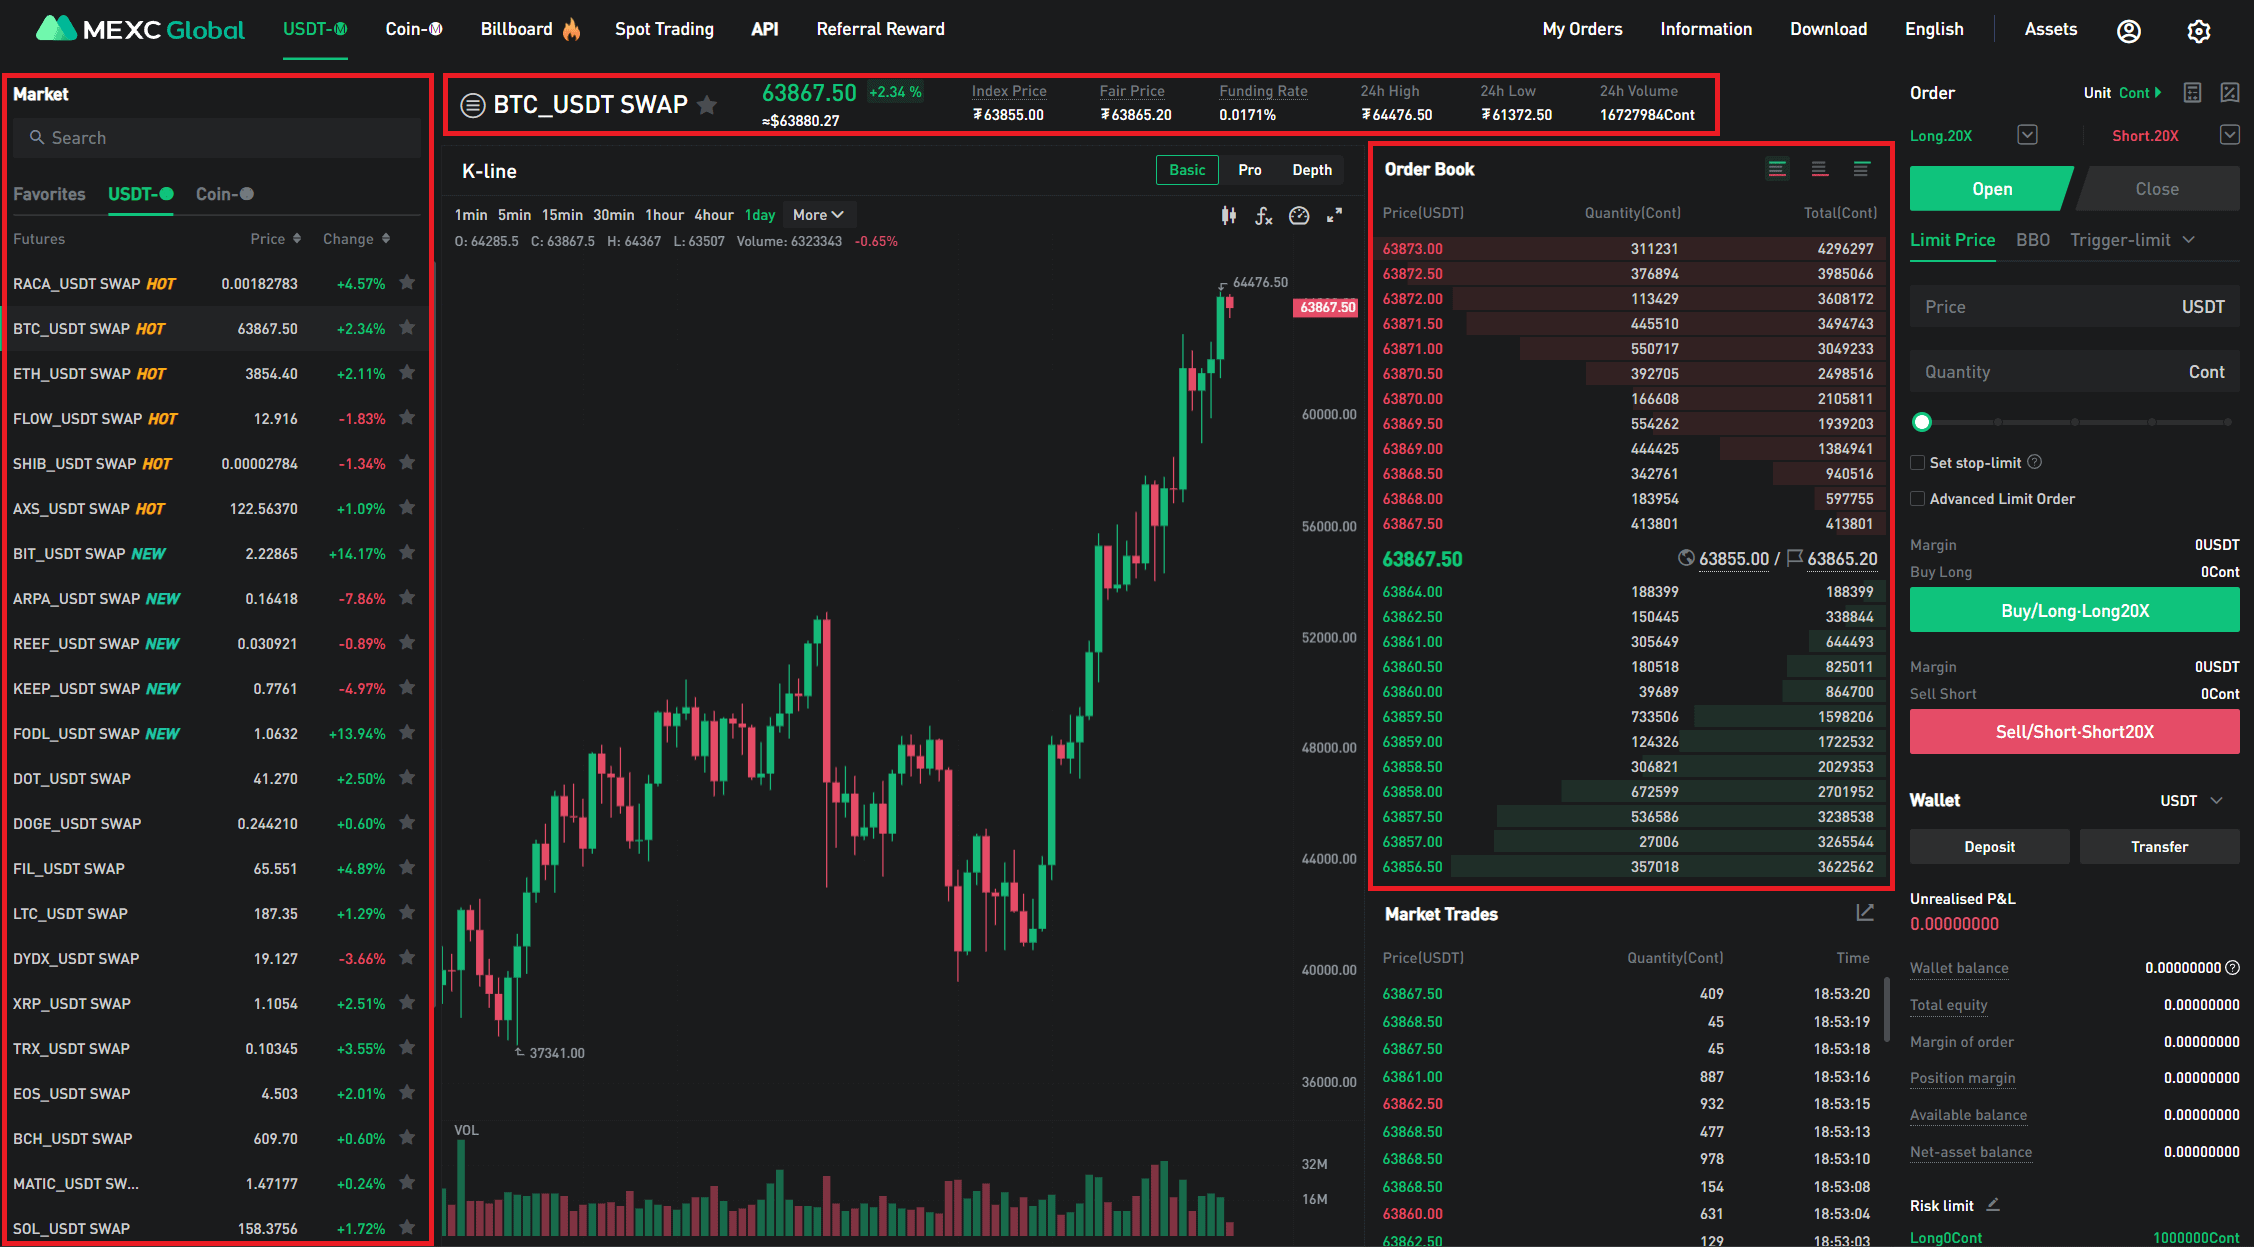
An order book is a collection of active buy and sell orders. Every exchange has a unique order book. An order book separates orders into bids (buy orders/ green) and asks (sell orders/ red). “Bids” are the prices that traders are willing to pay, while “Asks” (a.k.a. “Offers”) are the prices that traders are willing to sell at.
- Each order in the order book has a price and quantity.
- The order book organizes open orders by price — each unique order price is assigned a row.
- The quantity (amount to buy or sell) of each order at that price is combined in that row.
- The order book provides traders with insight into the market’s supply and demand forces by listing open orders by price and indicating their combined quantities.
Typically, the order book is divided into three columns: price, quantity, and total quantity. The market depth chart represents the order book, because the data on the depth chart is derived from the order book. They both display the same information. In our example, the market depth chart is the red and green horizontal bars behind the order book.
When looking for the bid-ask spread, buy and sell walls, or support and resistance levels, traders may prefer to use the depth chart or the order book. They are both great ways to read crypto charts and create an informed trading strategy.
Crypto Chart Resources
There are countless resources online for crypto charting, bitcoin price analysis and crypto graph analysis:
| Tradingview.com | Free charting software with basic indicators (more on subscription), also has input from top analysts. |
| Babypips.com | Geared for forex trading but has great educational tools to learn the basics of technical analysis and reading charts. |
| Twitter.com | Follow some of the top crypto analysts in the industry and get industry insights. |
| Beincrypto.com | The best TA in the industry provided daily. |
Easier said than done
Learning how to read crypto chart patterns is easy, most of the research has already been done. However, implementing what you learn is much more difficult. No trader uses every single technical indicator, nor every indicator for every trading instrument. Some prefer to use moving averages or the RSI with certain financial markets (e.g., futures or options).
The information on a crypto graph is often overwhelming for new traders. Reading crypto charts alone is not enough. You have to get your hands dirty and find the tools that work best for your trading strategy. Implement a plan, stick to it, and don’t marry your trades; it’s a numbers game. No one is the perfect trader.


