Shiba Inu’s (SHIB) price increased by 5% in the last 24 hours, offering the token holders a glimmer of hope. As the price moves higher, so are some other indicators.
However, the uptick in some of these metrics may not be able to validate a consistent hike in SHIB’s price. This on-chain analysis explains the whys and hows of the conclusion.
Shiba Inu Encounters Rising Discussions, Falling Volatility
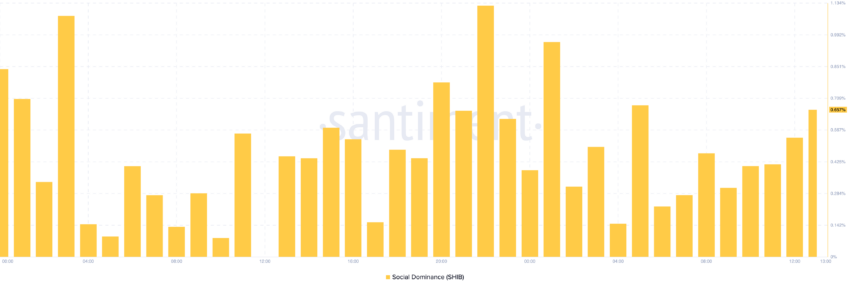
According to Santiment, Shiba Inu notes a surge in social dominance. In crypto, social dominance refers to the rate of discussion about an asset compared to other cryptocurrencies in the top 100.
When this metric’s ratio increases, it implies that market attention is shifting toward the cryptocurrency involved. If backed by buying pressure, this usually leads to a price increase. However, a drop in social dominance implies otherwise and indicates that the broader market is looking elsewhere to converse.
Shiba Inu’s social dominance was 0.53% on July 26. However, as of this writing, it has increased to 0.65%, suggesting that the number of posts in the media relating to the project outpaces several other top cryptos.
Read more: 12 Best Shiba Inu (SHIB) Wallets in 2024

Typically, this rise should foster demand for the token. However, another indicator reveals that SHIB is not in the right state to jump much higher than it has.
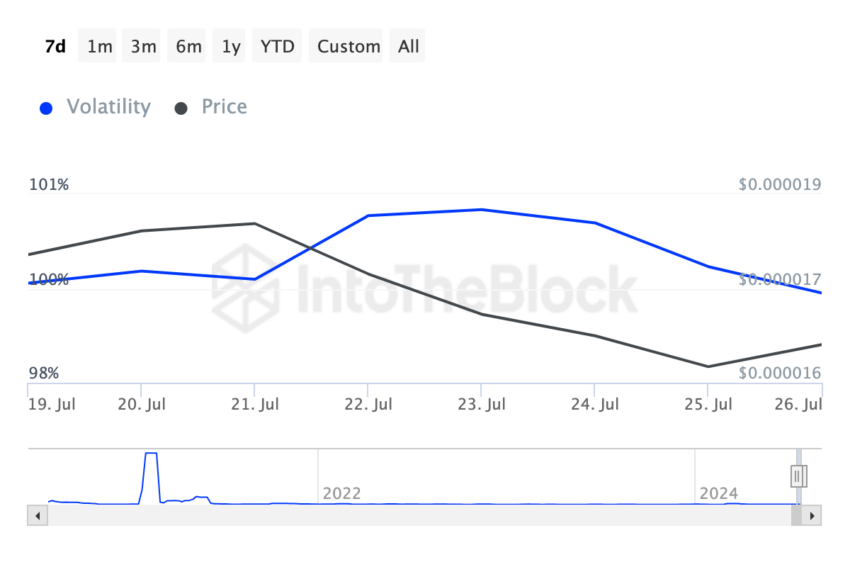
The indicator in question is Shiba Inu’s volatility. Large spikes in volatility point to notable high swings or extremely low swings depending on the sentiment and action taken in the market.

As for SHIB, volatility is at a seven-day low, indicating likely stagnation in the price action. If this continues, SHIB’s price may find it challenging to exit the swing low and swing high between $0.000016 and $0.000017.
SHIB Price Prediction: It Continues to Struggle
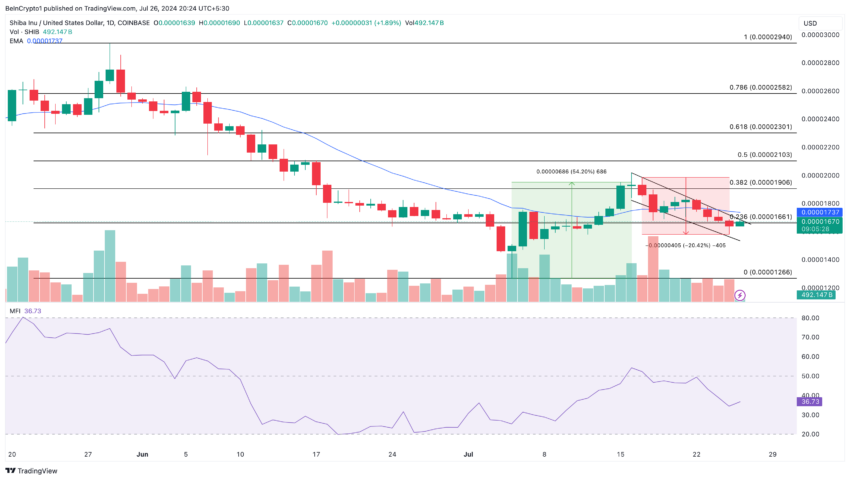
SHIB price recorded an impressive 54.20% increase between July 5 and 15. However, the daily chart shows that the price has since lost 20% out of those gains.
Currently, SHIB trades within a descending channel between $0.000015 and $0.000019. However, the token trades below the 20 EMA (blue), which measures the short-term trend.
Trading below this indicator suggests a bearish trend for Shiba Inu. Should bulls fail to drive the price higher than the indicator’s position, SHIB may continue to trade below the $0.000019 resistance.
Furthermore, the Money Flow Index (MFI) is below the midpoint, indicating that the token has yet to recover from its recent downtrend fully. The MFI measures the flow of money in and out of a cryptocurrency.
If the reading moves up, it means a good amount of liquidity flows into the crypto. However, when it is at a low level, it suggests decreased demand, which is the case with SHIB. By the look of things, SHIB may continue trading around $0.000016.
Read more: Shiba Inu (SHIB) Price Prediction 2024/2025/2030

However, if volatility becomes high, the price action may change. The token might rise to $0.000021 if high volatility comes with increased buying pressure. If market participants decide to sell amid high volatility, the value could head toward $0.000012.
Disclaimer
In line with the Trust Project guidelines, this price analysis article is for informational purposes only and should not be considered financial or investment advice. BeInCrypto is committed to accurate, unbiased reporting, but market conditions are subject to change without notice. Always conduct your own research and consult with a professional before making any financial decisions. Please note that our Terms and Conditions, Privacy Policy, and Disclaimers have been updated.


