


The Stellar (XLM) price broke down from a long-term descending triangle pattern on October 9.
Before the breakdown, the Stellar price had traded inside the triangle since July 13. Can we expect a further decline in the XLM Price?
Stellar Falls Below Long-Term Support
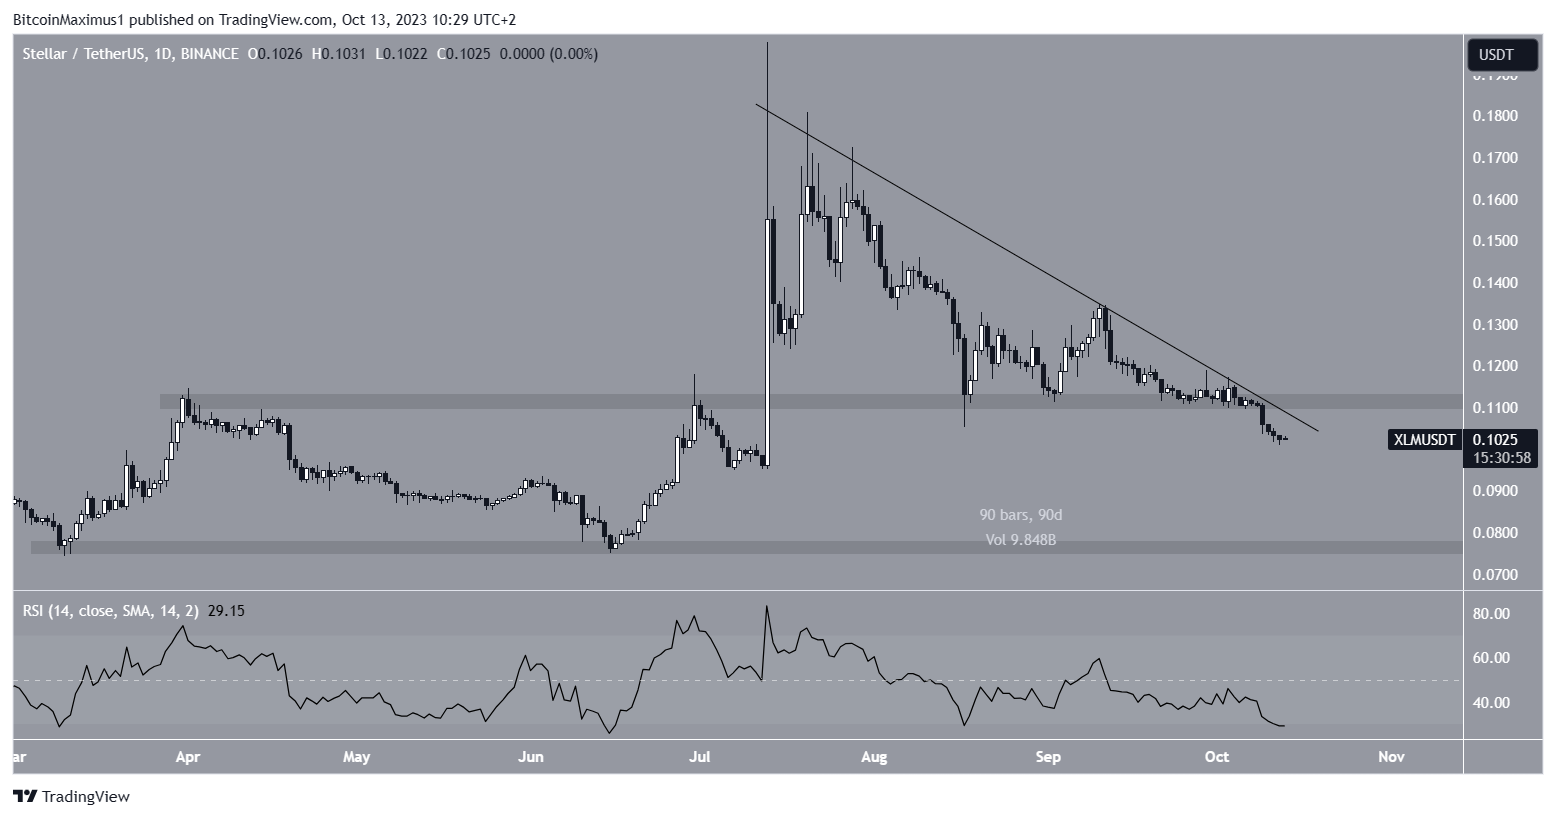
The daily time frame technical analysis for the XLM price shows a downward movement ongoing since July 13. During this period, the price has fallen under a descending resistance trendline.
Throughout the drop, the altcoin bounced above the $0.110 area several times. This created a descending triangle, considered a bearish pattern.
The Stellar price broke down from the $0.110 area on October 9. This was confirmed with a daily close below the $0.110 horizontal area. So far, the price has reached a low of $0.101 on October 12, which is a new 90-day low.
The daily RSI is bearish. Traders use this momentum indicator to assess whether a market is overbought or oversold. This determines whether to accumulate or sell an asset.
If the RSI reading is above 50 and the trend is upward, bulls have an advantage, but if the reading is below 50, the opposite is true.
The RSI is below 50 and falling, both signs of a bearish Stellar price trend.
In the news today, Stellar Development Foundation and Certora have introduced advanced security support for Soroban, the smart contract platform on the Stellar network.
Notably, Soroban is the first WebAssembly (WASM) – powered platform to receive Certora’s backing, a tool traditionally associated with the Ethereum Virtual Machine (EVM).
XLM Price Prediction: Where Will Breakdown Lead To?
Another factor that could have contributed to the breakdown was the ascending parallel channel (white) inside the triangle. Since channels contain corrective movements, the increase inside it was expected to reverse and lead to a drop eventually.
A decrease that travels the entire triangle’s height will take the XLM price just below the $0.076 horizontal support area. This will be a decrease of 30% from the current price.
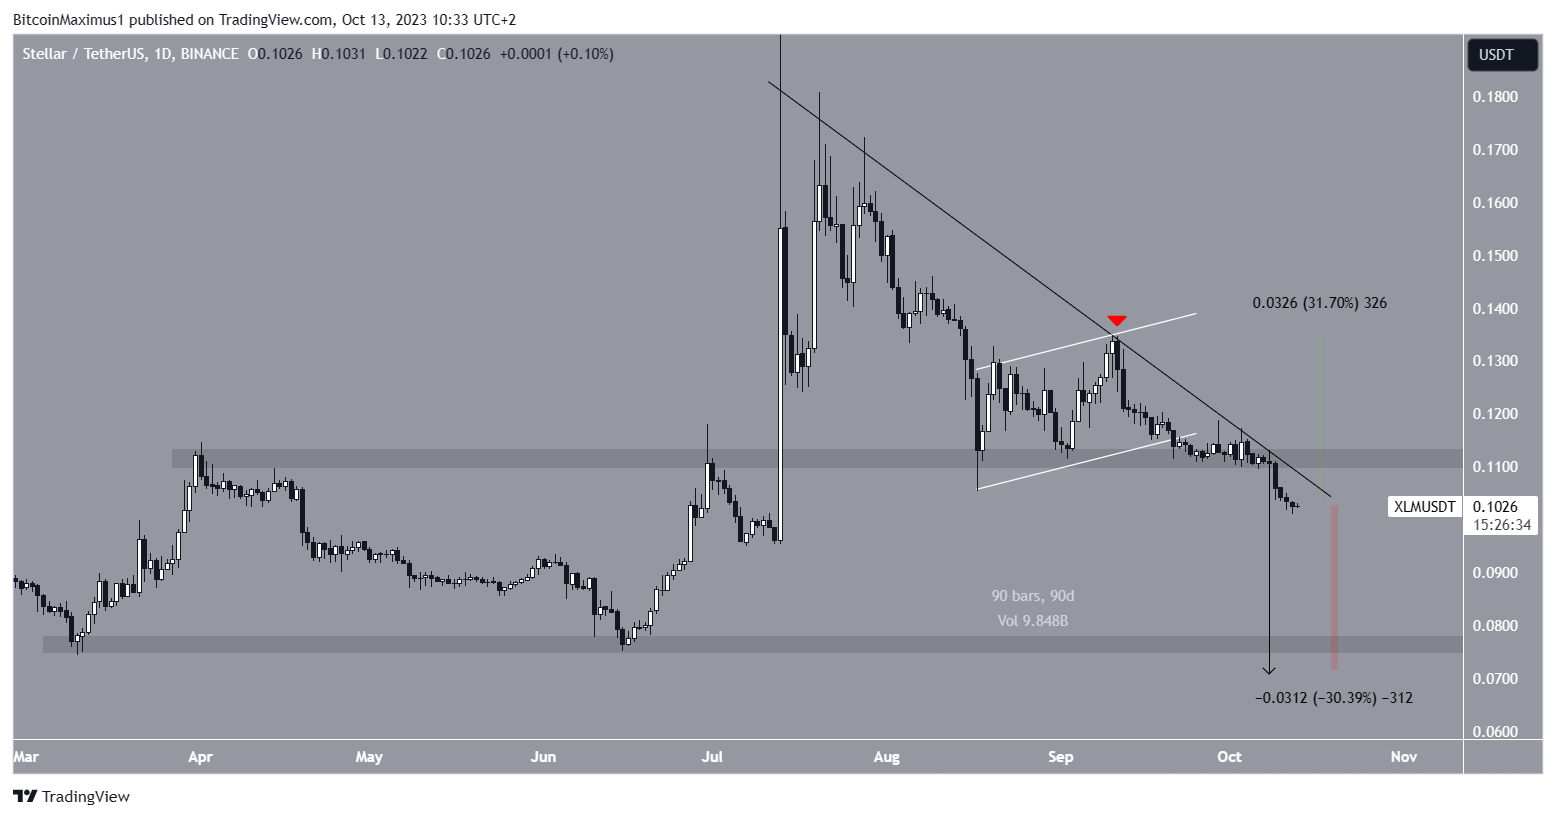
Despite this bearish XLM price prediction, a breakout from the triangle’s resistance trendline will mean that the previous breakdown was invalid.
In that case, the trend will still be bullish, and XLM could increase by 30% to $0.140.
Interested in AI Trading? 9 Best AI Crypto Trading Bots to Maximize Your Profits
For BeInCrypto’s latest crypto market analysis, click here.


