


The Stellar (XLM) price has fallen since November 13 despite breaking out from a descending resistance trend line.
XLM has nearly reached the $0.110 horizontal support area, which is critical for the future trend. Will XLM bounce or break down?
Stellar Breaks out Above Resistance
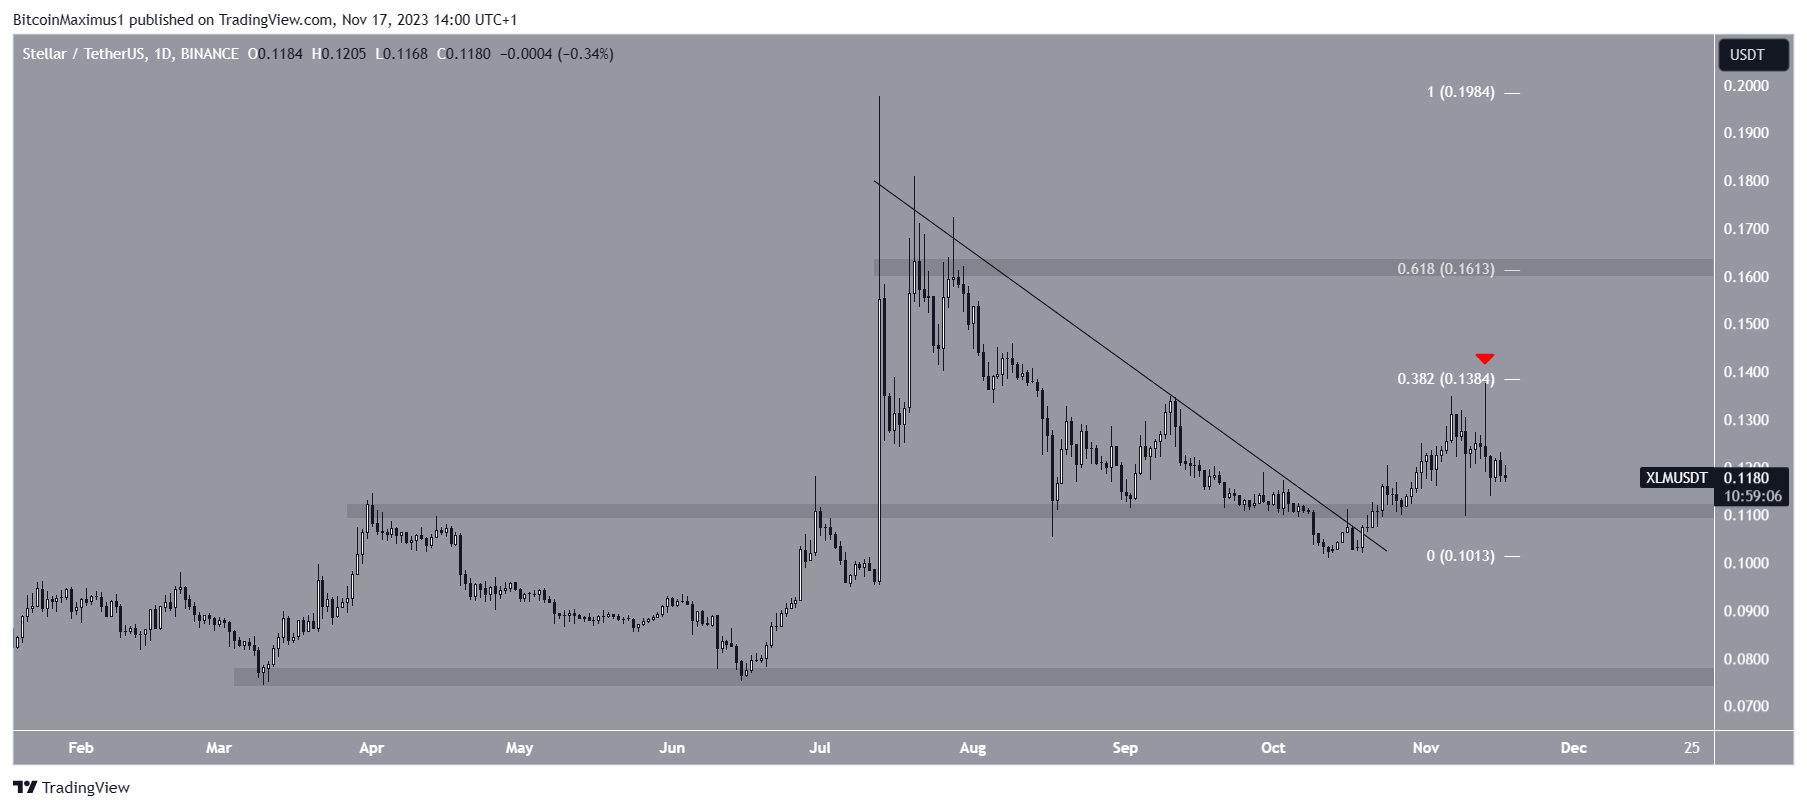
The technical analysis from the daily timeframe shows that XLM has decreased under a descending resistance trend line since July. While following the trend line, the price fell to a low of $0.101 on October 12.
Initially, the decrease caused a breakdown from the $0.110 horizontal area. However, the XLM price broke out from the resistance trend line and reclaimed the area on October 23.
The Stellar price breakout led to a high of $0.137 on November 13.
The XLM price has fallen since, validating the 0.382 Fib retracement resistance level at $0.138 (red icon) and created a long upper wick, a sign of selling pressure.
According to the Fibonacci retracement levels theory, following a significant price change in one direction, the price is expected to partially return to a previous price level before resuming its increase.
The Stellar team announced the creation of the Stellar Social Club, with the idea of giving back to the Stellar community. The Social Club will be a place to connect with other enthusiastic builders about the Stellar network.
XLM Price Prediction: Bounce or Breakdown?
A closer look at the Relative Strength Index (RSI) from the daily timeframe for XLM gives an undetermined reading.
With the RSI as a momentum indicator, traders can determine whether a market is overbought or oversold and decide whether to accumulate or sell an asset.
Bulls have an advantage if the RSI reading is above 50 and the trend is upward, but if the reading is below 50, the opposite is true.
The daily RSI is right at the 50 line, indicating an undetermined trend.
As a result, the reaction to the $0.110 area can determine the future XLM trend. A strong bounce can cause a 35% increase to the 0.618 Fib resistance at $0.161.
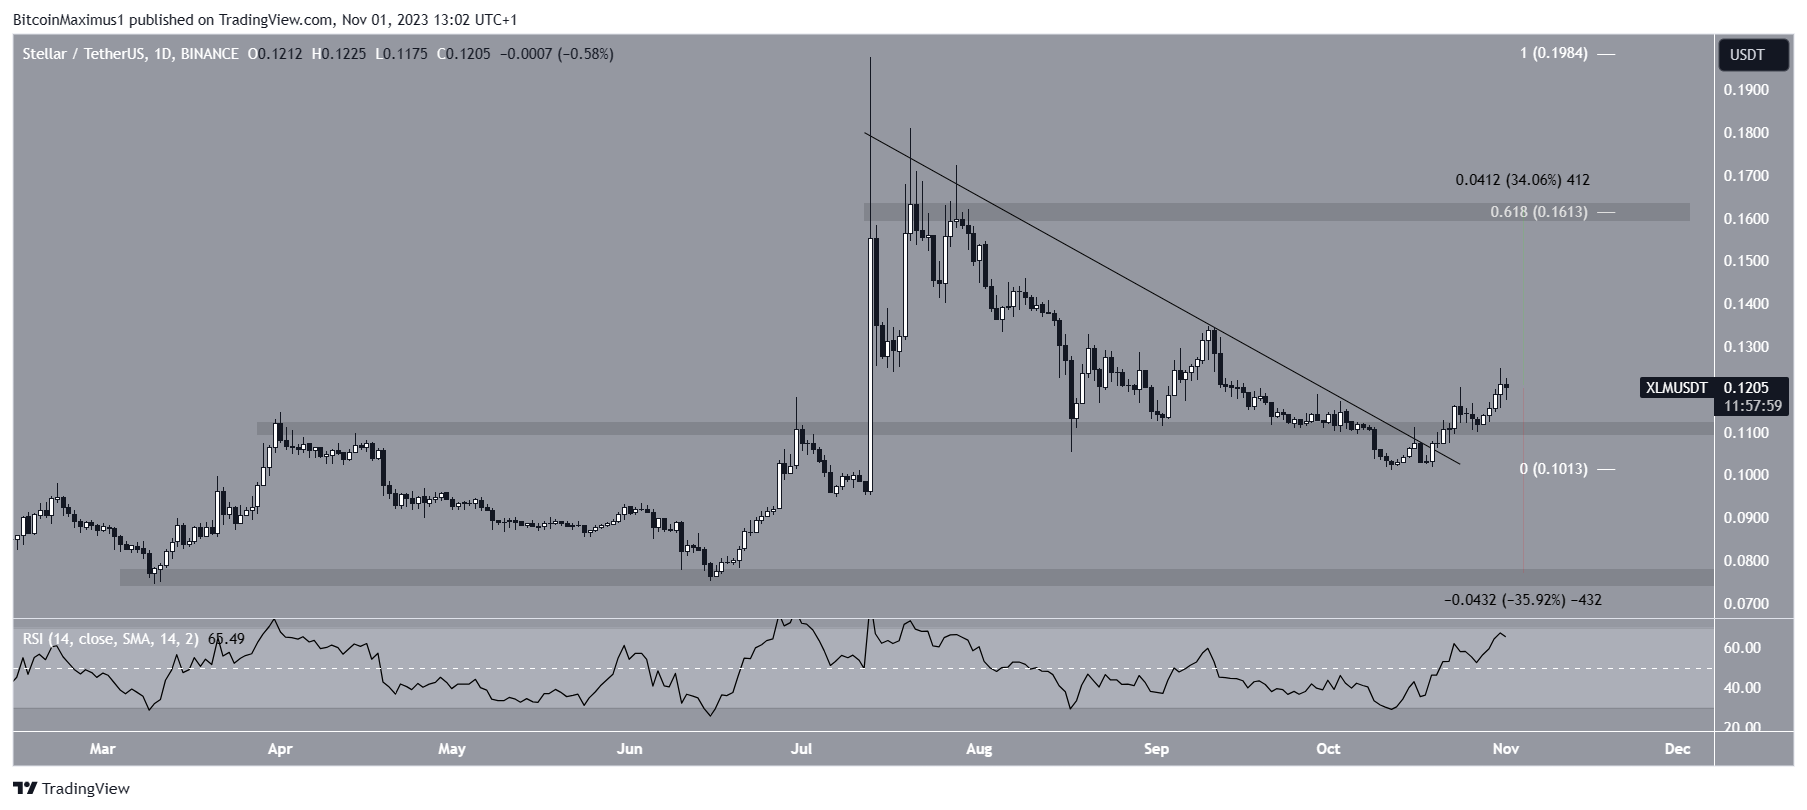
On the other hand, an XLM price breakdown from the $0.110 area can cause a 35% drop to the next closest support at $0.078.
Interested in AI Trading? 9 Best AI Crypto Trading Bots to Maximize Your Profits
For BeInCrypto’s latest crypto market analysis, click here.


