


The Polkadot (DOT) price has fallen under a descending resistance trendline since February.
The DOT price fall caused a breakdown from a long-term horizontal support area at $4.30. Will the price bounce, or is there more downside expected?
Web3 Foundation Launches New Initiative
The Web3 Foundation, Polkadot’s development agency, has unveiled a new initiative to deploy a total of US$22.08 million and 5 million DOT throughout 2024. Totalling nearly $41 million.
This program aims to bolster the community-driven funding system originating from the Polkadot Treasury. This targeted financial support is specifically directed towards projects that can significantly shape Polkadot’s future.
Polkadot Falls Below Long-Term Support
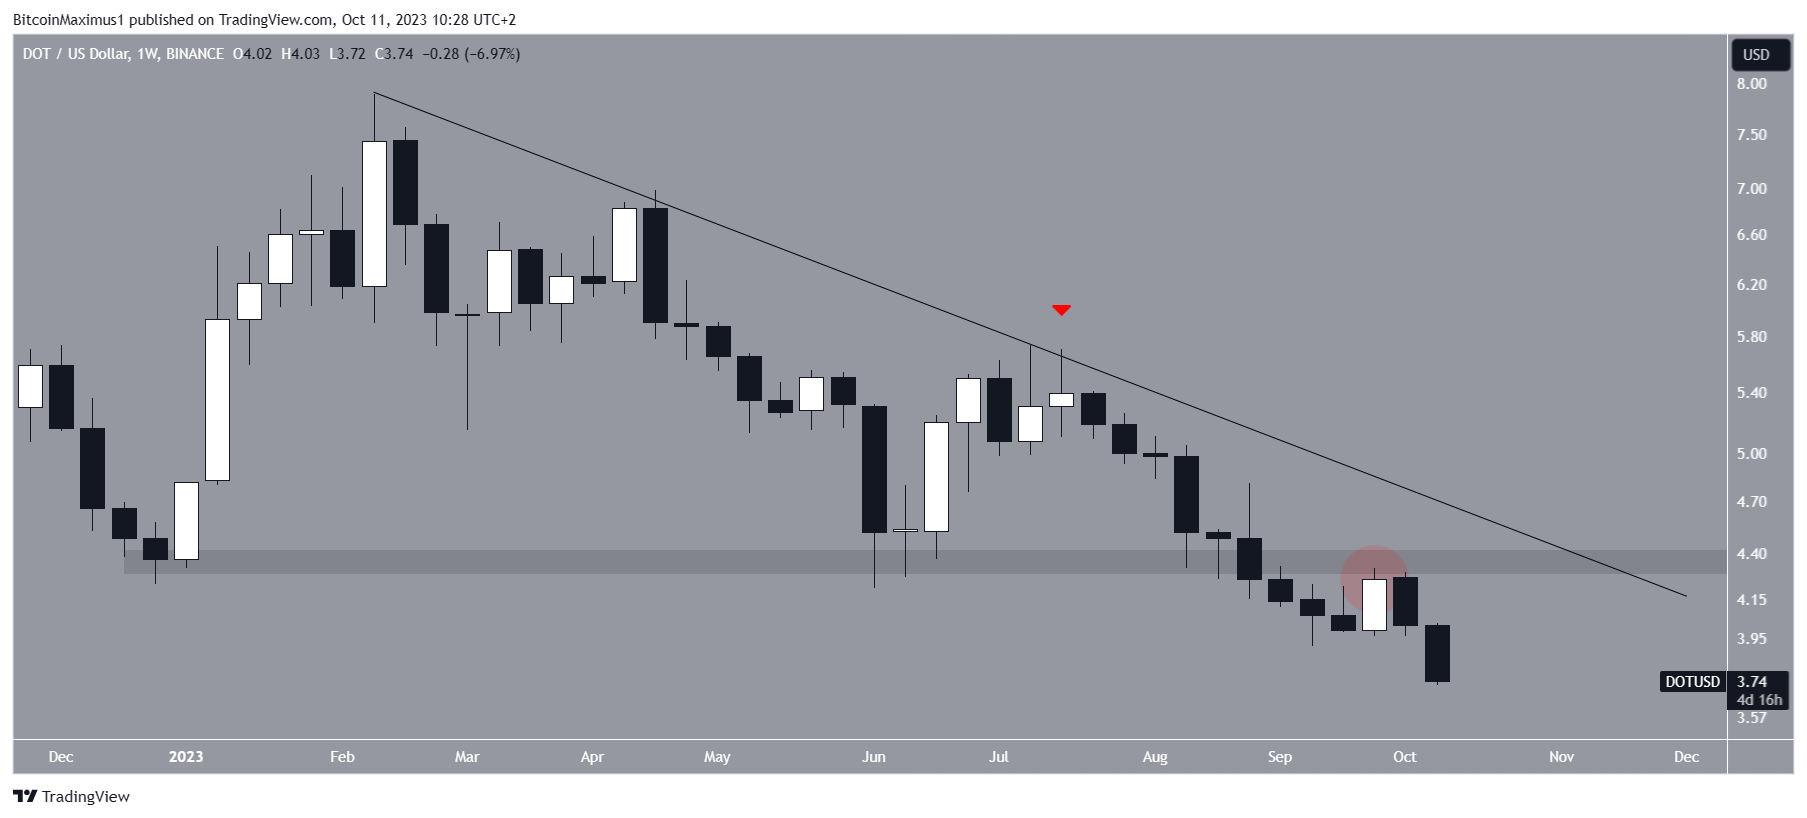
The weekly timeframe chart shows that DOT has fallen under a descending resistance trendline since February. More recently, the trendline caused a rejection in July (red icon).
In August, DOT broke down from the $4.40 horizontal support area. The area had been in place since the start of the year.
After the breakdown, Polkadot validated the area as resistance (red circle) in September, a common movement after such breakdowns.
Even though there has been an ongoing price decrease, builders in the Polkadot ecosystem are not fazed.
This is visible when looking at the daily active developers (green), which are close to an all-time high and significantly above 2021 levels when the altcoin’s price was at an all-time high.
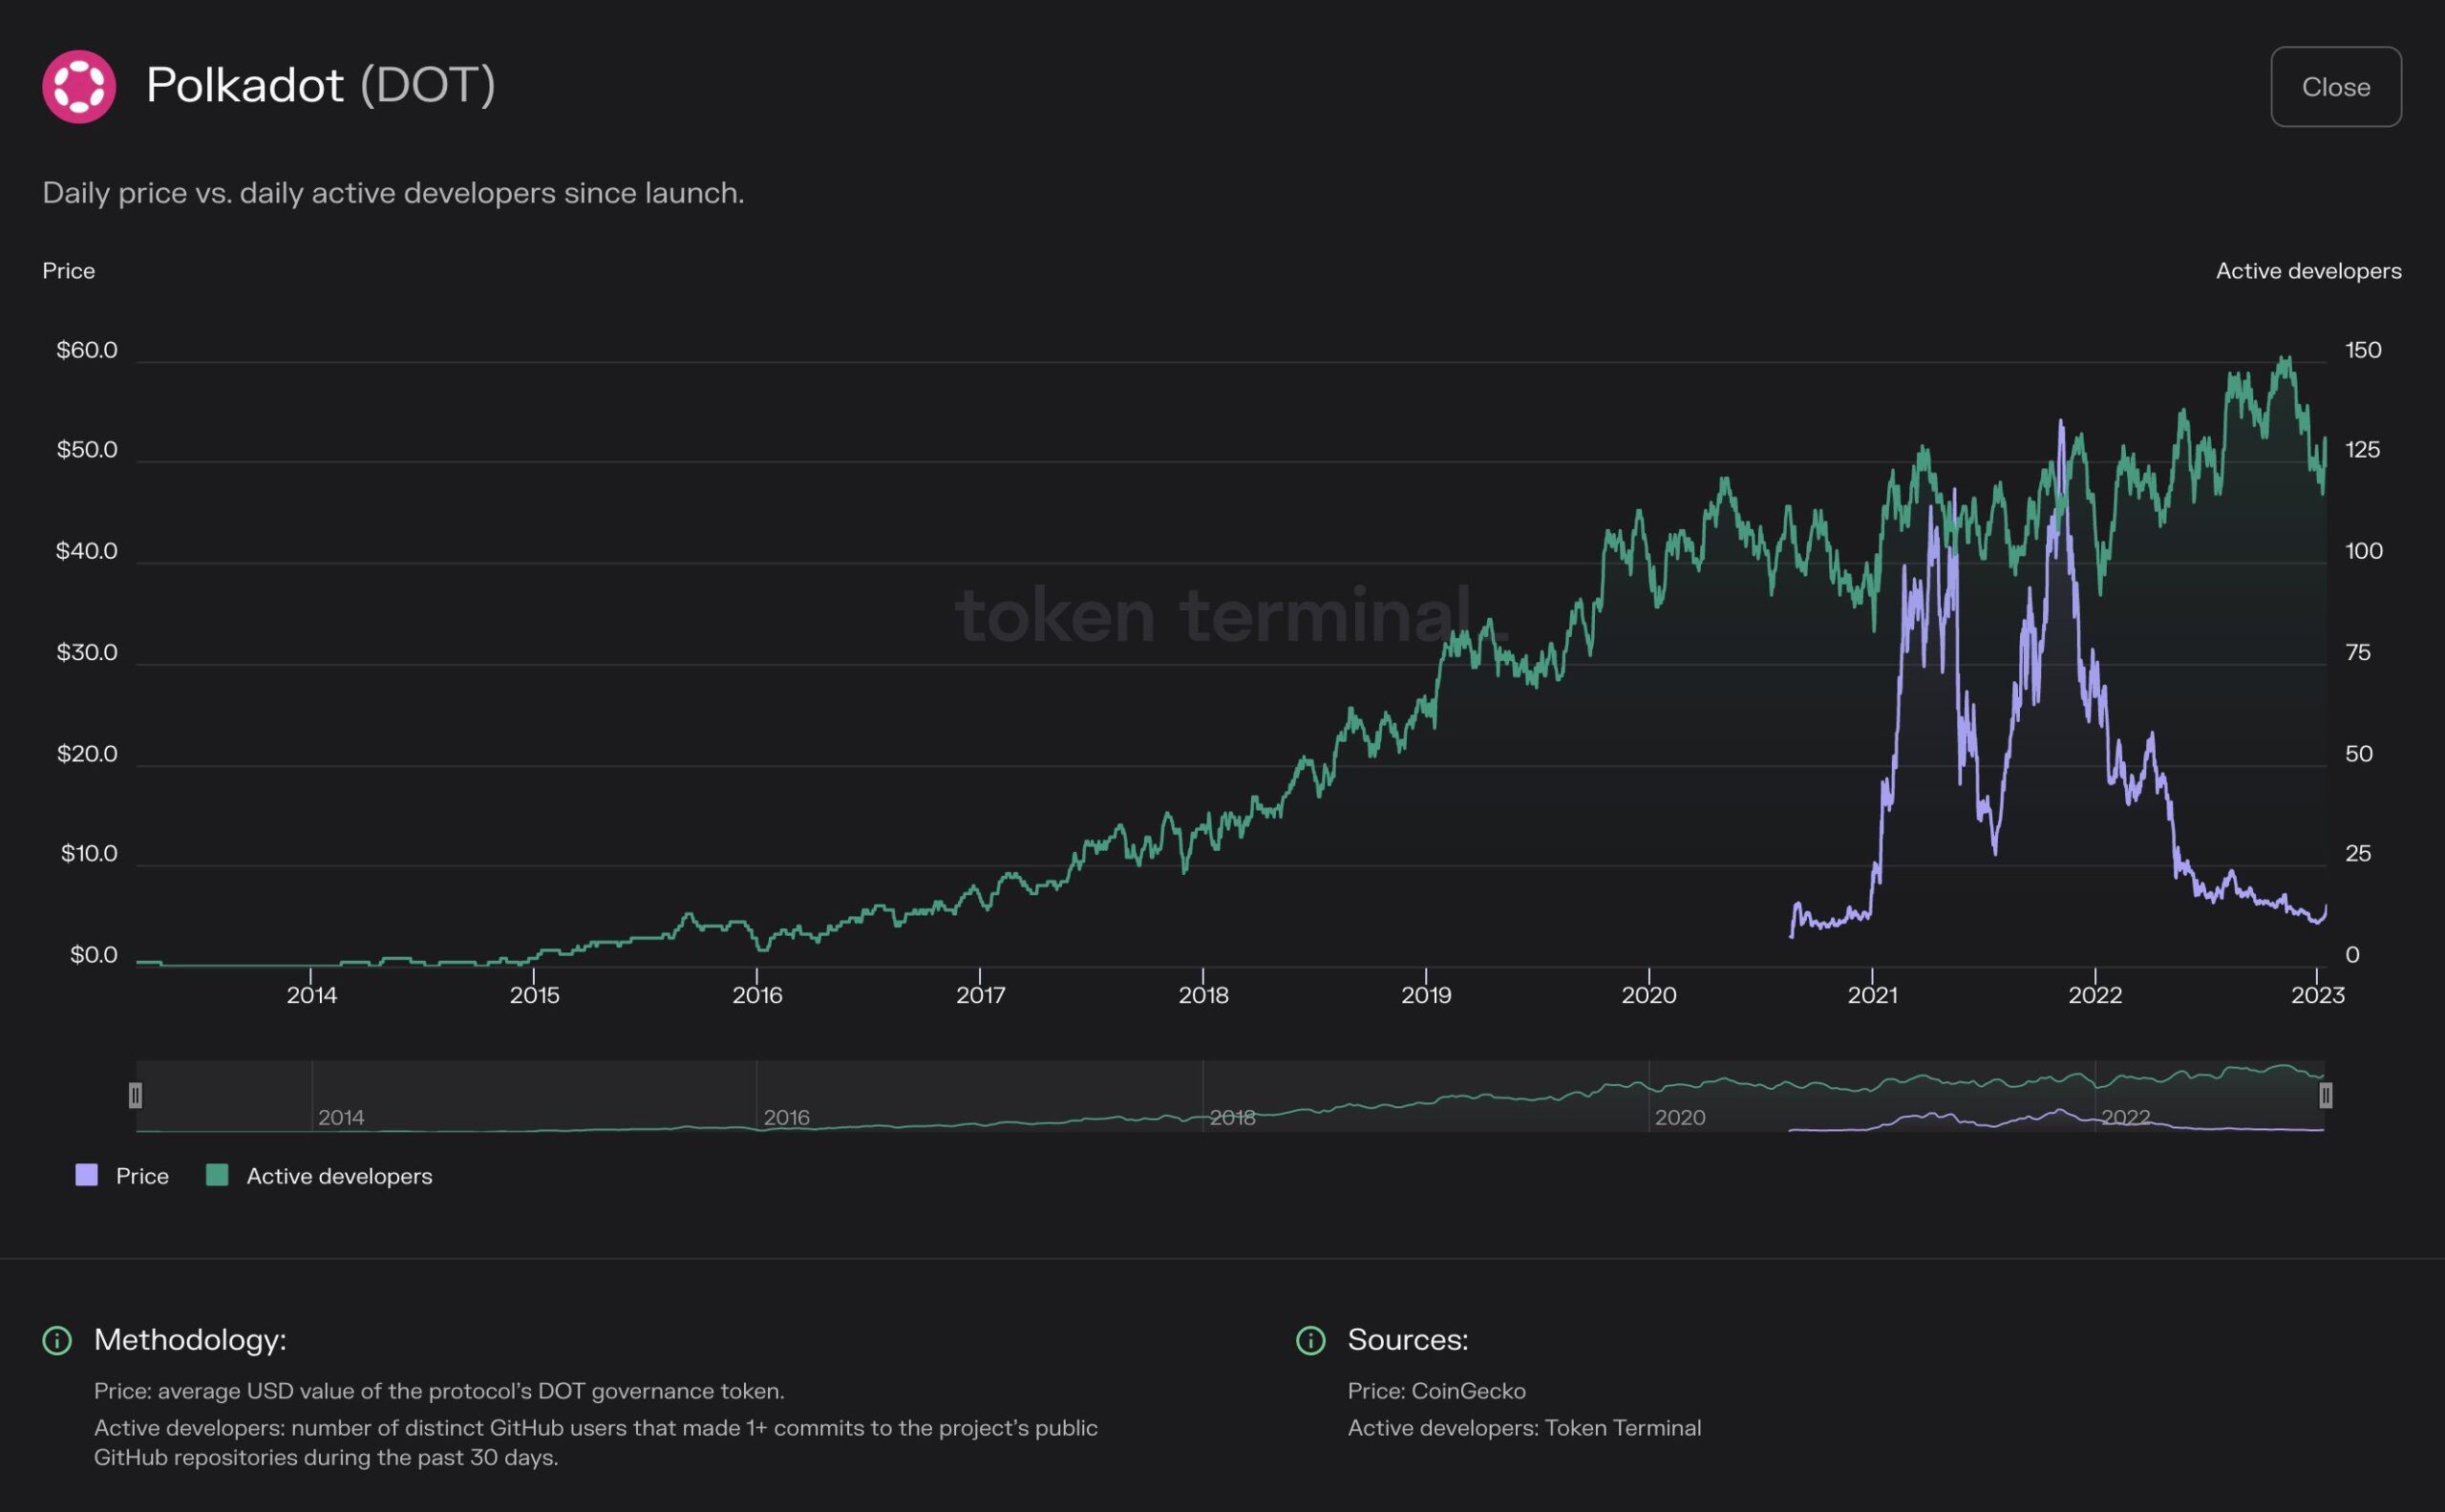
It is also interesting to note that Polkadot has had a significant amount of development activity. This is especially visible over the past 30 days when it was ranked second based on GitHub commits.
DOT Price Prediction: Where to Next?
There is no more horizontal support left below the current price. So, Fib retracement levels can determine the possible areas for a bottom.
According to the Fibonacci retracement levels theory, following a significant price change in one direction, the price is expected to partially return to a previous price level before continuing in the same direction.
This theory can also be used to identify the bottom of future downward movements.
The weekly RSI also supports the continuing of the Polkadot price decrease. The RSI is a momentum indicator traders use to evaluate whether a market is overbought or oversold.
Read More: 9 Best Crypto Demo Accounts For Trading
Readings above 50 and an upward trend suggest that bulls still have an advantage, while readings below 50 indicate the opposite. The indicator is below 50 and falling, both signs of a bearish trend.
The 1.27 Fib retracement level is at $3.20, 15% below the current price, while the 1.61 Fib level is 50% below the current price at $1.90. The level is slightly below the all-time low price (red line) of $2.
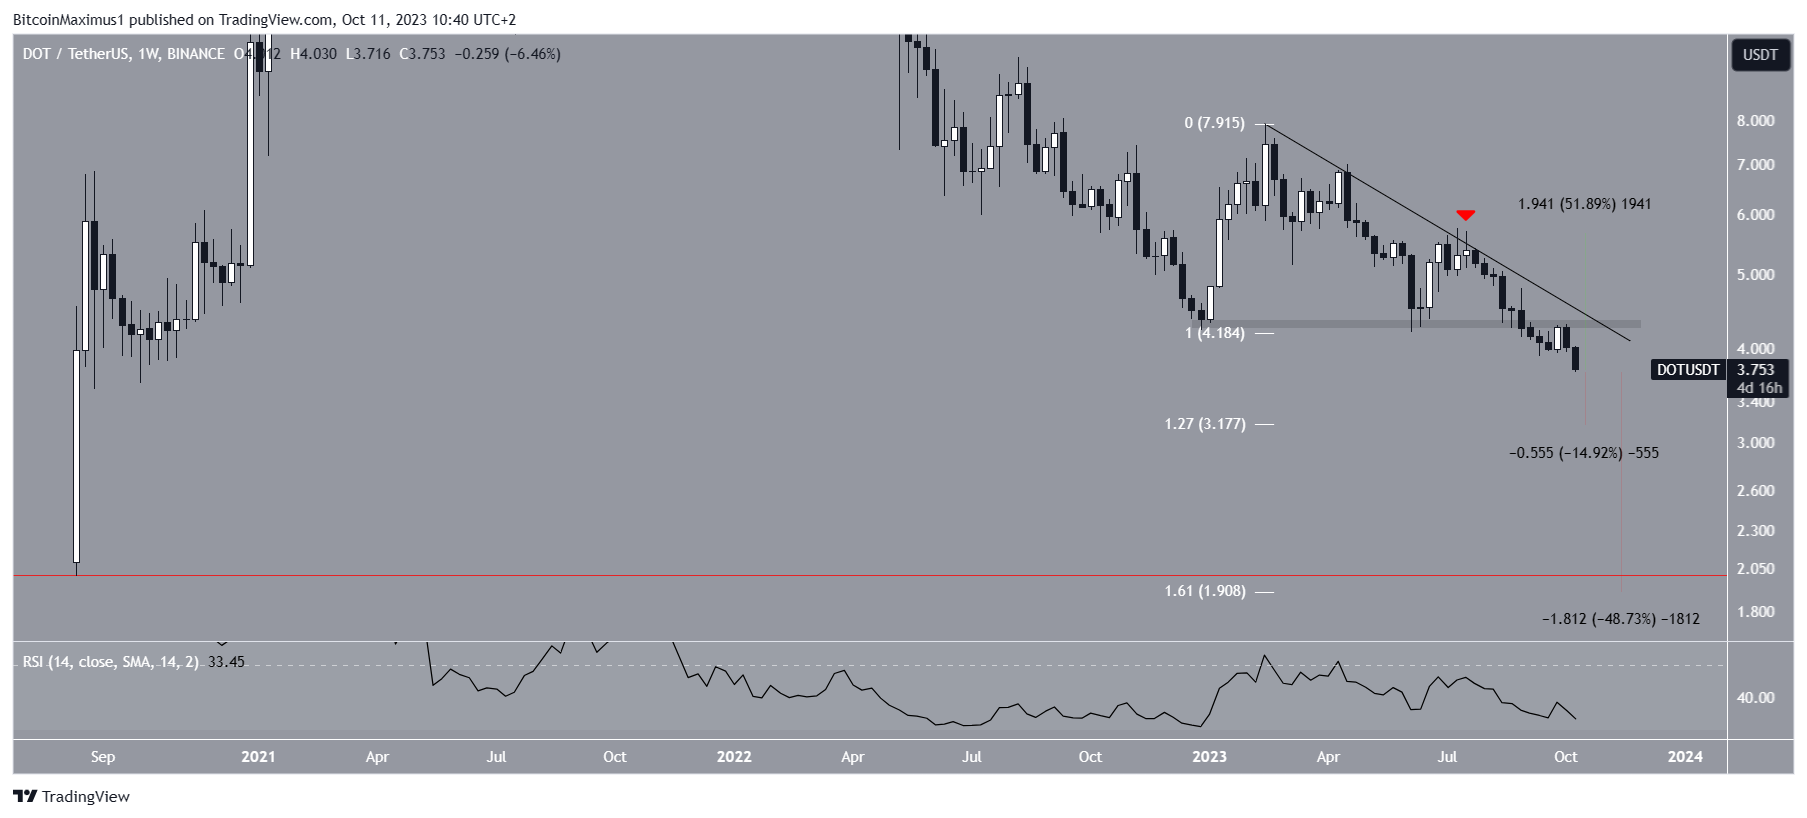
Despite this bearish DOT price prediction, a weekly close above the $4.30 area will mean that the trend is still bullish.
In that case, the cryptocurrency can increase by 50% and reach the $5.60 resistance area.
For BeInCrypto’s latest crypto market analysis, click here.


