


The price action for these two bullish altcoins shows similarities to that of Bancor (BNT) before its upward movement.
The Bancor (BNT) price increased by 70% over the weekend, reaching a 19-month high in the process.
Cartesi (CTSI) Price Attempts Breakout
CTSI is the first of the two altcoins that could experience increased volatility.
This is because of activity that has been present in the network for a long period of time. More specifically, CTSI has experienced high transaction volume, a high number of active addresses, and a large number of whale transactions.
This also includes a low age of destroyed coins. BNT showed similar signs before the upward movement.
As for the price action, the CTSI price has fallen under a descending resistance trendline since May. More recently, the line caused a rejection on October 8, creating a long upper wick.
The wick also validated the $0.0135 horizontal area as resistance.
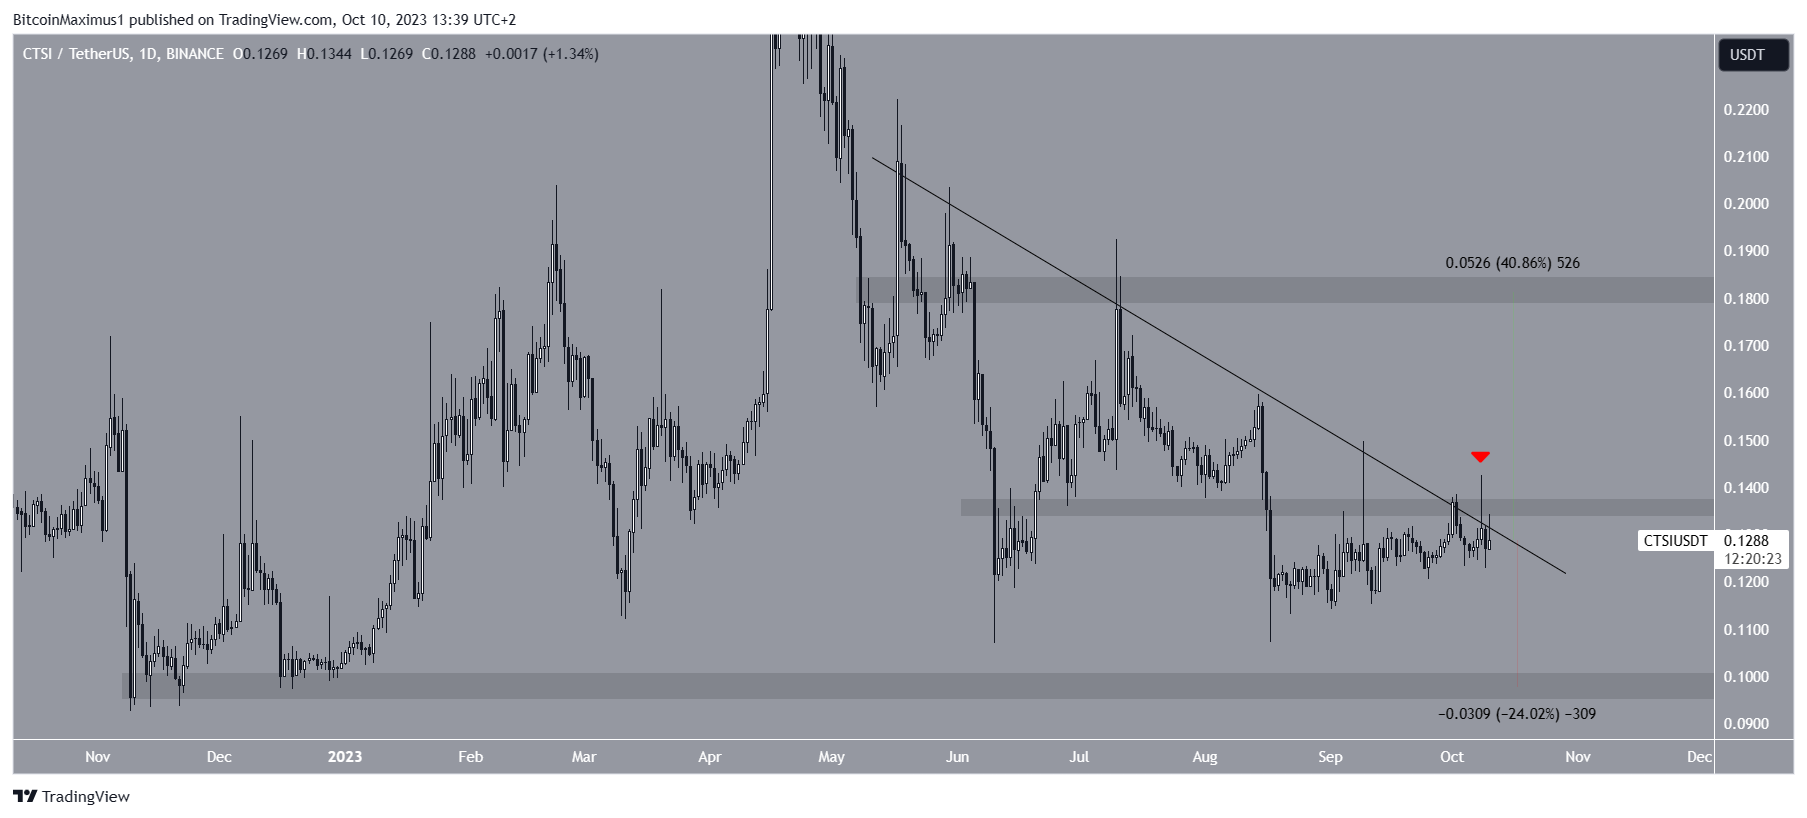
In order for CTSI to begin an upward movement., it has to break out from the descending resistance trendline and the $0.135 area. If that occurs, the price can reach the $0.180 resistance area, which is 40% above the current price.
On the other hand, failure to do so will likely lead to a 25% drop in the $0.100 horizontal support area.
Holo (HOT) Approaches End of Bullish Pattern
In the case of HOT, the indicators that show the potential for upcoming volatility are the high number of whale transactions, the accumulation by wallets that hold between $100,000 and $1,000,000 worth of tokens, a high number of exchange inflows, and a low age of the coins being destroyed.
As for the HOT price action, the bullish altcoin has fallen inside a descending wedge pattern since it reached its all-time high in April 2021. The descending wedge is considered a bullish pattern, meaning it usually leads to breakouts.
Read More: 9 Best Crypto Demo Accounts For Trading
The HOT price is approaching the point of convergence between the support and resistance trendlines. So, a decisive movement outside of the pattern is expected soon.
The wedge’s support line also coincides with the $0.00095 horizontal support area, increasing its significance.
Even though the price trades in a bullish pattern, the weekly RSI is bearish. When evaluating market conditions, traders use the RSI as a momentum indicator to determine if a market is overbought or oversold and to decide whether to accumulate or sell an asset.
If the RSI reading is above 50 and the trend is upward, bulls still have an advantage. The opposite is true if the reading is below 50.
The RSI is below 50 and decreasing, both considered signs of a bearish trend.
Therefore, whether the HOT price breaks out from the wedge or breaks down from the $0.0095 horizontal area instead will determine the future trend’s direction.
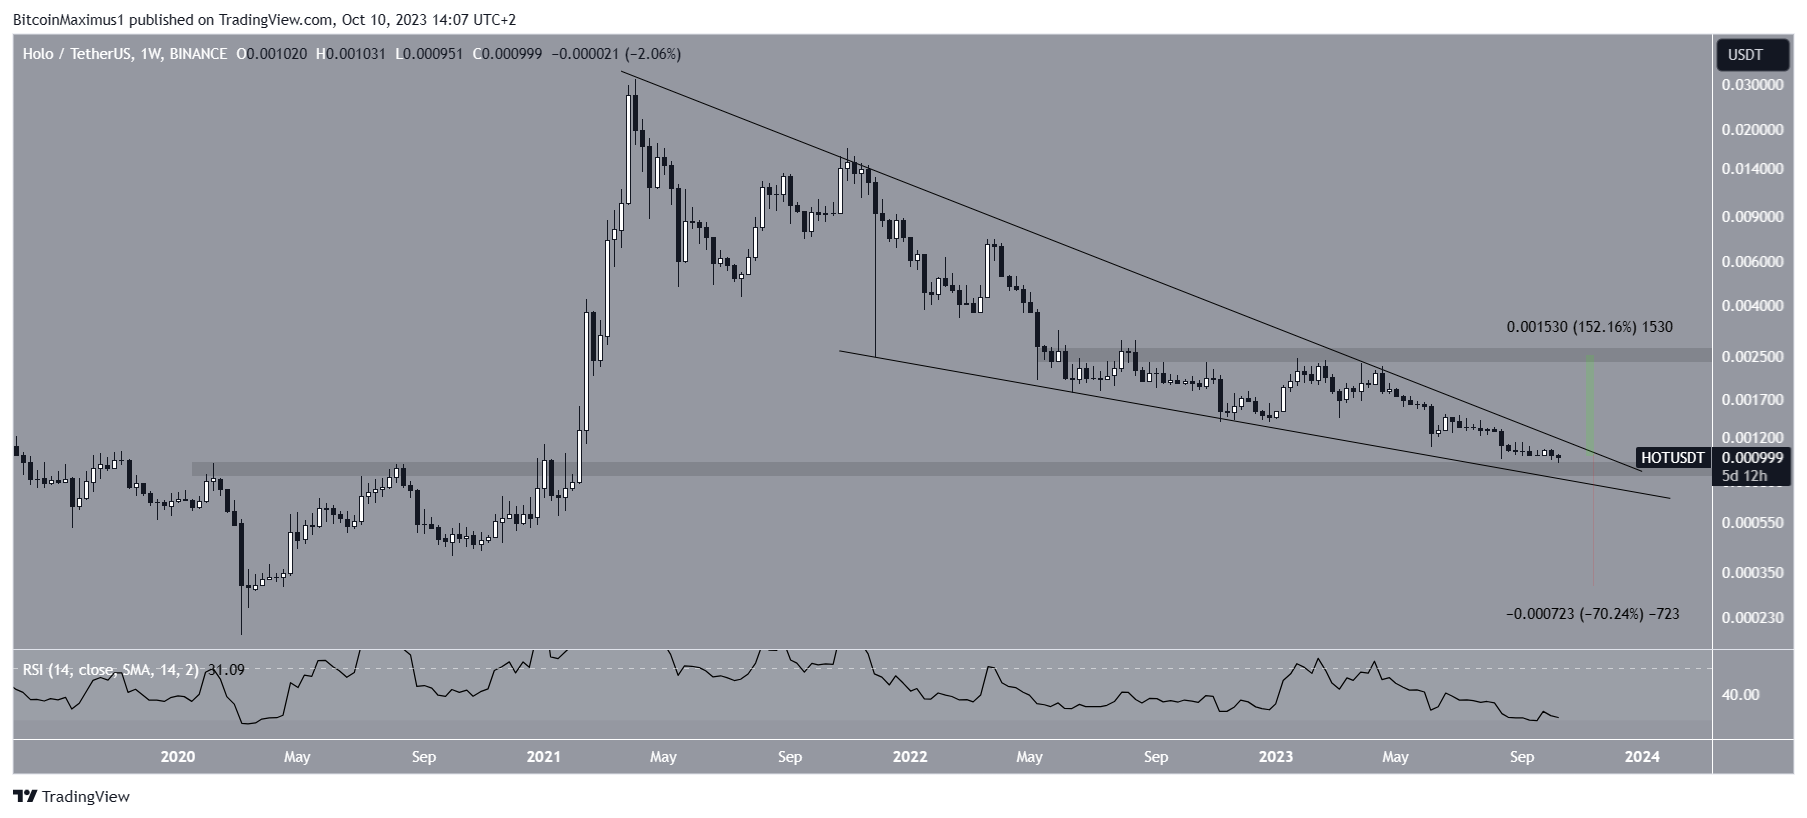
In case of a breakout, HOT can increase to the next resistance at $0.00250, an increase of 150% measuring from the current price.
On the other hand, a breakdown will likely lead to a 70% fall to $0.00030.
For BeInCrypto’s latest crypto market analysis, click here


