


The Polkadot (DOT) price broke down from a critical horizontal support level at $4.40. It reached the lowest weekly close since 2020.
While the price trades inside a short-term corrective pattern, this is not enough to negate the long-term bearish structure.
Polkadot Price Nears All-Time Low
The weekly timeframe technical analysis shows that DOT has fallen under a descending resistance line since its yearly high of $7.90 in February 2023. While following the line, the price broke down from the $4.40 horizontal support area, which had been in place since the beginning of the year. Breakdowns from such long-term support levels often catalyze significant falls.
When combined with the support area, the line creates a descending triangle, considered a bearish pattern. This further legitimizes the breakdown and supports the possibility of more downside.
Crypto investing, simplified. Get DOT price predictions here.
If the decrease continues, the DOT price can fall by another 50% and reach the $2 horizontal support area. The all-time lows of August 2020 create the support area.
On the other hand, reclaiming the $4.40 area and the descending resistance line will likely trigger an 85% price increase to the $7.50 resistance area.
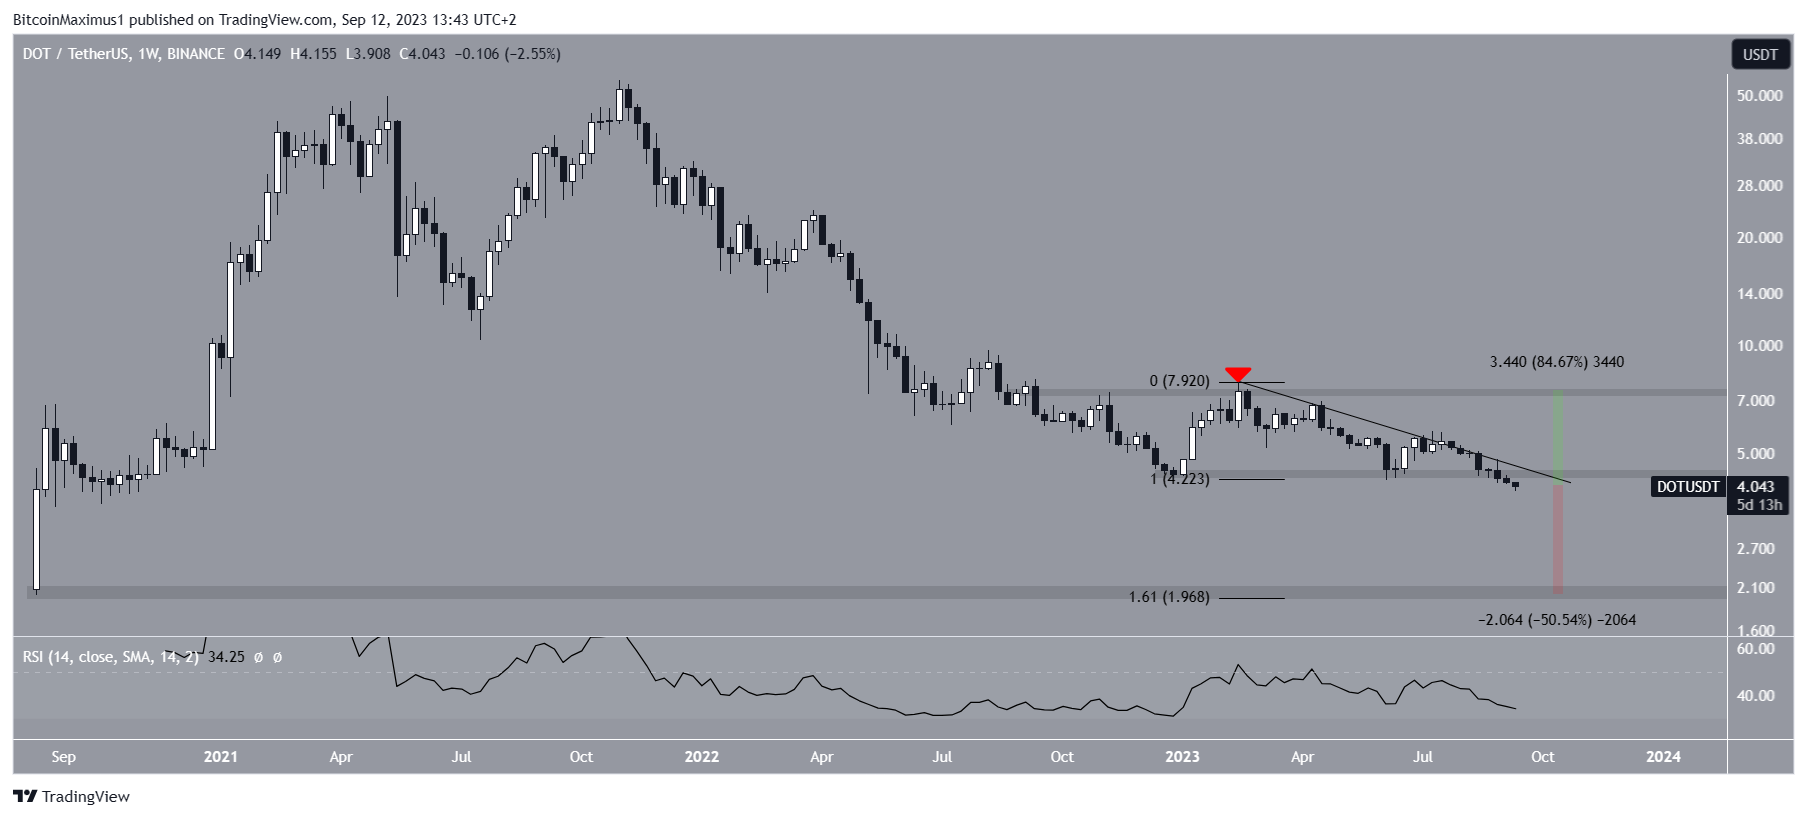
The weekly RSI is bearish, supporting the continuing decrease. The Relative Strength Index (RSI) serves as a momentum indicator employed by traders to assess whether a market is overbought or oversold, guiding their decisions on whether to accumulate or sell an asset.
Readings above 50 and an upward trend suggest that bulls still have an advantage. While readings below 50 indicate the opposite. The indicator is below 50 and falling, both considered signs of a bearish trend.
DOT Price Prediction: Is There Hope for a Reversal?
The six-hour timeframe readings show that the entire decrease since July 20 has been contained inside a descending parallel channel. These channels usually contain corrective movements. This is not in line with the breakdown from the long-term support, which is expected to catalyze a significant price decrease.
The DOT price has bounced at the channel’s support line but is still trading in its lower portion.
The RSI shows an interesting signal since it has just moved outside of its oversold territory. The previous time this occurred (green icons), Polkadot was also trading at the channel’s support line and increased by 11% to the channel’s resistance line.
If the same occurs this time, the channel’s resistance line will be near $4.30, 9% above the current price.
Even if this increase materializes, the long-term trend cannot be considered bullish until DOT actually breaks out from the channel.
On the other hand, a breakdown from the channel will likely accelerate the decrease towards the previously outlined support at $2.
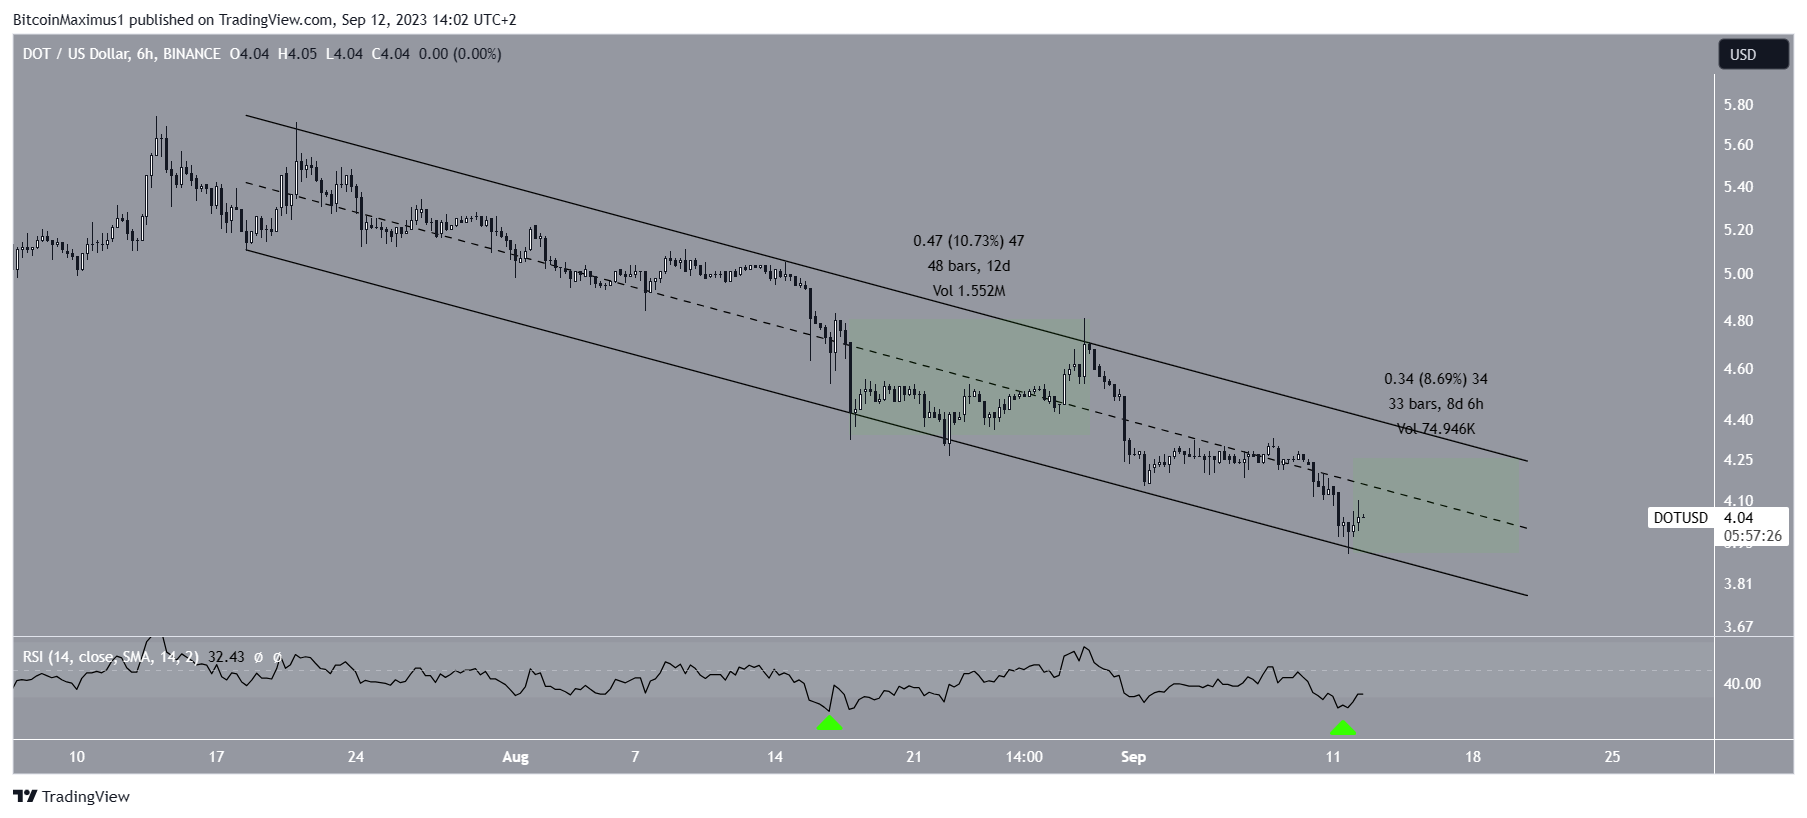
Despite this bearish DOT price prediction, a breakout from the channel and the $4.40 area in the process will likely cause an 85% increase to the $7.50 horizontal resistance area.
Trade With AI – 9 Best AI Crypto Trading Bots to Maximize Your Profits
For BeInCrypto’s latest crypto market analysis, click here.


