


The Stellar (XLM) price has fallen since its yearly high in July and is approaching a long-term horizontal support level at $0.105.
While the price has broken out from a short-term descending resistance line, it failed to sustain its upward movement.
Stellar Decreases After Rejection
The daily time frame technical analysis shows that the Stellar Lumens price has fallen under a descending resistance line since July 13. The decrease led to a low of $0.105 on August 17. Afterward, the price bounced (green icon) and broke out from the descending resistance line on September 4.
Despite the breakout, XLM failed to move above the $0.135 horizontal resistance area. Rather, it was rejected on September 11 and has fallen since. Stellar has nearly reached the $0.110 horizontal support area. A breakdown from it can cause a 15% drop to $0.095, while a bounce can cause a 20% increase to $0.135.
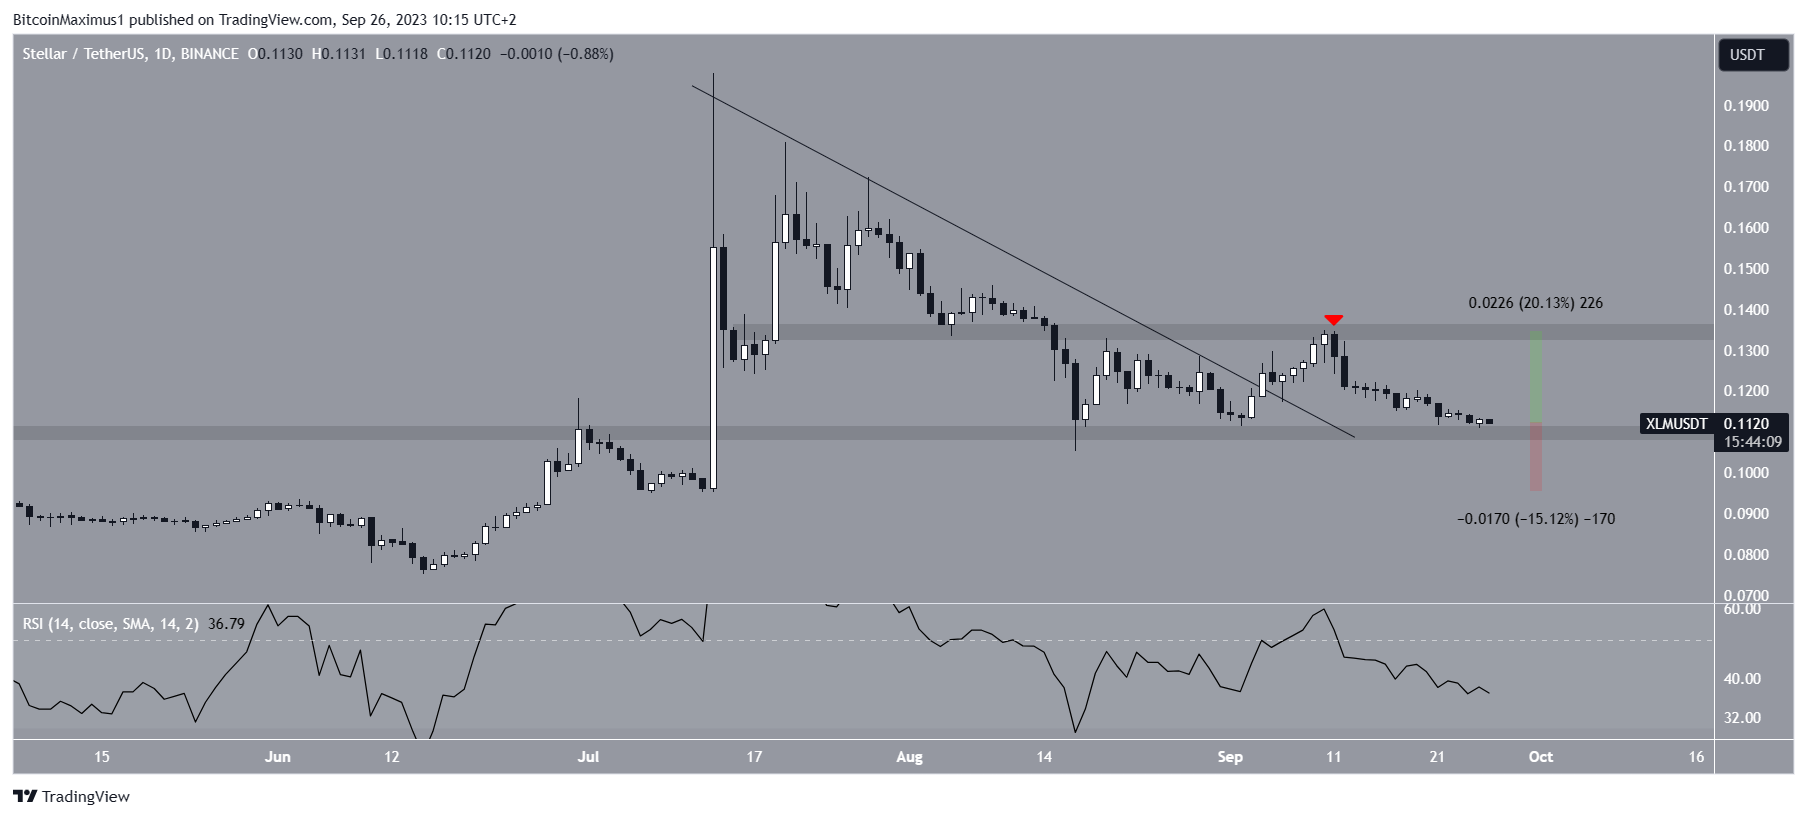
The daily RSI is bearish. Traders utilize the RSI as a momentum indicator to assess whether a market is overbought or oversold and to determine whether to accumulate or sell an asset.
If the RSI reading is above 50 and the trend is upward, bulls still have an advantage, but if the reading is below 50, the opposite is true. The indicator is below 50 and falling, both considered signs of a bearish trend. Therefore, the RSI suggests the cryptocurrency will break below $0.110.
XLM Price Prediction: Channel Breakdown Can Lead to New Lows
The six-hour timeframe also provides a bearish reading, aligning with that of the daily timeframe.
The first reason for this is that XLM broke down from an ascending parallel channel on September 17. Such channels usually contain corrective movements. So, the presence of the channel and ensuing breakdown is a sign that the previous movement was corrective.
The XLM price breakdown is a sign that the previous movement is corrective and that the trend is bearish.
Furthermore, the movement inside the channel resembles an A-B-C corrective structure, further aligning with the hypothesis that the previous increase was corrective.
If the formation is legitimate, Elliott Wave theory states that the trend is bearish and that the XLM price has begun a new downward movement. Technical analysts utilize the Elliott Wave theory to ascertain the trend’s direction by studying recurring long-term price patterns and investor psychology.
If the XLM price breaks down below the $0.105 lows, the next Fib support will be at $0.087, created by the 1.61 external retracement level of the previous bounce. Combining this with the previous horizontal support area, we can assume that the $0.087-$0.095 level can act as the bottom.
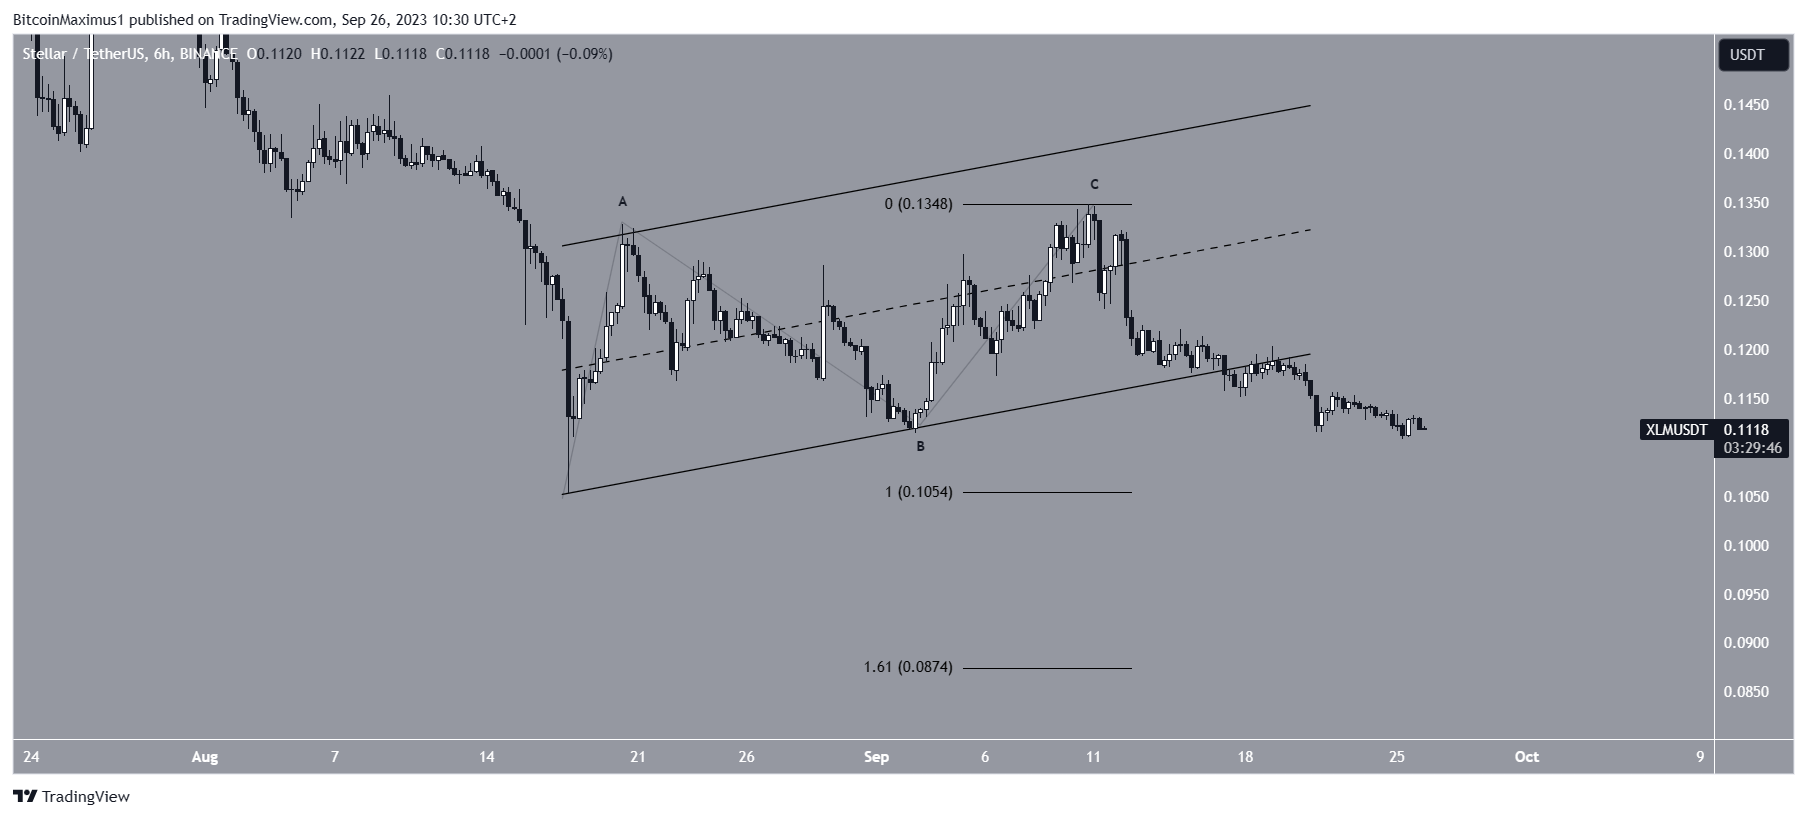
Despite this bearish XLM price prediction, a significant bounce at $0.110 could initiate a temporary trend reversal. In that case, the price can increase by 20% and reach the $0.130 resistance.
Interested in AI Trading? 9 Best AI Crypto Trading Bots to Maximize Your Profits
For BeInCrypto’s latest crypto market analysis, click here.


