


The Solana (SOL) price enjoyed a positive October and reached a new yearly high of $39.36 today.
During the increase, SOL broke out from the crucial long-term horizontal resistance area at $28.
Solana Moves Above $30 Resistance Area
The SOL price broke out from a long-term descending resistance trendline in July. After validating it as support in September (green icon), SOL accelerated its rate of increase.
Last week, SOL broke out from the $28 horizontal resistance area. This is a critical area since it has acted as resistance since SOL broke down in November 2022.
After the breakout, Solana reached a new yearly high of $39.40 today.
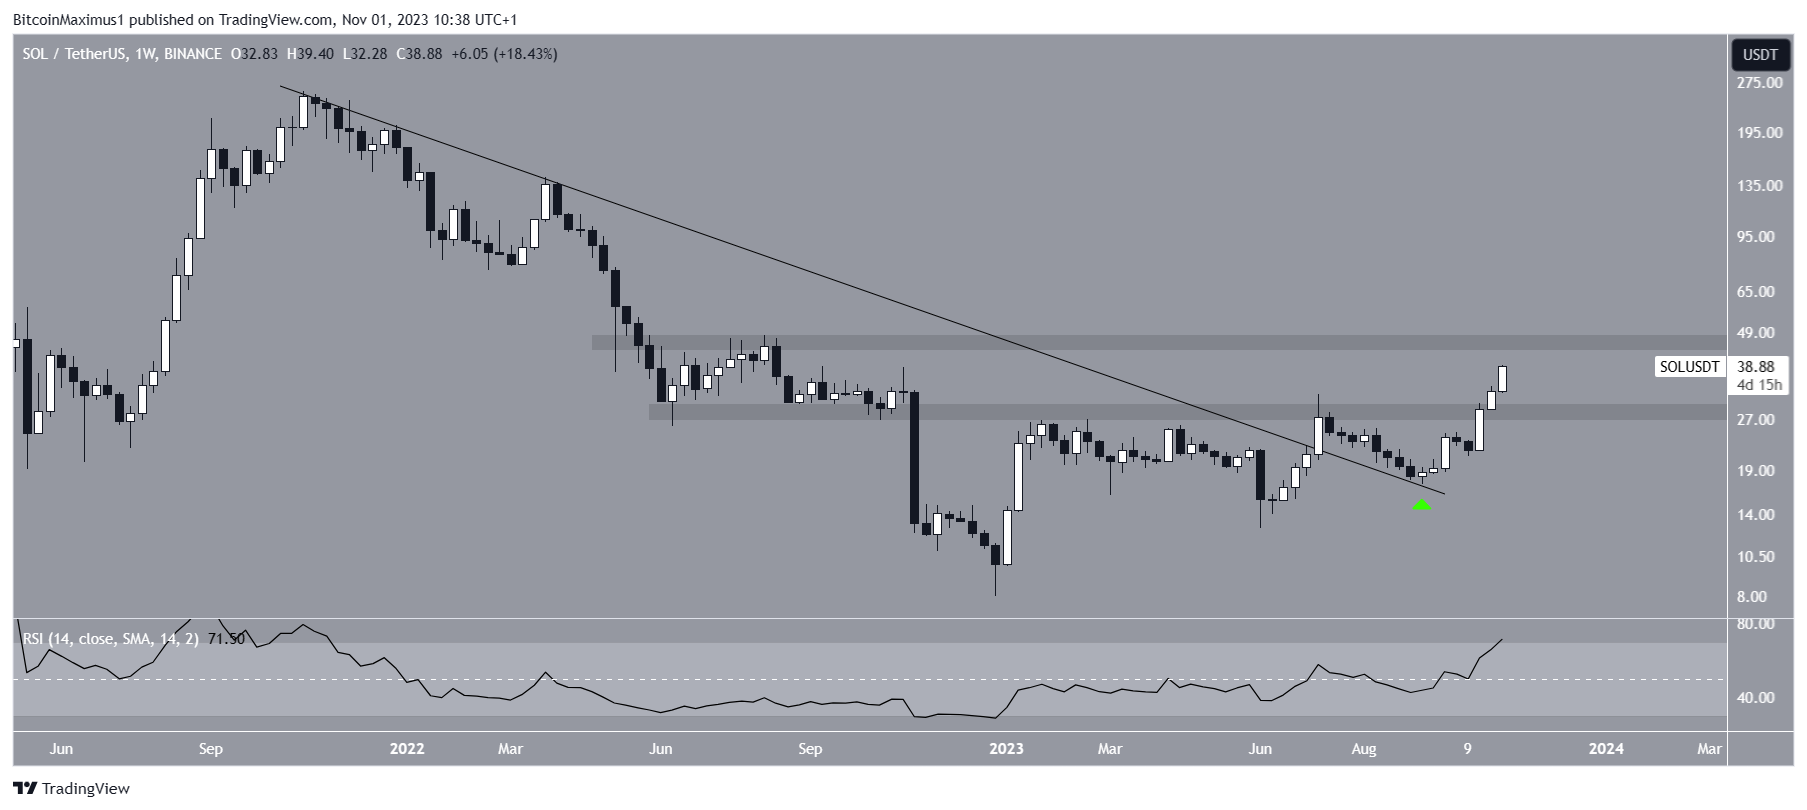
The weekly Relative Strength Index (RSI) gives a bullish reading. The RSI is a momentum indicator traders use to evaluate whether a market is overbought or oversold and whether to accumulate or sell an asset.
Readings above 50 and an upward trend suggest that bulls still have an advantage, while readings below 50 indicate the opposite. The indicator is above 50 and increasing, both signs of a bullish trend.
Positive Sentiment for Solana Grows
Due to Solana’s increase, the altcoin has returned to the #7 spot on market cap rankings. The price increase has also led to a renewed social interest, with nearly 2% of all discussions on the top 100 assets being for SOL.
Despite this increase, the outlook from cryptocurrency analysts on X is mixed.
Pentosh1 believes that the price will face rejection at the $38-$40 level and then gradually decrease towards $32.
ColdBloodShill is bullish for the long-term outlook, but he also suggests that the price can retrace in the short term. He stated:
10 months of consolidation on $SOL coming to an end. Dips below $32.50 probably going to be the sweet spot from the HTF.
Joemccann is decisively bullish because of the positive monthly close.
Solana Price Prediction: is the rally just beginning?
The daily time frame chart for SOL is decisively bullish because of the Elliott Wave count. By studying recurring long-term price patterns and investor psychology, technical analysts utilize the Elliott Wave theory to ascertain the trend’s direction.
The most likely count suggests that SOL has begun a long-term 1-2/1-2 wave formation. The wave count is in black, while the sub-wave count is in white.
If the count is correct, SOL is in sub-wave three of wave three, the sharpest out of all the increases.
If the Solana upward movement continues, the closest resistance area will be at $59 to $63 and $79 to $83. The targets are found by the 2.61 and 3.61 Fib extensions of the first wave (black) and sub-wave (white).
Fibonacci retracement levels operate on the principle that after a significant price change in one direction, the price will retrace or revisit a previous price level before resuming in its original direction.
Additionally, they can be employed to identify the highest point of future upward movements. The targets are 60% and 100% above the current price, respectively.
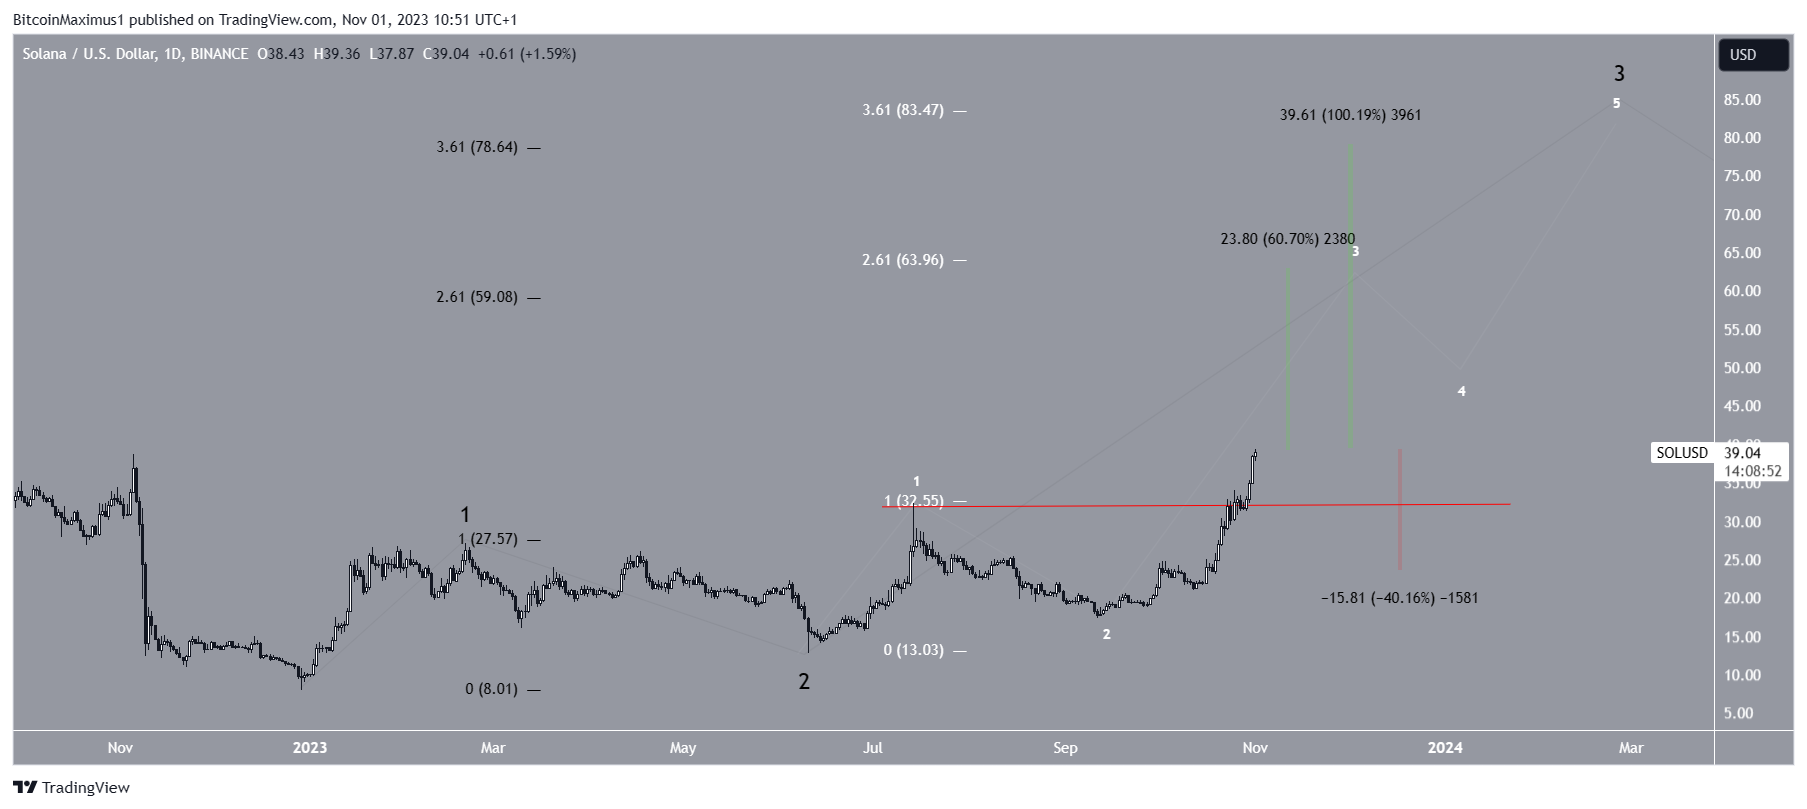
Despite this bullish SOL price prediction, decreasing below the sub-wave one high (red trendline) at $32.30 will invalidate the count.
In that case, a 40% drop to the closest support at $23 will be expected.
For BeInCrypto‘s latest crypto market analysis, click here


