


Technical analysis is an essential tool in a crypto trader’s toolbox, aiding in finding entry and exit levels for cryptocurrency trades. This guide explores bullish candlestick patterns, a form of technical analysis used to watch out for upcoming uptrends in the crypto markets. Keep reading to learn more.
Lifehack: test your knowledge & trade without risks with demo accounts
BYDFi
Up to 125x leveraged trading & trigger orders support
Bybit
Demo of spot, margin, leveraged & trading bots
Disclaimer
Cryptocurrency is offered by eToro USA LLC (“the MSB”) (NMLS: 1769299) and is not FDIC or SIPC insured. Investing involves risk, and content is provided for educational purposes only, does not imply a recommendation, and is not a guarantee of future performance. BeInNews Academy is not an affiliate and may be compensated if you access certain products or services offered by the MSB.
Explore more crypto platforms with demo accounts here.
- What are bullish candlestick patterns?
- Identifying bullish candlestick patterns
- Bullish reversal patterns
- Bullish continuation patterns
- Other bullish candlestick patterns
- Which candlestick pattern is most bullish?
- Trading strategies using bullish candlestick patterns
- Don’t use candlestick patterns in isolation
- Frequently asked questions
What are bullish candlestick patterns?
Bullish candlestick patterns signal that a bull market may be coming, allowing traders to determine their next moves. Bullish candlestick patterns generally occur after a succession of downward price movements.
Traditionally, assets are considered to be in a bull market if they record a price recovery of 20% or more from the market bottom. Bull markets are generally characterized by increased investor confidence and get their name from how bulls thrust their horns upwards when attacking their prey. This movement is used metaphorically to refer to a rise in asset prices as if a bull were thrusting the prices up in the air. A bull market could last for months or years.
Identifying bullish candlestick patterns
Identifying bullish candlestick patterns becomes easier with practice. Beginners can practice spotting these patterns by opening any cryptocurrency exchange’s spot trading dashboard and observing previous price patterns.
While learning to spot bullish candlestick patterns is important, traders can’t rely on them alone to make decisions. They must use support and resistance levels, market sentiment, trendlines, and trading strategies like the Wyckoff method to determine price movements.
Did you know you can increase your chances of making a profit in the highly volatile crypto market through grid trading? Grid trading is an automated strategy where a bot “places orders within predetermined price ranges.”
Bullish candlestick patterns can signal a reversal or a continuation in an asset’s price trends. A bullish reversal implies that a downtrend will soon reverse into an uptrend. On the other hand, a bullish continuation pattern can mean that a bullish trend will continue after a temporary pause and breakout have occurred.
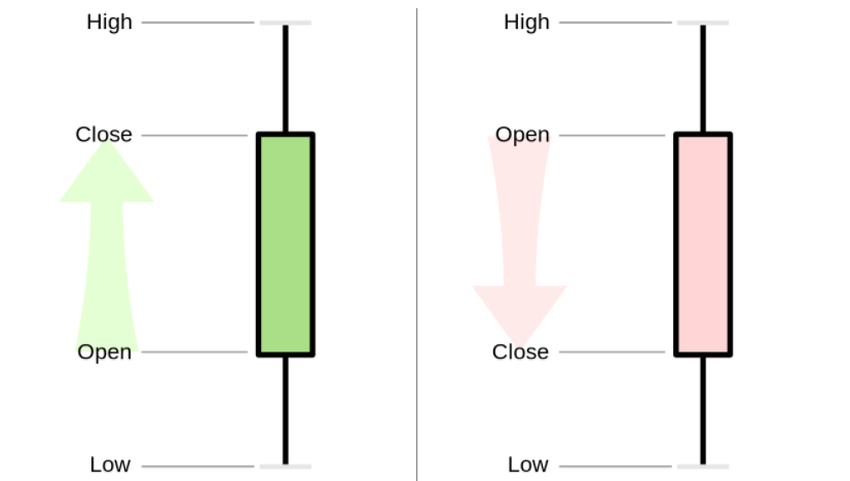
Bullish candlesticks are typically colored green or white. Nevertheless, bullish candlestick patterns with more than one candle may have both bullish and bearish candles. Bearish candles usually signal that a drop in asset prices is likely to occur and are generally indicated in red or black colors. Candlestick charts display an asset’s open, close, high, and low prices during trading. Here are the elements of a bullish and bearish candle:
Bullish reversal patterns
As mentioned earlier, bullish reversal patterns indicate that a downward trend in the price of an asset can soon move in the opposite direction and show an increase in the asset’s price. Over time, some bullish reversal patterns have been identified, with some described below.
Bullish engulfing pattern
A bullish engulfing pattern reveals that a reversal trend may occur due to increased buying pressure. This means buyers have entered the market and are likely to raise prices.
Two candles create the bullish engulfing pattern after a downtrend. The pattern forms when a large bullish green or white candle engulfs a small bearish red or black candle. Traders must wait for the large bullish candle to appear the next day before confirming this pattern. Moreover, conservative traders may wait until the next candle closes higher than the large candle’s closing price before entering a position.
To confirm this pattern, crypto traders should ensure that the small black/red candle appears at the bottom of a downtrend. Additionally, there should be an obvious downtrend taking place, as indicated in the image above. Traders must also confirm that the body of the white or green candle has completely “engulfed” the small bearish candle. A really tall white candle signals a strong bullish engulfing candlestick pattern.
Hammer pattern
The hammer is a single candlestick pattern at the bottom of a downtrend. It has a short body and a long wick at the bottom, creating the shape of an upright hammer. The hammer is a reversal pattern, indicating buyers resisted selling pressure, and prices could start climbing again.
However, traders must wait for confirmation before they can make any moves. For instance, traders can wait for subsequent bullish candles to appear.
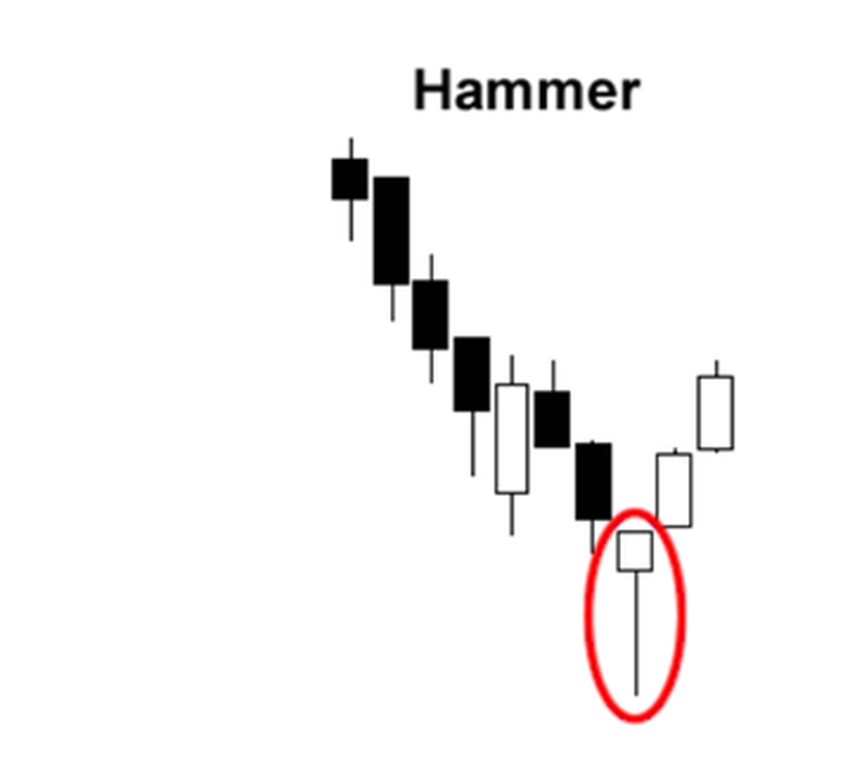
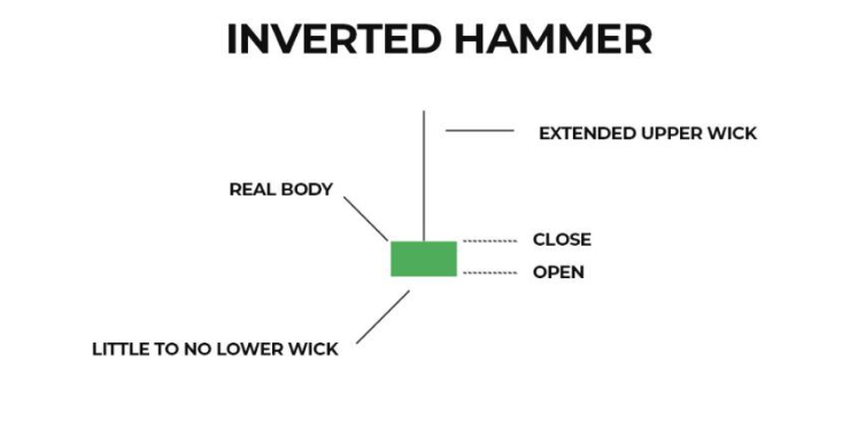
An inverted hammer also suggests buyers could soon take over the market, and prices may soar. Nonetheless, an inverted hammer has a long upper wick and a short body. Therefore, its shape is similar to an upside-down hammer. The inverted hammer may or may not have a small lower wick.
Morning star pattern
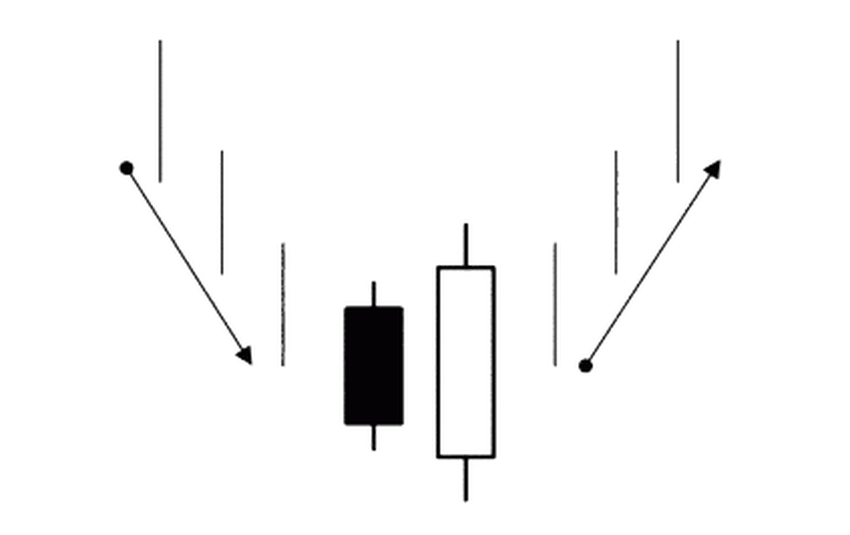
The morning star pattern consists of three candlesticks, with the middle one forming a star. It warns traders that a downtrend could bottom out, and a reversal may happen. The first candle in this pattern is a black or red candle with a long body. It reveals that a downtrend is taking place, and the bears are in charge.
The second candle is short and portrays a period of uncertainty with a star. On the other hand, the third candle is green or white with a long body. It closes above the midpoint of the first candle. A gap on both sides of the middle candle signals a strong chance of reversal.
Piercing pattern
The piercing pattern signals the reversal from a downtrend to an uptrend. The pattern features a long red or black candle on the first day. This implies sellers are in control. On the second day, a long green or white candle follows, signaling a strong response from buyers. The second candle closes above the midpoint of the first candle suggesting that buyers have taken over. There must be an obvious downtrend for traders to confirm the piercing candlestick pattern.
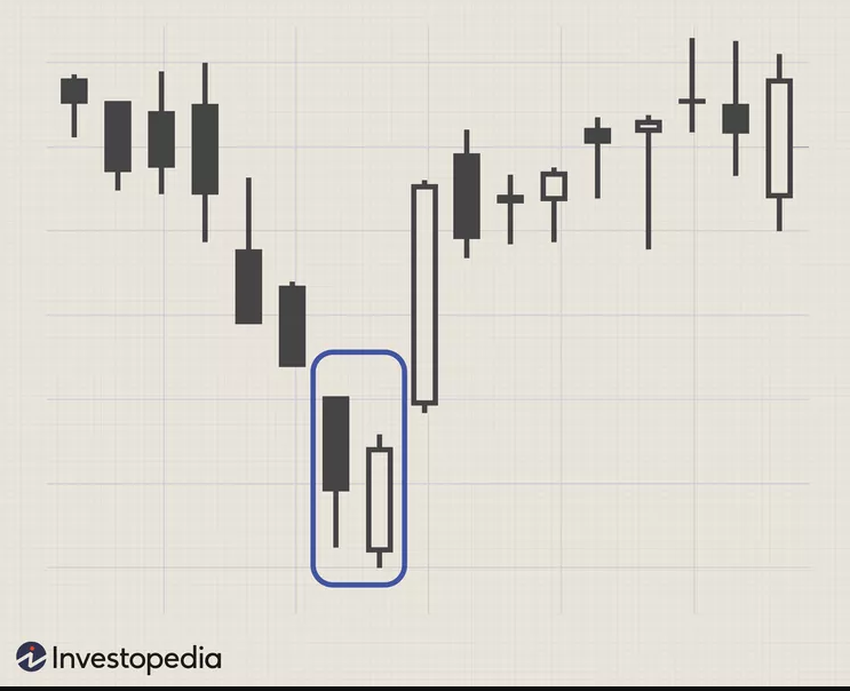
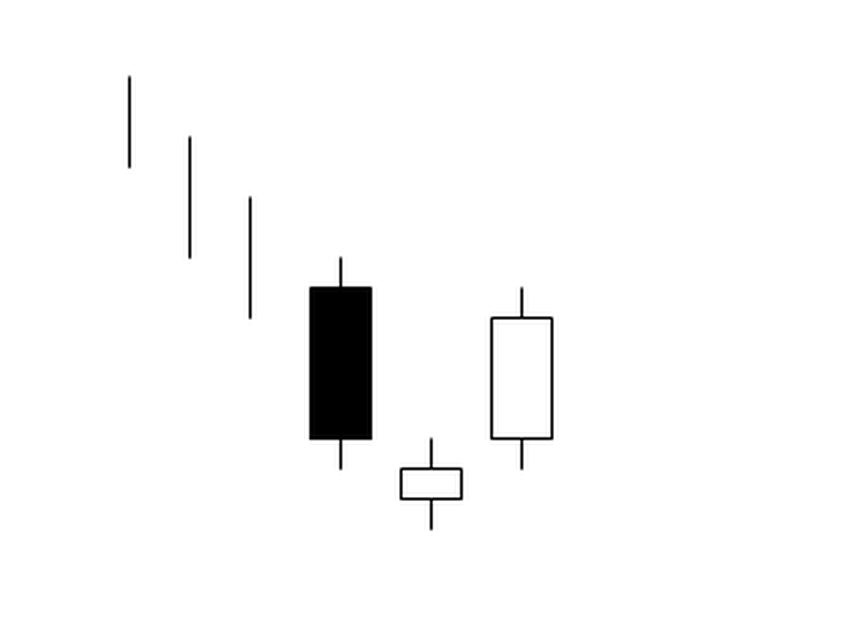
Bullish harami pattern
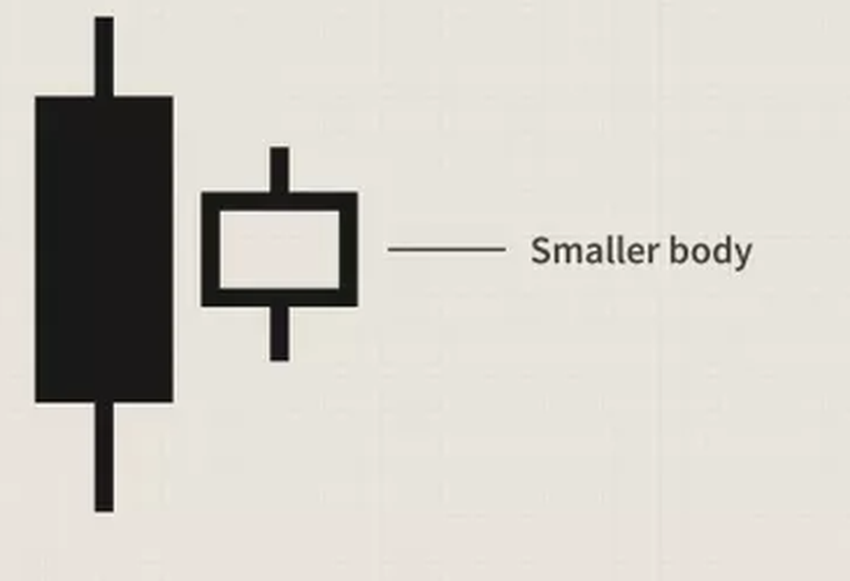
The bullish harami candlestick pattern has two candles revealing that a downtrend is ending. The first candlestick has a large body that encloses the second small candlestick. This candlestick pattern creates the appearance of a pregnant lady.
The first candle is bearish, while the second one is bullish. Traders can confirm this pattern when the second candlestick opens above the first candle while remaining enclosed within it. The second candle may look like a doji or spinning top. A doji indicates a place where bulls and bears meet. It doesn’t have a body because the opening and closing prices are the same. Therefore, a doji generally looks like a cross. On the contrary, a spinning top is a candle with a neutral body. Its body is small, with long wicks of equal size at the bottom and top.
Bullish continuation patterns
These patterns indicate that an identified bullish trend would continue after there has been a temporary pause and a breakout has occurred. Some of the bullish continuation patterns that have been identified are explained below.
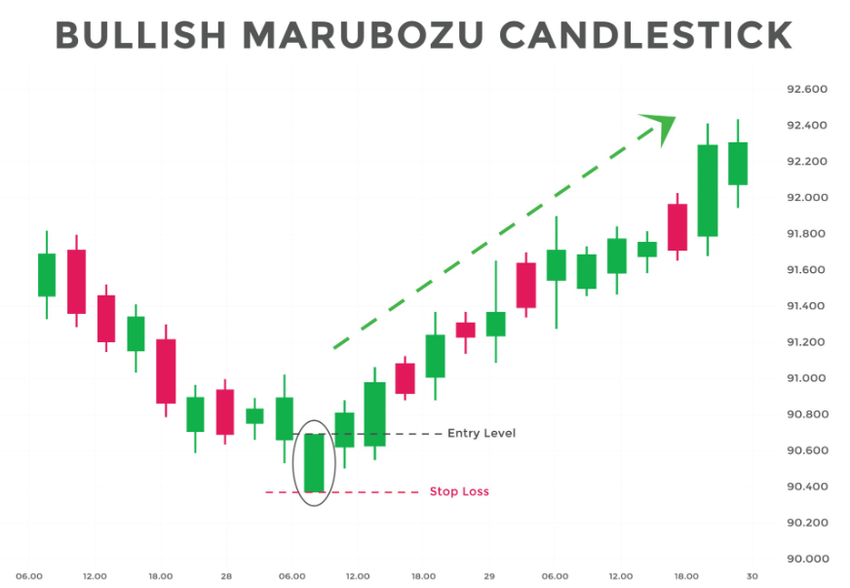
Bullish marubozu pattern
The bullish marubozu pattern is easy to spot because it is represented by a single candle with a full body. Since it has no wicks, the bullish marubozu looks like a rectangular block and is green in color. This pattern signals that an asset is trading in one direction. The candle could lead to a continuation of a bullish trend.
A bullish marubozu implies that buyers were in control during its formation. Its price opens at the lowest point and closes at the highest. Traders will rarely spot a bullish marubozu on its own. So, there’s a high uptrend potential when this pattern appears.
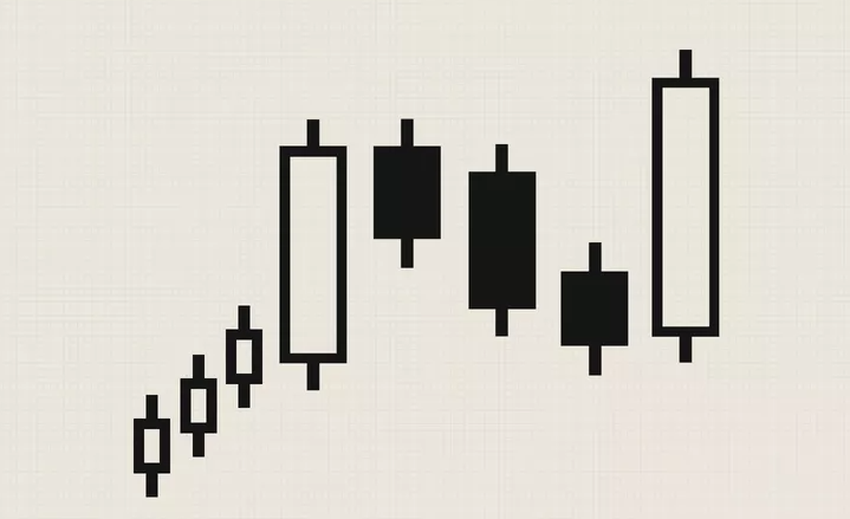
Rising three methods pattern
The rising three methods is a bullish continuation pattern that occurs in an uptrend. It consists of at least five candlesticks but may have more. The rising three methods pattern forms when a white or green candle with a long body precedes three or more black/red candles with short bodies. The three short candles must be enclosed within the highest and lowest prices of the first candlestick. For traders to confirm this pattern, the fifth candlestick must be bullish and close above the previous candles.
The first bullish candle indicates that the bulls are strong, while the three candles form when the price pauses for some time. However, the bears fail to push the price below the bottom of the previous candle. As a result, the bulls take over, creating the fifth bullish candlestick.
Other bullish candlestick patterns
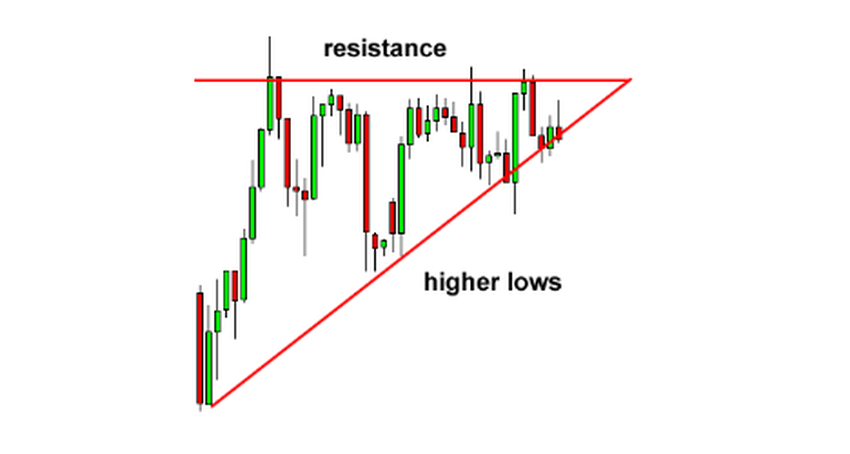
Ascending triangle
An ascending triangle forms when there is a resistance level that buyers cannot overcome. The candlestick pattern also features a slope of higher lows. These higher lows indicate that buyers are slowly pushing the price up. If the buying pressure becomes stronger, a breakout could happen. Nonetheless, the resistance level may prove too strong to resist, causing prices to drop. Traders should therefore use other indicators to confirm if a bullish trend is imminent.
Bull flag pattern
A bullish flag pattern occurs in an uptrend. The first part of this pattern depicts that the price of an asset is experiencing a strong uptrend. A flag pole denotes this price rise. The price then consolidates, forming the flag shaped like a rectangle sloping downwards. Next, the price breaks out of this range, and the uptrend resumes. The image below shows the flag right after a pole is formed.
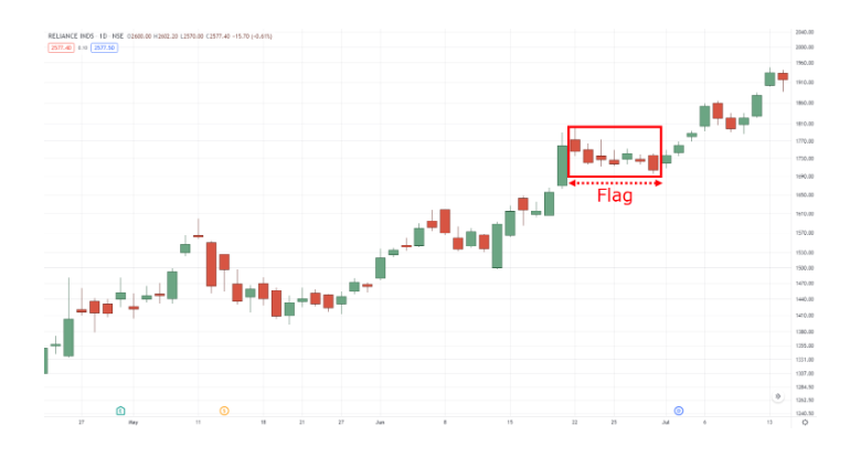
The bull flag pattern helps traders enter their position in the middle of a trend. After spotting a pole, traders should look for a group of indecision candles to confirm this pattern.
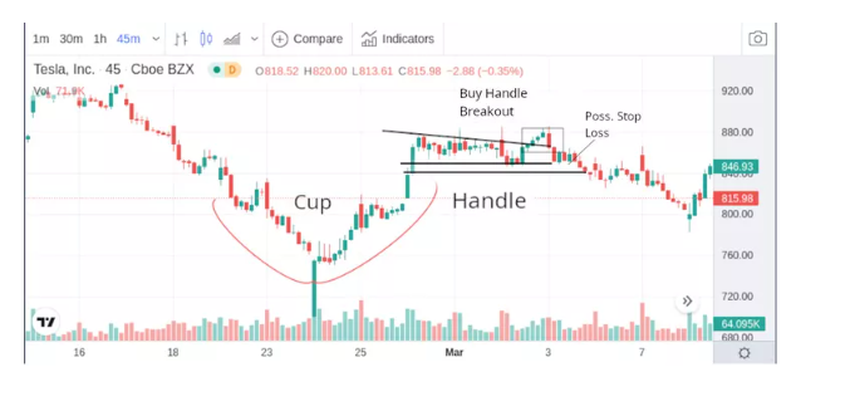
Cup and handle pattern
The cup and handle pattern has two parts. The first part is shaped like a cup, while the second looks like a handle. It appears when the price of a digital asset is on a downtrend, followed by a period of stabilization. The price then climbs, creating a “U” or cup shape. Next, the price moves sideways or downwards in a short range, forming the handle. The price then breaks out and resumes an uptrend.
Traders must wait for the handle to form completely before making a move. It’s also prudent to use a stop loss when trading since there’s no guarantee that the price will continue rising after the cup and handle pattern appears.
Which candlestick pattern is most bullish?
The most reliable bullish candlestick pattern may vary from trader to trader. According to Investopedia, bullish engulfing and the ascending triangle are the most favorable candlestick patterns because they are easier to identify.
That said, it’s essential to study subsequent candles before making trading decisions based on any bullish candlestick pattern, including the engulfing and ascending triangle patterns. Traders should also use momentum indicators and other trading strategies alongside bullish candlestick patterns.
While candlestick patterns and other forms of technical analysis may give traders an idea of a market’s price direction, their accuracy isn’t guaranteed.
“In reality, nobody has a clue what any given market will do,” professional trader Peter Brandt advises.
Trading strategies using bullish candlestick patterns
As mentioned earlier, using bullish candlestick patterns alone isn’t ideal. Below are some trading strategies you can utilize alongside bullish candlestick patterns:
Relative strength index (RSI)
RSI is a momentum indicator that measures the strength of a price movement. It is scaled from 0 to 100. The market conditions are oversold when the RSI reading is 30 or lower. It also predicts that the price could go up. Conversely, a reading of 70 or higher suggests that market conditions are overbought and prices could drop.
Moving average convergence divergence (MACD)
MACD is a momentum indicator that depicts whether a trend is bullish or bearish. MACD charts use three numbers for their settings. The first and the second numbers represent the number of periods for calculating the faster-moving average and slower-moving average, respectively. Additionally, the third number denotes the number of bars for calculating the moving average (the difference between the faster and slower moving averages).
Risk management with stop-loss orders
Risk management entails using stop-loss orders to minimize potential losses while trading. A stop-loss order is an instruction to the exchange to buy or sell a digital asset when it hits a specified price. Besides reducing losses, stop-loss orders allow traders to lock in gains, eliminate frequent trade monitoring, and trade free of emotions.
Don’t use candlestick patterns in isolation
Candlestick patterns are suitable for spotting bullish trends. However, it’s important to complement these patterns by using momentum indicators and other trading strategies.
Moreover, you should probably also keep an eye on market-moving news because no chart analysis tool will predict how the market will respond to a big market-moving headline.


