


The price of Stellar (XLM) has experienced a decline since reaching its yearly high on July 13. However, it’s currently trading within a continuation pattern, which indicates the potential for a breakout in the future.
Furthermore, both the price action and wave count analysis indicate that the overall trend remains bullish. As a result, there is a possibility that XLM could soon achieve a new yearly high.
Stellar Price Trades in Middle of Long-Term Range
Upon examining the technical analysis on the weekly time frame, several XLM observations can be made:
At the beginning of January, XLM broke out from a 616-day resistance line. Two months later, this former resistance level was validated as support, and the upward movement continued. This breakout from a significant long-term level often signals the beginning of a bullish trend reversal.
Following the breakout from the long-term resistance line, the price also surpassed the $0.105 horizontal resistance area, further confirming the bullish breakout. This led to a new yearly high of $0.195 in July.
Be the oracle of your crypto future. Get price predictions here:
However, after reaching this high, XLM experienced a notable decline, forming a long upper wick (red icon). This upper wick suggests that there was selling pressure, indicating that buyers might lack the strength to sustain the price increase.
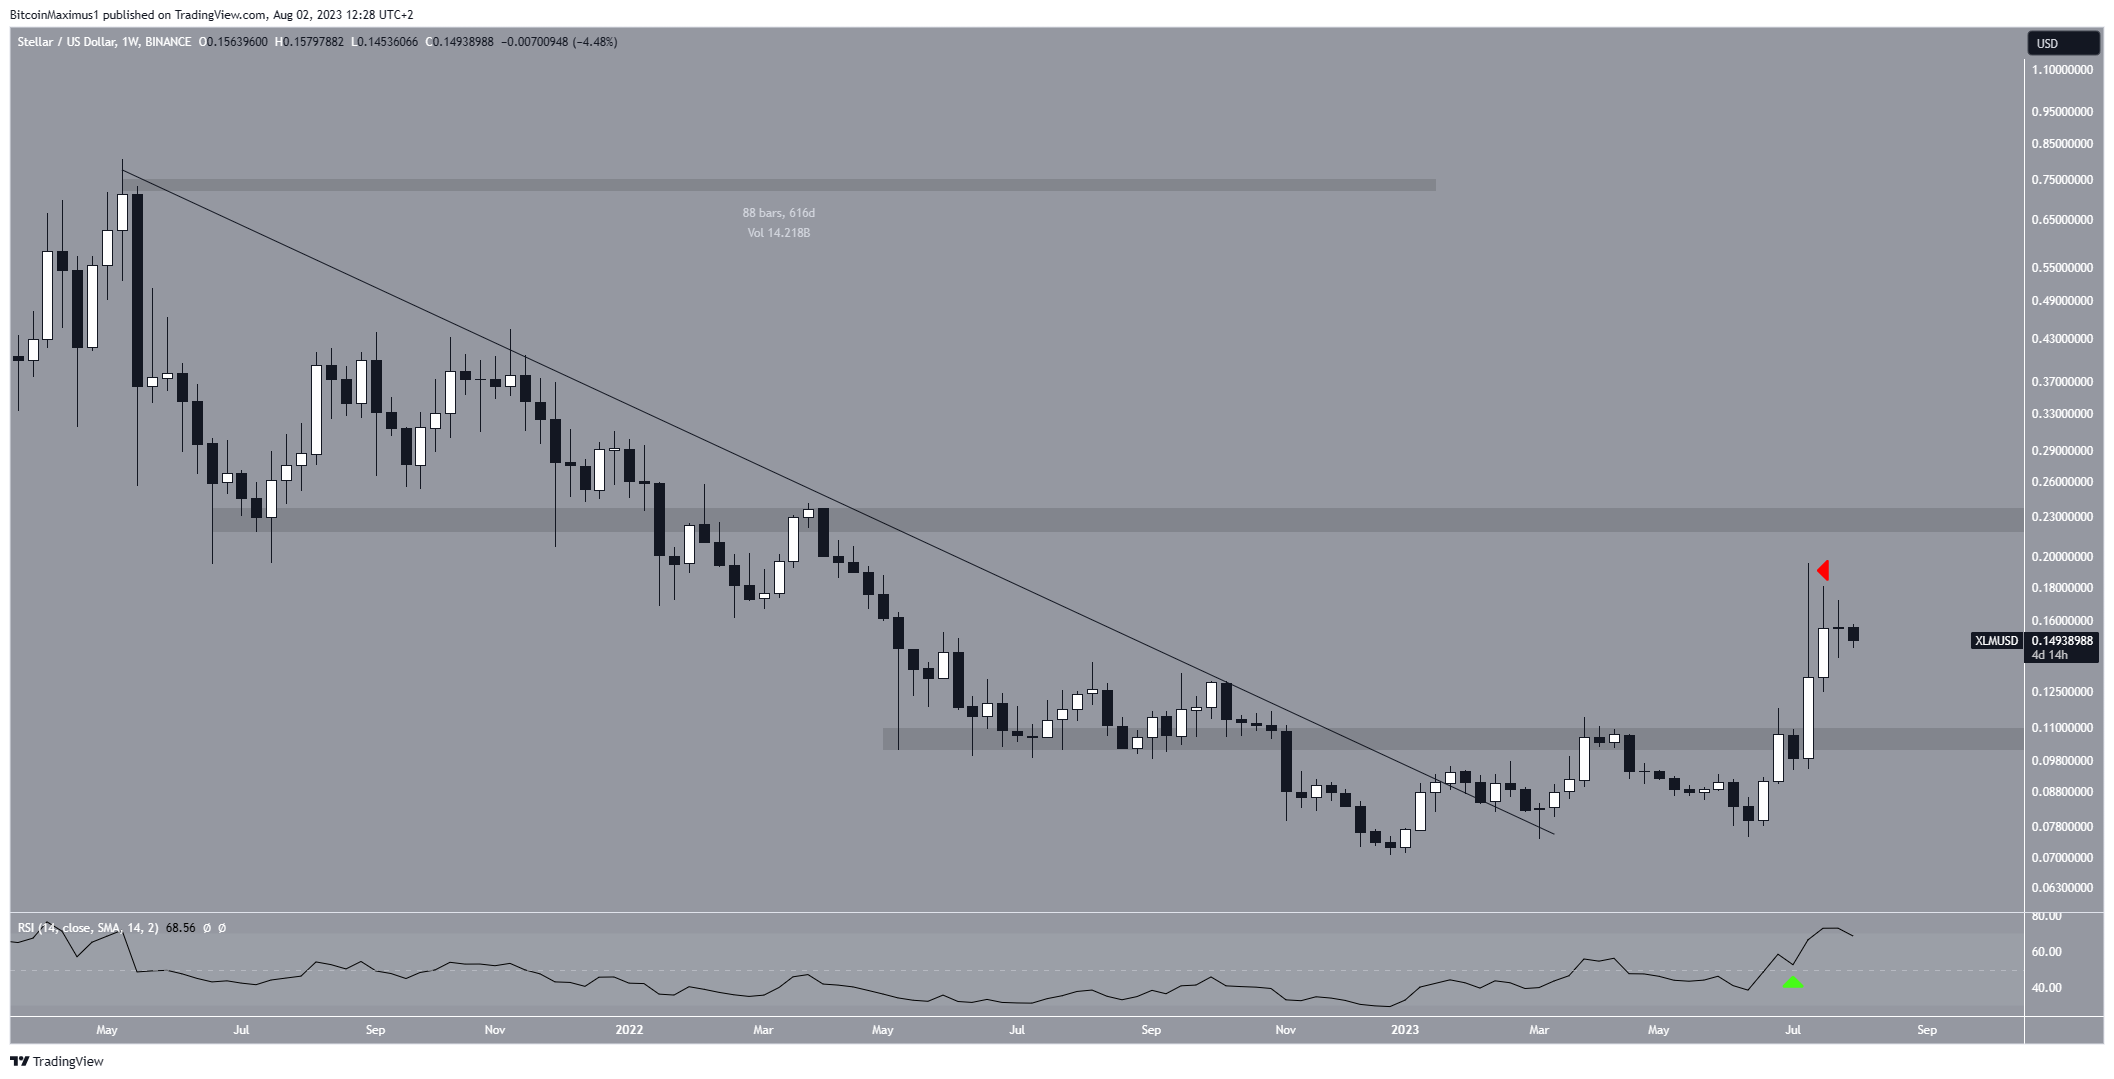
On the weekly chart, the Relative Strength Index (RSI) is providing a positive signal. The RSI is a commonly used momentum indicator by traders to assess whether a market is overbought or oversold, helping them make decisions about buying or selling an asset.
An RSI reading above 50, coupled with an upward trend, suggests an advantage for the bulls, while a reading below 50 indicates the opposite. In the case of XLM, the RSI is rising and remains above 50, both of which are signs of a bullish trend.
XLM Price Prediction: Wave Count Gives Bullish Signal
Based on the analysis conducted using the Elliott Wave theory on the daily timeframe, there is a positive outlook for the future price of XLM. The Elliott Wave theory is used by technical analysts to study long-term price patterns and investor psychology in order to predict market trends.
According to the current Elliott Wave count (white lines), XLM’s price seems to be in the fourth wave of a five-wave upward movement. This fourth wave has formed a triangle pattern, which is commonly observed during this phase of the wave.
Assuming this count is accurate, it suggests that the price has already reached a local low (green icon). Moreover, it indicates that XLM is nearing the end of its consolidation pattern.
therefore, XLM is expected to break out from the triangle pattern and rise towards the next resistance level at $0.23. This will result in an increase of slightly more than 50% from the current price. Once the five-wave uptrend is complete, there might be a corrective phase.
A close above the triangle’s resistance line will confirm this bullish count.
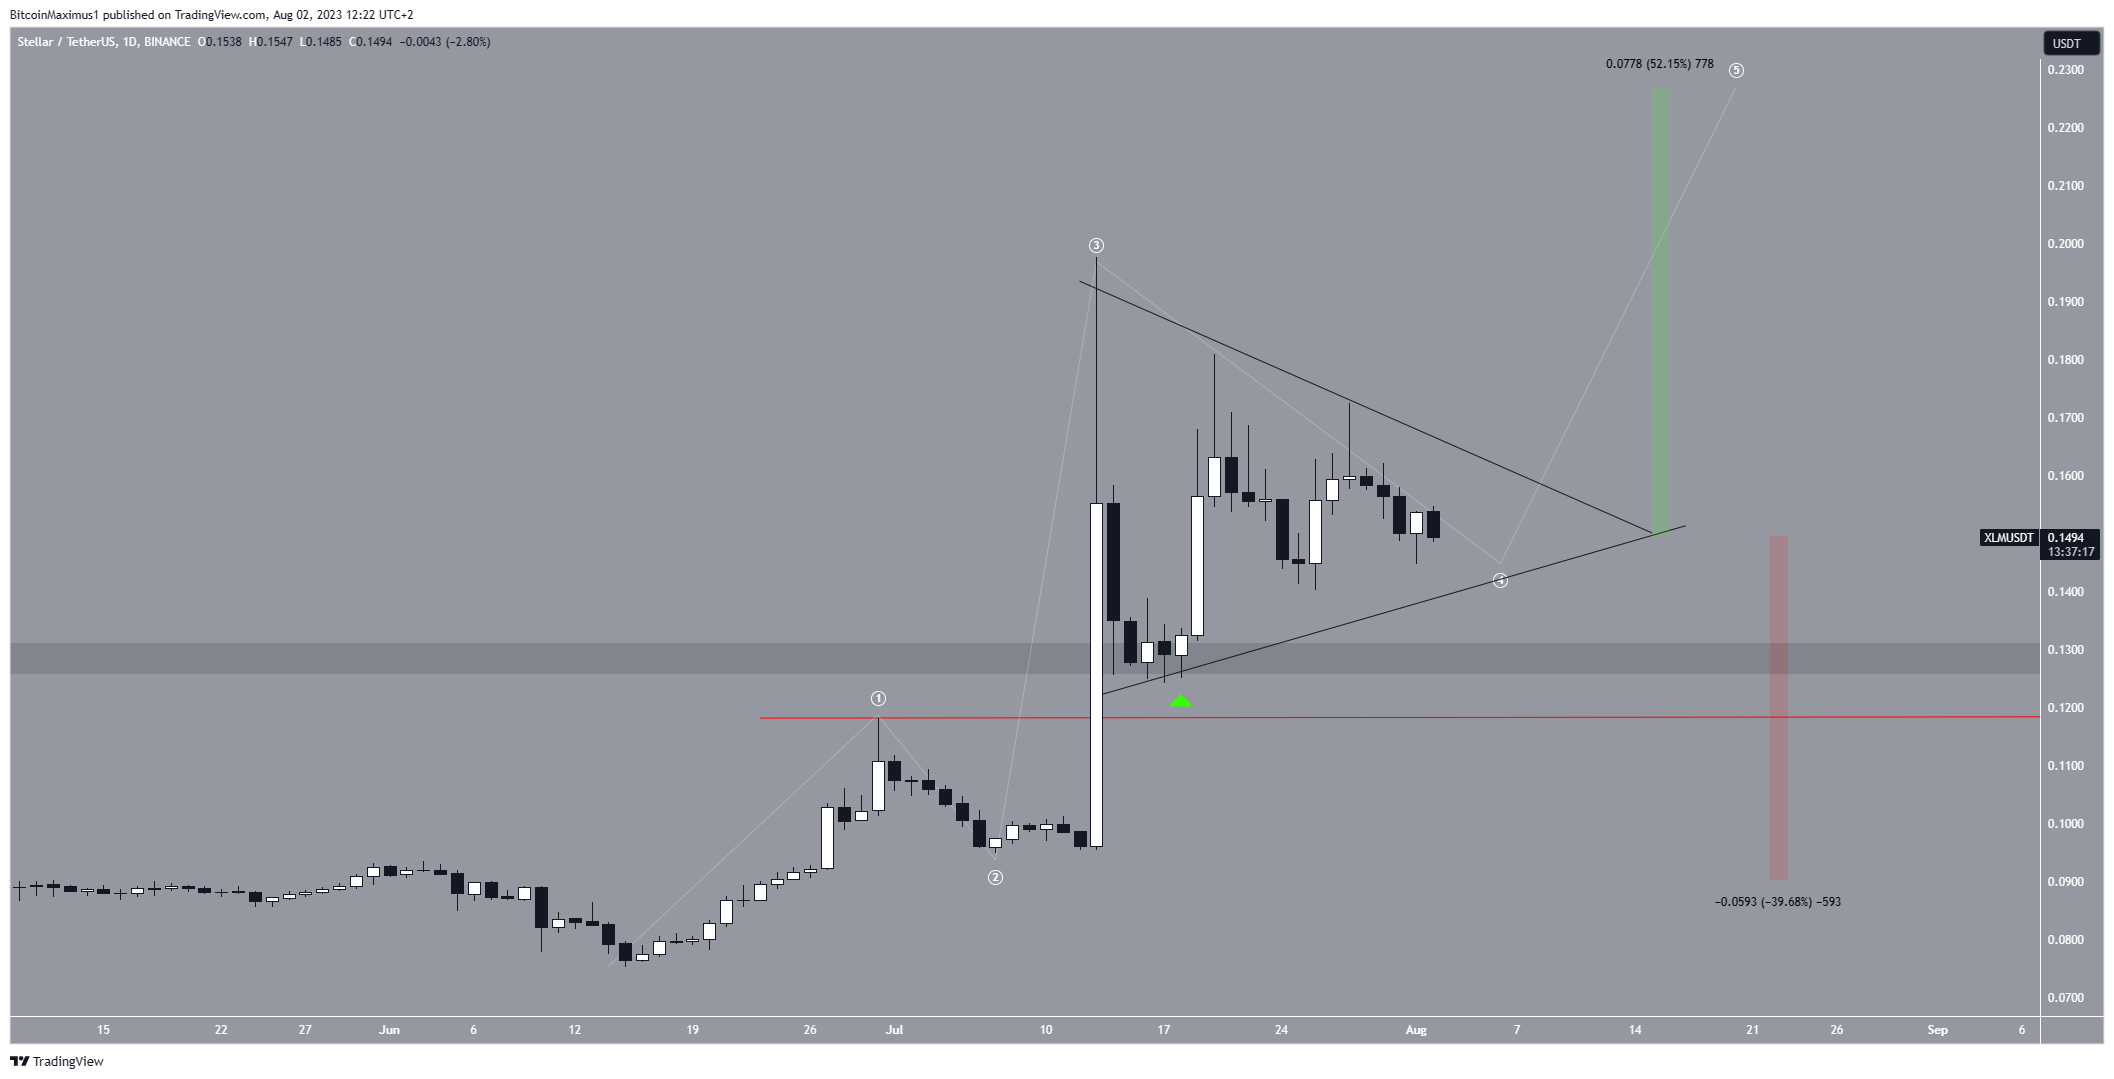
However, despite this bullish XLM price prediction, a decrease below the wave one high (red line) at $0.12 will mean that the trend is bearish. In that case, the XLM price will likely fall to the next support level at $0.09, a drop of 40% measuring from the current price.
Read More: 11 Best Crypto Portfolio Trackers in 2023
For BeInCrypto’s latest crypto market analysis, click here.


