


The Stellar (XLM) price has exceeded long and short-term diagonal resistance levels, a positive sign for the future price. What can be expected for the price of XLM moving forward?
There are numerous bullish signs for XLM in various timeframes, indicating that the trend is bullish, and a significant price increase could follow soon.
Stellar Price Moves Above Long-Term Resistance
Stellar’s value has increased steadily since the beginning of the year, with a notable breakthrough occurring in January. At the time, when the price broke through a descending resistance line that had been in place since the all-time high. Significant upward movements often follow such breakouts from long-term structures, since they signify the correction has ended.
After confirming the resistance line as support (indicated by a green icon), the price of XLM surpassed the long-standing resistance level of $0.100. Marking a positive trend for buyers. If the price continues to rise, the next resistance level will be at $0.235, which can be seen drawn on the chart.
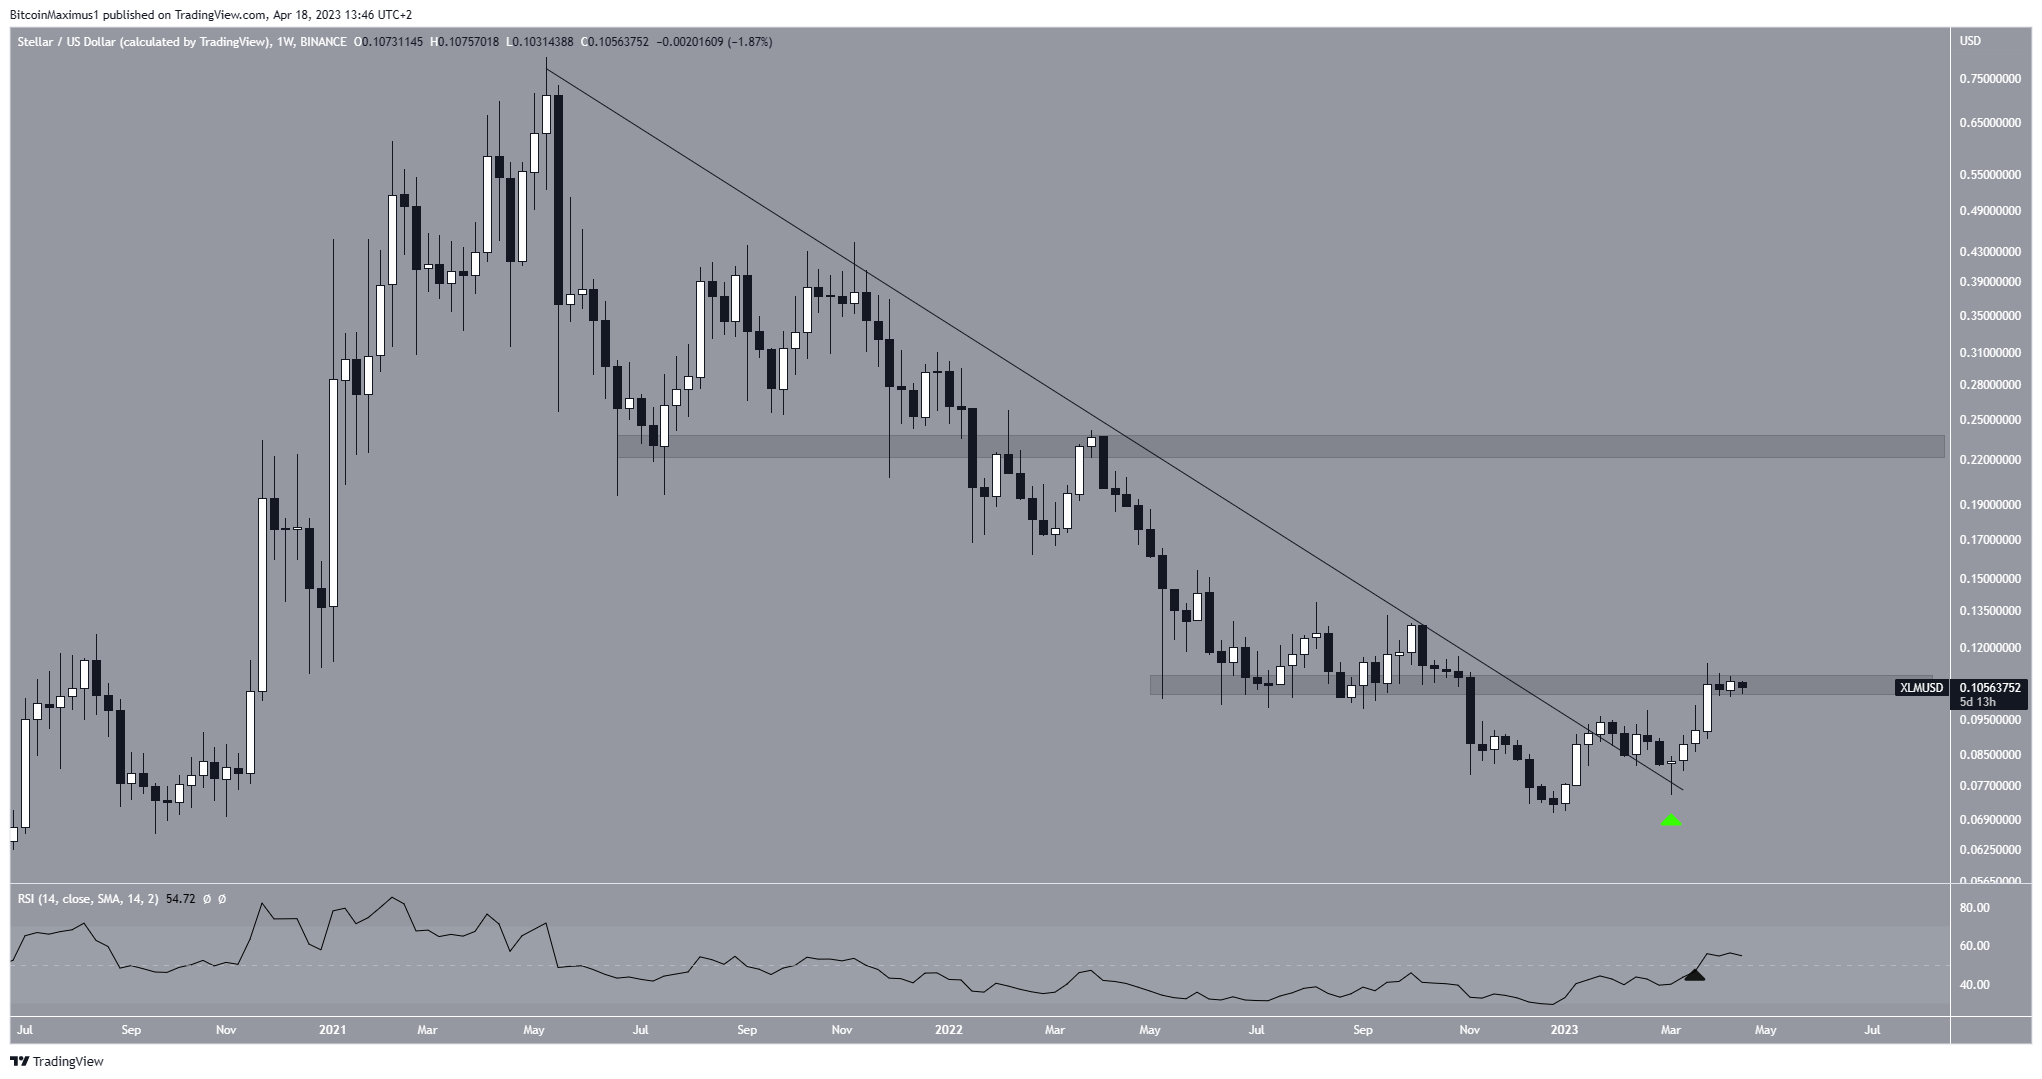
The weekly Relative Strength Index (RSI) also supports the ongoing increase, having surpassed the 50 level (indicated by a black icon). The RSI is a tool that helps traders understand if an asset is overvalued or undervalued by measuring how quickly its price is changing. Furthermore, it looks at how fast the price has moved recently to determine the right time to buy or sell. Movements above 50 are a sign that buyers have momentum.
XLM Price Prediction: Wave Count Supports Increase
The daily technical analysis of the price trend confirms the positive Stellar price forecast made by the weekly analysis. Therefore, it bodes well for the future price. On March 21, the price broke through a downward resistance line and climbed to a new high for the year of $0.114 on April 1.
Using Elliott Wave theory, it is likely that the price increase seen since the start of the year is part of a five-wave pattern, with the price currently in wave three (white). The shorter-term sub-wave count is in black. The fact that wave three is longer than wave one supports the idea that the increase is impulsive.
Elliott Wave theory is a tool that technical analysts make use of. Essentially, it looks for recurring long-term price patterns and investor psychology in order to determine the trend’s direction.
Therefore, the next likely target for the top is an average price of $0.121. This would give waves one and three a 1:1.61 Fib ratio. Fibonacci retracement levels operate as a set of horizontal lines derived from the Fibonacci sequence. These indicate key areas of support and resistance that may be encountered. So the entire price increase could end close to the resistance area at an average price of $0.150.
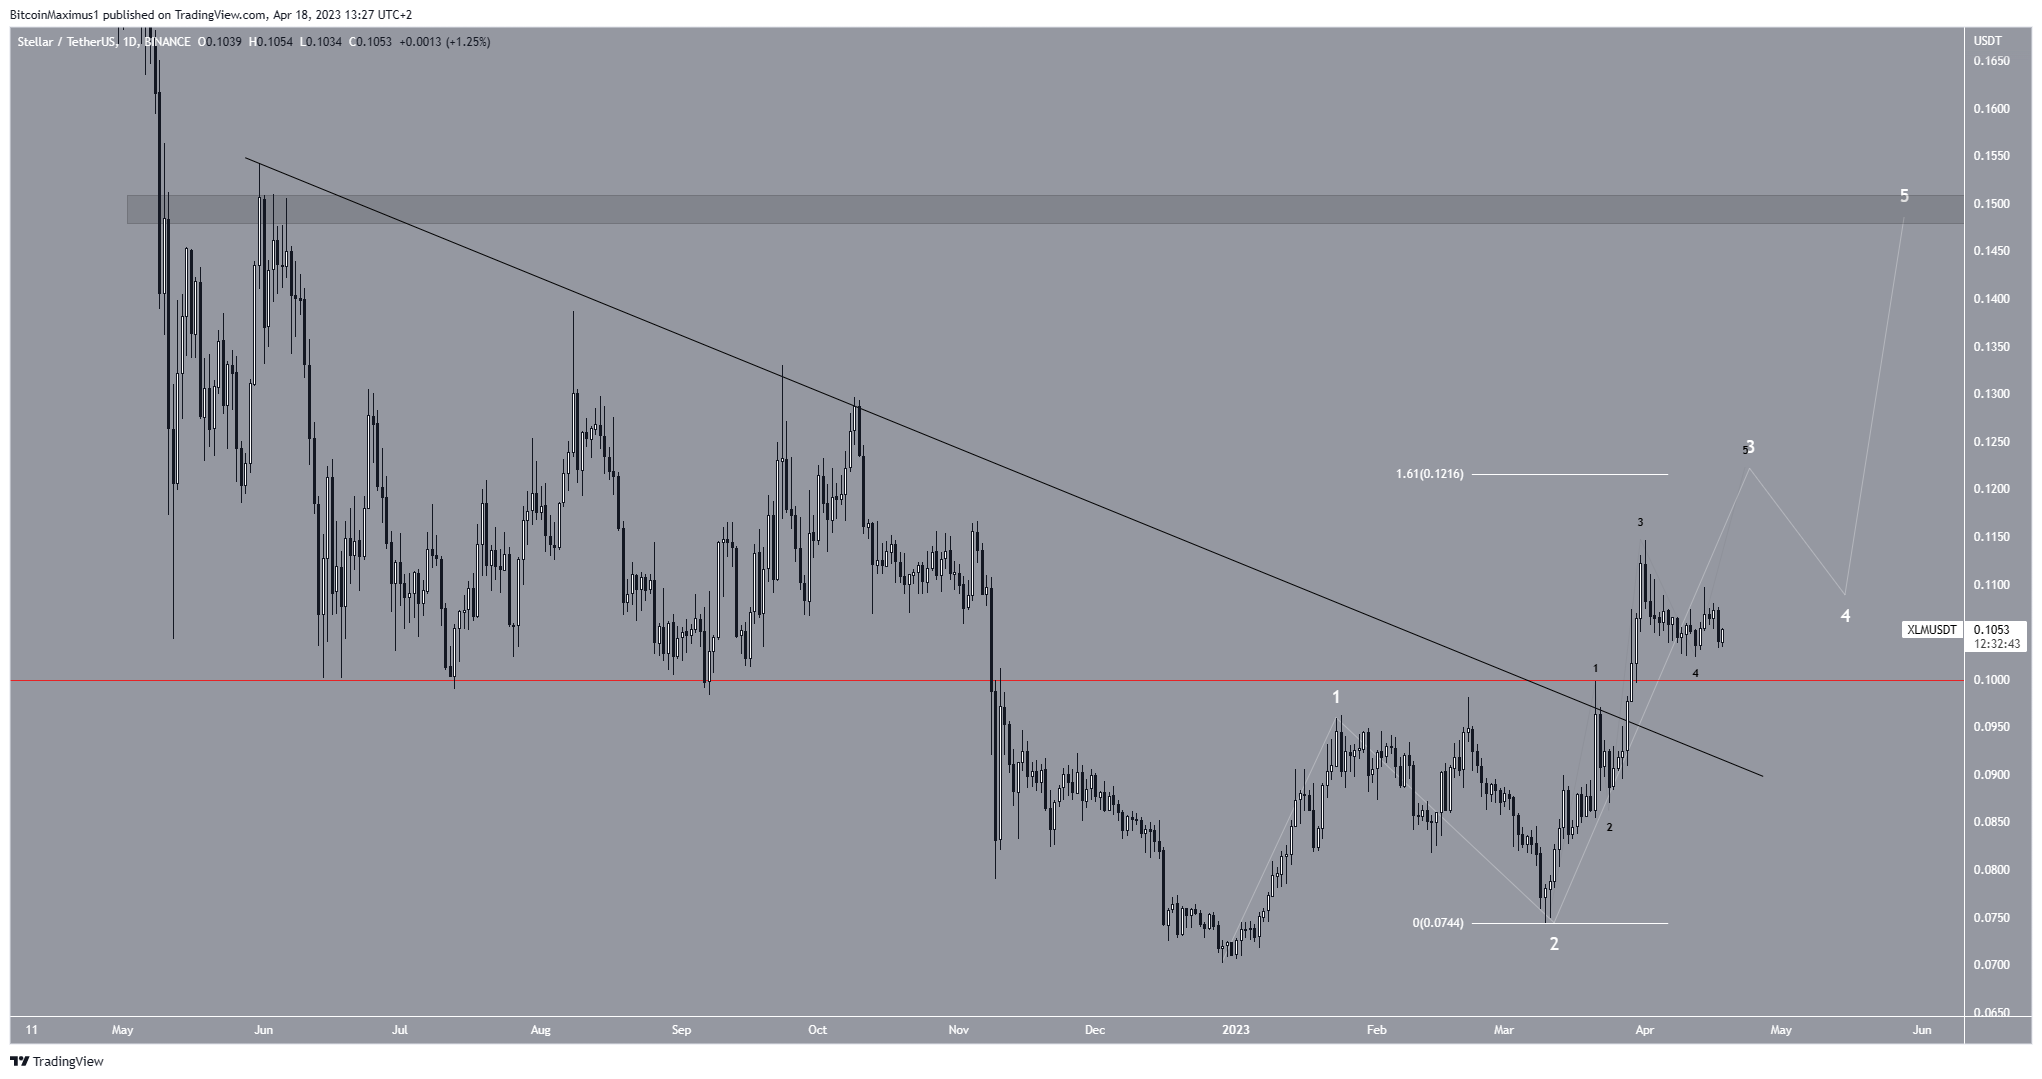
Ultimately, the most likely XLM price prediction is an increase toward the next resistance at $0.150. However, if the price falls below the sub-wave one high (marked by the red line) at $0.099, then it could be invalidated. In which case the XLM price could see a drop to $0.070.
For BeInCrypto’s latest crypto market analysis, click here.


