


The Stellar (XLM) price has fallen since its yearly high on July 13. However, it is trading inside a continuation pattern which could lead to a breakout.
Moreover, the price action and wave count both suggest that the trend is still bullish. Therefore, a new yearly high could occur soon.
Stellar Price Hits Roadblock, but Trend Remains Bullish
A look at the time frame technical analysis shows that XLM broke out from a 616-day resistance line at the beginning of January. After validating it as support two months later, it resumed its upward movement. Breaking through this significant long-term level often indicates the start of a bullish trend reversal.
Next, the price broke out from the $0.105 horizontal resistance area, legitimizing the breakout from the long-term resistance line. This led to a new yearly high of $0.195 in July.
However, after reaching the high, XLM experienced a considerable decline, forming a long upper wick (red icon). This indicates selling pressure, suggesting that buyers may lack the strength to sustain the price increase.
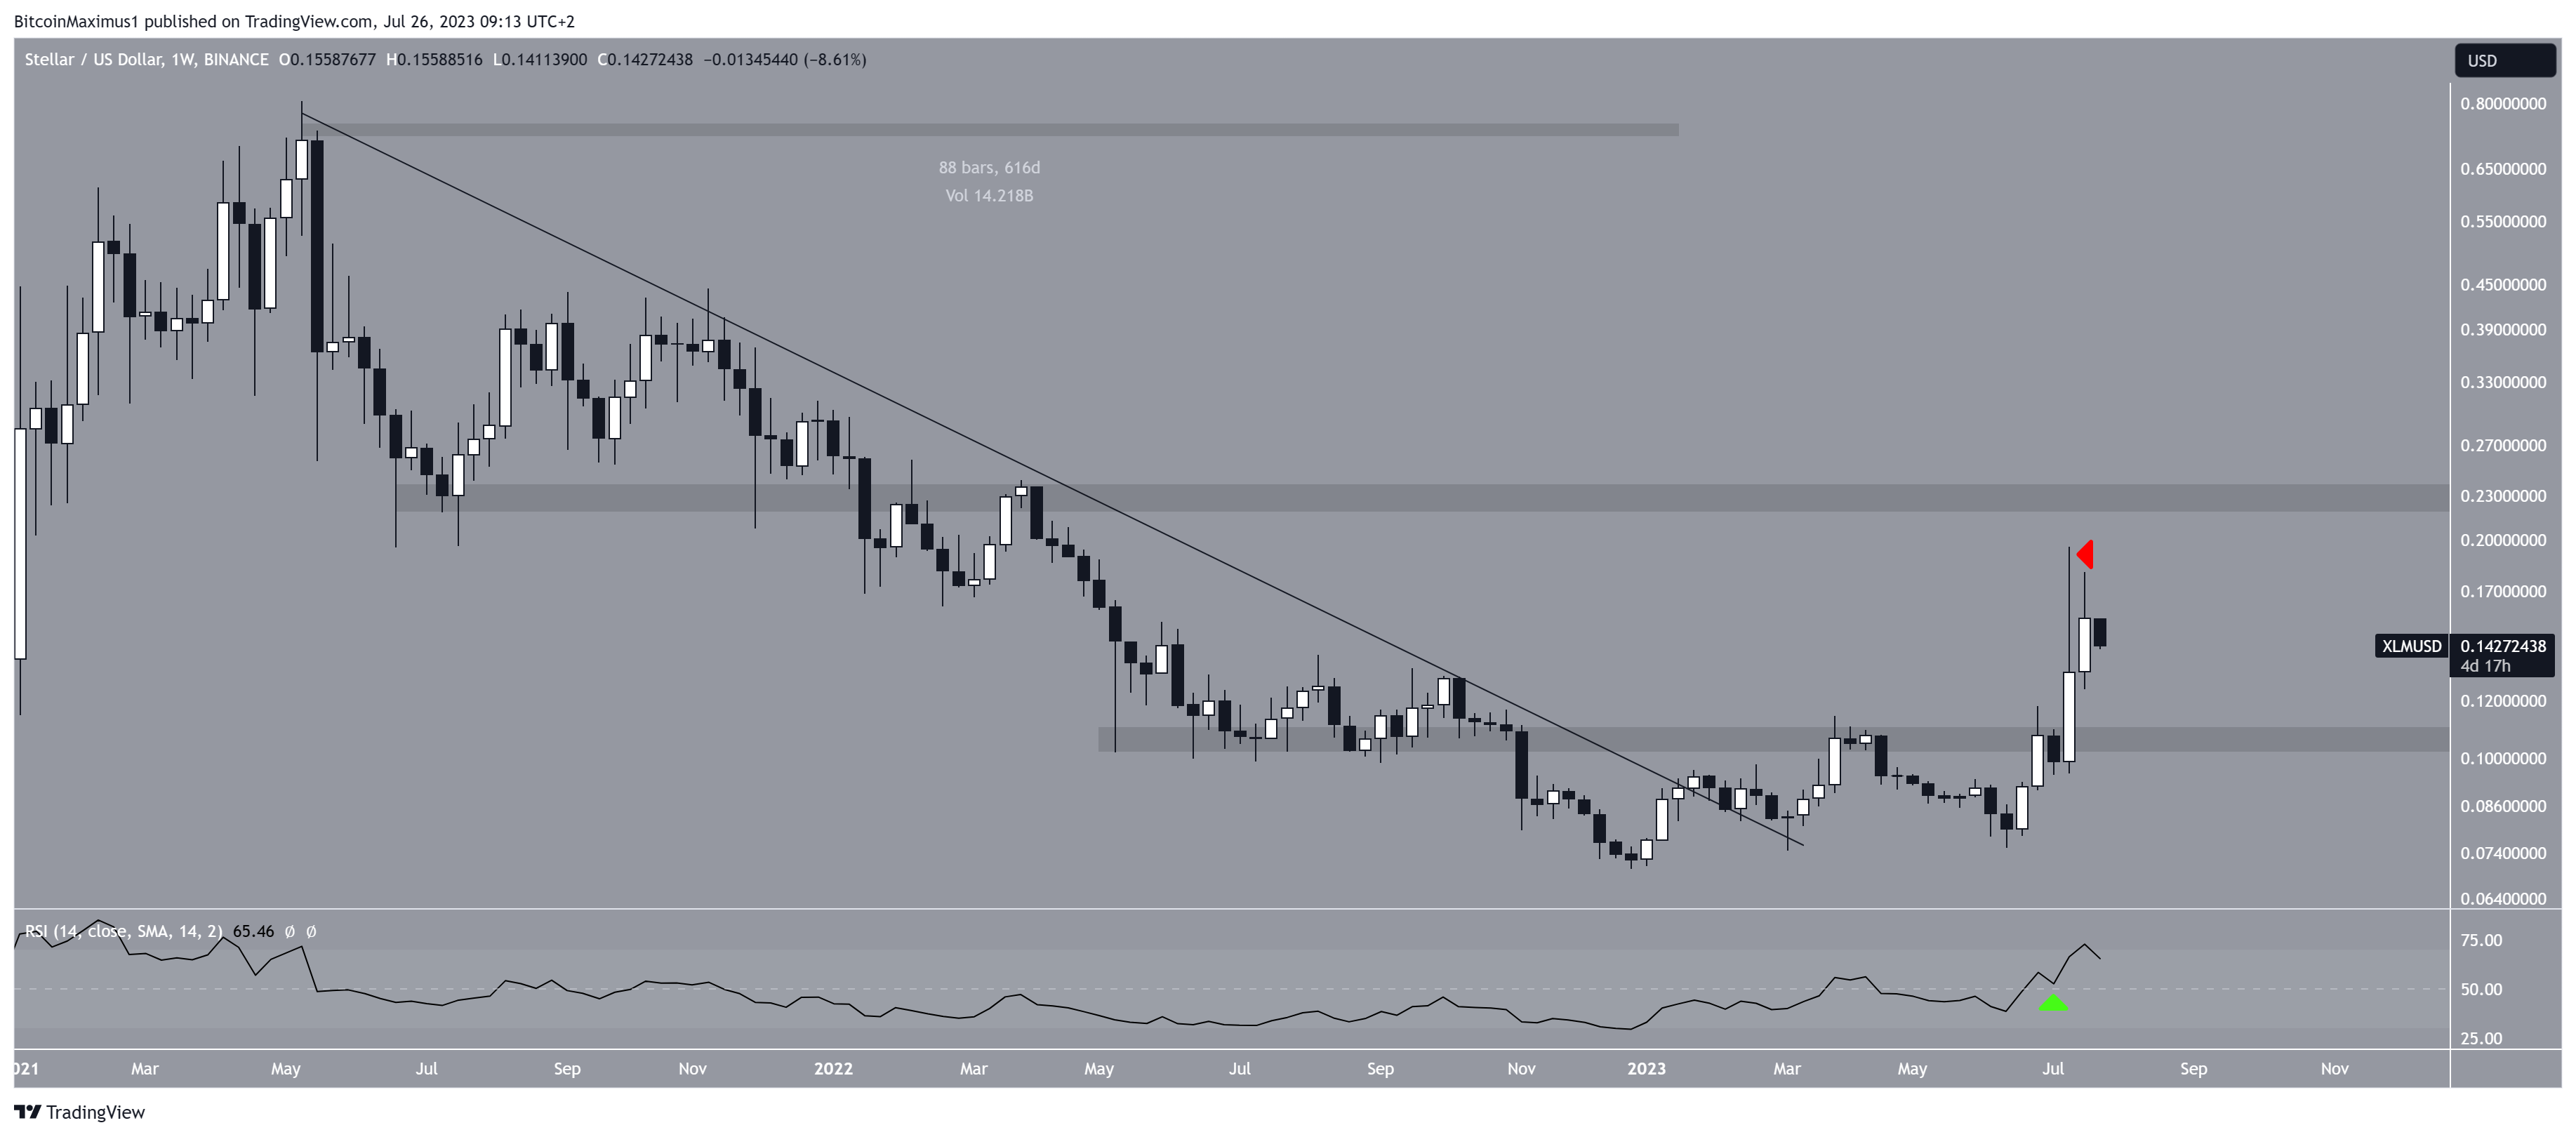
The weekly Relative Strength Index (RSI) is showing a positive signal. Traders commonly use the RSI as a momentum indicator to determine whether a market is overbought or oversold, helping them decide whether to buy or sell an asset.
An RSI reading above 50 with an upward trend suggests an advantage for the bulls, while a reading below 50 indicates the opposite. The RSI is rising and remains above 50, both of which are signs of a bullish trend.
XLM Price Prediction – Consolidation Before Breakout?
Based on the Elliott Wave analysis conducted on the daily timeframe, there is a bullish outlook for the future price of XLM. Technical analysts who employ the Elliott Wave theory examine long-term price patterns and investor psychology to make predictions about market trends.
As per the current Elliott Wave count (white), XLM’s price appears to be in the fourth wave of a five-wave upward movement. This fourth wave has formed a triangle pattern commonly observed in this wave phase.
Assuming this count is accurate, it suggests that the price has already reached a local low (green icon). After some consolidation, it is expected to break out from the triangle and increase toward the next resistance level at $0.23. After completing the five-wave uptrend, there might be a corrective phase.
Confirmation of this possibility would come from a breakout from the triangle pattern.
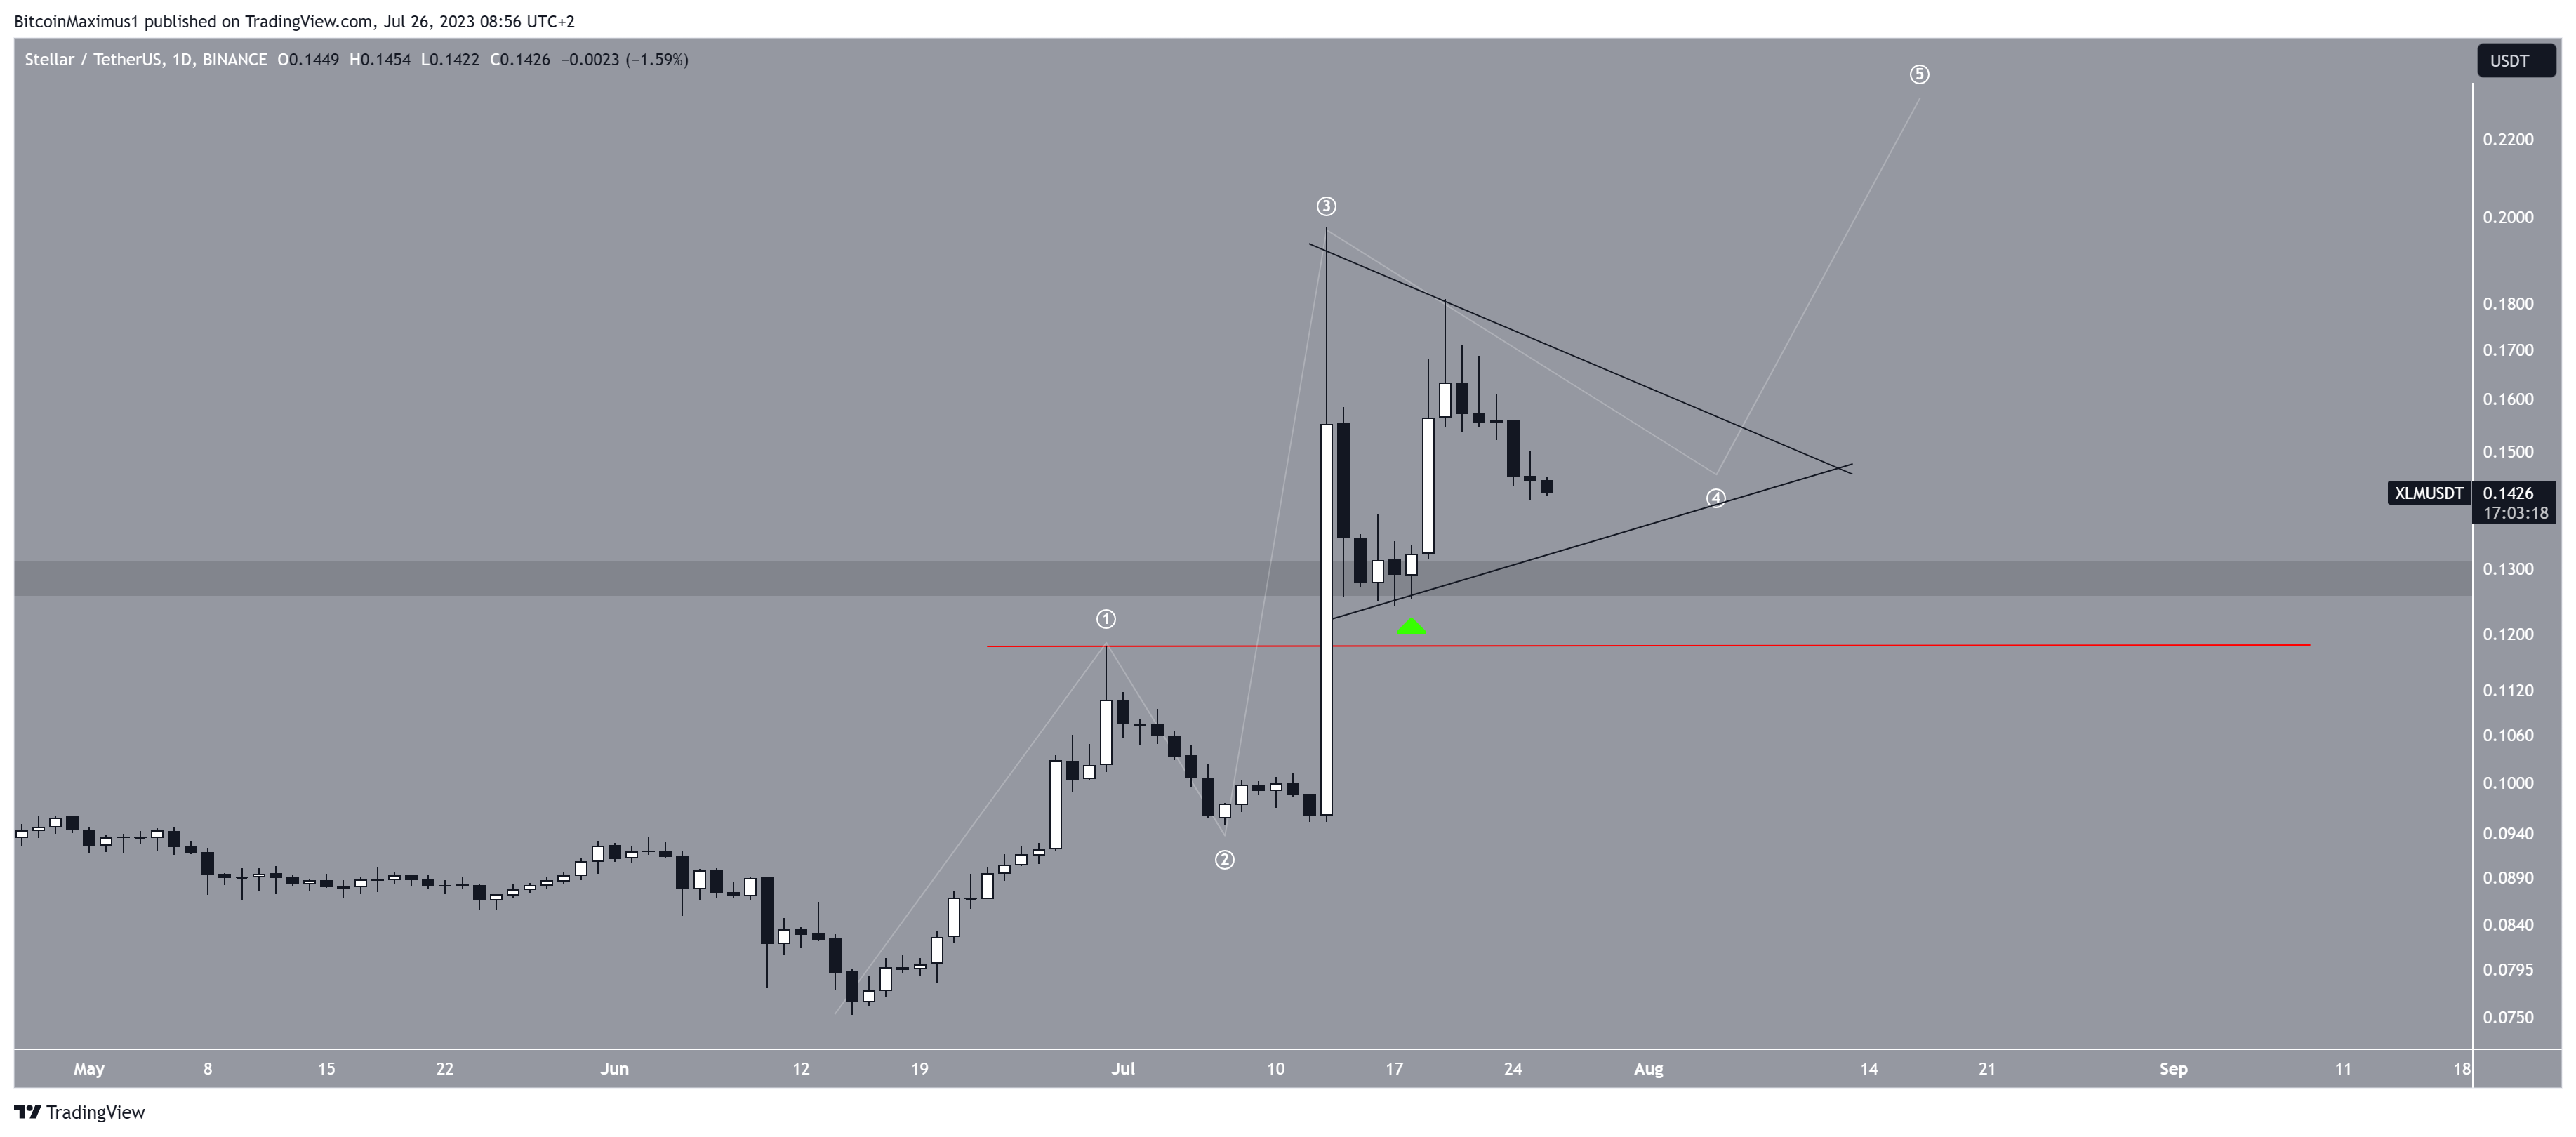
It’s essential to keep in mind an important condition despite the bullish XLM price prediction. If the price falls below the high of wave one (red line) at $0.12, it will invalidate the bullish outlook.
The trend could turn bearish in such a scenario, and XLM’s price might decline to the next support level of $0.09.
Read More: 11 Best Crypto Portfolio Trackers in 2023
For BeInCrypto’s latest crypto market analysis, click here.


