The Solana (SOL) price continues to undergo a corrective phase, prompting speculation about further declines or a potential upward reversal.
Initially, Solana exhibited a rebound from the golden ratio support situated around $125. However, contrary to expectations of mitigating the corrective trajectory, the price appears to be descending further.
Tracking Solana: A Short History of SOL Price Developments
After reaching a local high near $209, Solana experienced a sharp correction to approximately $162.5, signaling the onset of a corrective phase. Subsequently, the formation of a lower high confirmed the continuation of the corrective movement.
Following a bounce from the golden ratio support around $125, Solana briefly surged to the 50-day EMA at around $155, only to face resistance and undergo another corrective period. Presently, Solana finds notable Fibonacci support around $143.
A potential rebound from this support level could propel Solana towards retesting the 50-day EMA at $155, with further upside potential towards the golden ratio near $175. However, the resumption of the upward trend would require a decisive breakthrough above the golden ratio resistance.
Read More: 11 Best Solana Meme Coins to Watch in 2024
Conversely, a bearish breach of the .382 Fib support at approximately $143 could see Solana retracing towards the golden ratio support at $125. Further downside momentum might target the 200-day EMA around $111.
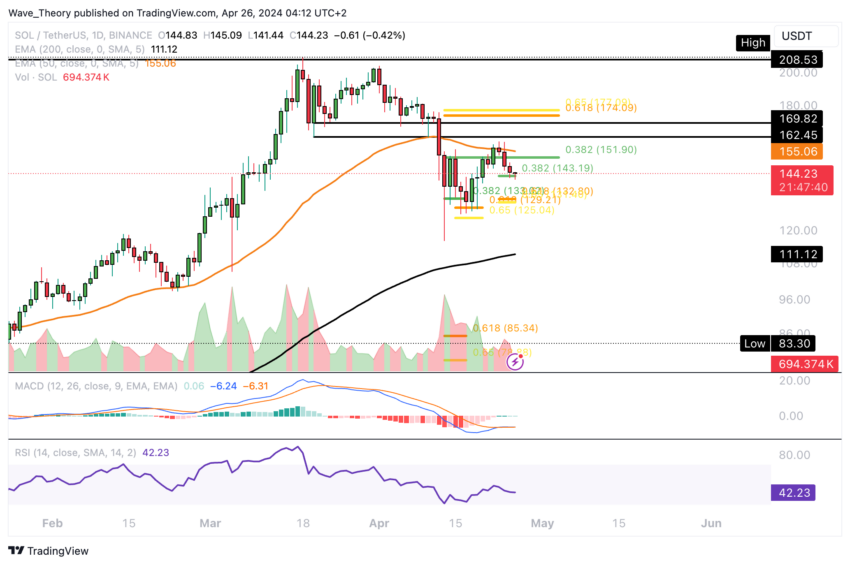
In the daily chart, the MACD histogram reflects a recent bearish trend, while the MACD lines hover close together, indicating the possibility of both bullish and bearish crossovers. Meanwhile, the RSI remains neutral, and the presence of a golden crossover on the EMAs suggests a persisting bullish outlook in the short to medium term.
Death Cross Forms on Solana’s 4H Chart
In the 4-hour chart for Solana, the formation of a death cross on the EMAs indicates a confirmed bearish trend in the short term. Additionally, the bearish crossover of the MACD lines, coupled with the neutral stance of the RSI, further supports this sentiment.
Despite these indications, the MACD histogram shows a bullish uptick, suggesting some potential for upward movement in the near term. Solana might find support once more around the .382 Fib level at approximately $143, with a possible target of the 50-4H EMA around $149.5.
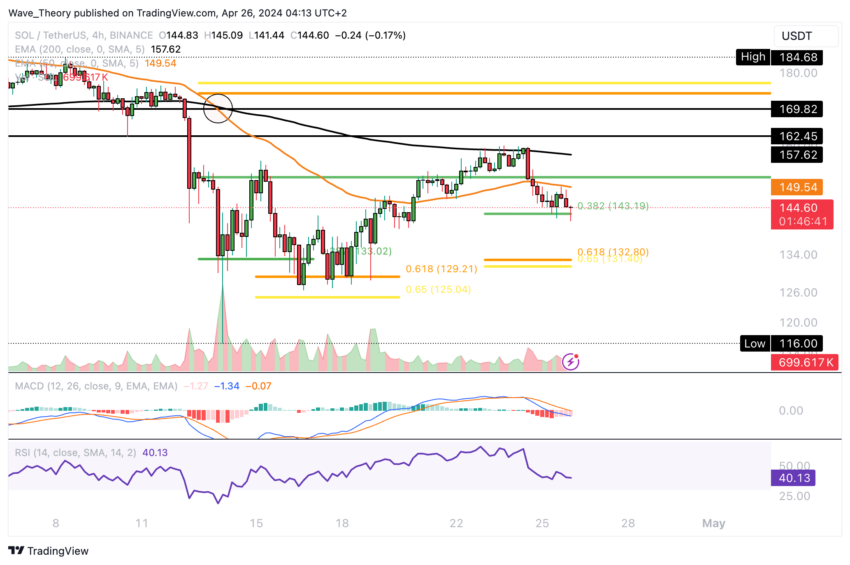
However, recent bearish rejection at this level highlights the challenges Solana faces in its current price action.
Why Solana Crashed 45%: Factors Behind the Steep Decline
In the past six weeks, Solana’s price has undergone a correction exceeding 45%. Should this corrective phase persist, significant support is anticipated for SOL between approximately $79 and $89.5. This range aligns with the intersection of the 50-week EMA and the critical golden ratio support.
Sustaining Solana’s price above the golden ratio threshold at around $85 is pivotal to uphold the bullish trajectory. Nevertheless, insights from the weekly chart paint a bearish picture. The MACD lines are presently undergoing a bearish crossover, while the MACD histogram indicates a downward trajectory.
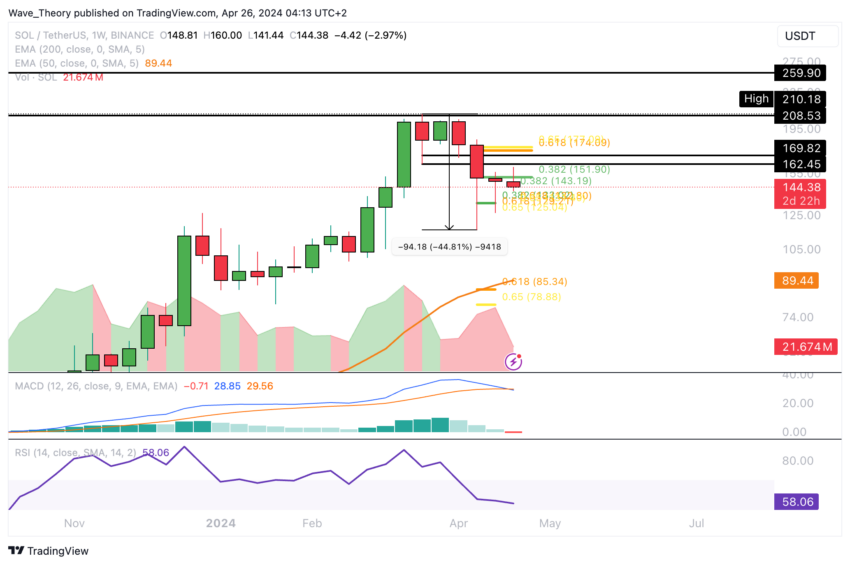
Concurrently, the RSI remains neutral, devoid of clear bullish or bearish signals.
Bearish Signs: MACD Histogram Ticks Lower on Monthly Chart
The current month has witnessed a price decline of approximately 43.3%. This downturn is reflected in the MACD histogram, which is now indicating a bearish trend.
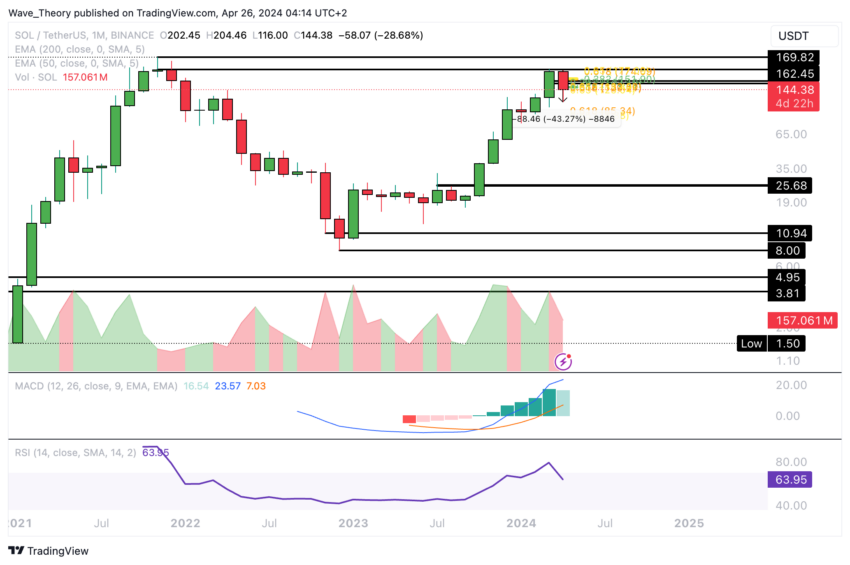
Nevertheless, in the monthly chart, the MACD lines persist in a bullish crossover, suggesting ongoing bullish sentiment. Furthermore, the RSI has reverted to neutral territory, signaling a potential stabilization in market sentiment.
Solana vs. Bitcoin: Anticipating a Bullish Rebound from Fib Support
Against Bitcoin, Solana currently finds itself supported within the range of 0.0021 BTC to 0.0023 BTC. This presents a potential opportunity for a bullish rebound.
However, it’s worth noting that in the weekly chart, the MACD lines have crossed bearishly, and the MACD histogram is displaying a downward trend, indicating a bearish sentiment. At the same time, the RSI remains in neutral territory, lacking clear bullish or bearish signals.
Read More: Solana (SOL) Price Prediction 2024/2025/2030
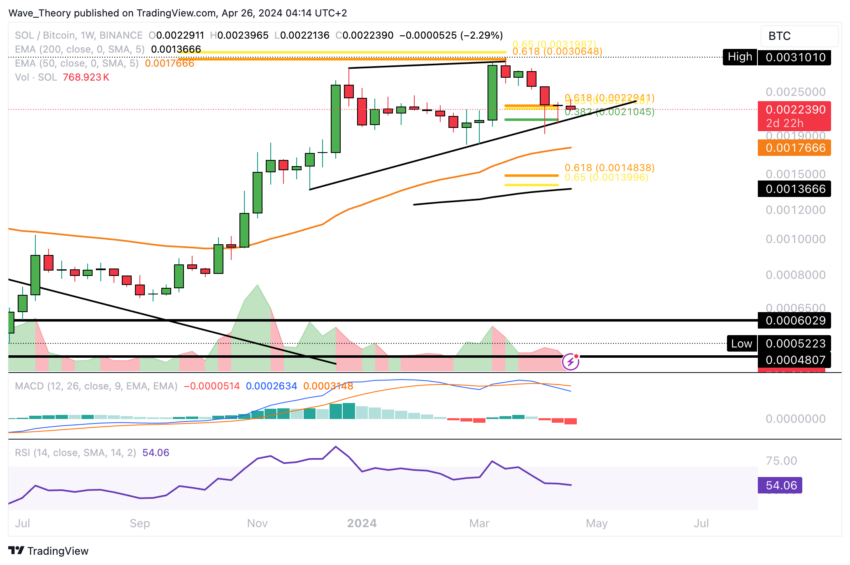
In the event of a bearish breakout, Solana may encounter significant Fib support around 0.00145 BTC. Prior to that, additional support can be expected near the 50-week EMA at approximately 0.001766 BTC.
Disclaimer
In line with the Trust Project guidelines, this price analysis article is for informational purposes only and should not be considered financial or investment advice. BeInCrypto is committed to accurate, unbiased reporting, but market conditions are subject to change without notice. Always conduct your own research and consult with a professional before making any financial decisions. Please note that our Terms and Conditions, Privacy Policy, and Disclaimers have been updated.

