


The Crypto Market Cap (TOTALCAP) and Bitcoin (BTC) broke out above key horizontal resistances. Fetch.ai (FET) reached a new all-time high.
In the news today:
- Vanguard CEO Tim Buckley announced his retirement by the end of 2024. He recently came under fire for blocking Bitcoin ETFs from the firm’s clients.
- American banks Merrill Lynch and Wells Fargo will offer spot Bitcoin ETFs to their clients.
TOTALCAP Moves Above Pivotal Resistance
The cryptocurrency market cap has increased considerably in the past three weeks, creating successive bullish weekly candlesticks. The increase accelerated further this week.
TOTALCAP increased above the 0.618 Fib retracement resistance level of $2.15 trillion, reaching a high of $2.30 trillion yesterday.
If the increase continues, the next resistance is at $2.40 trillion, 6% above the current level.
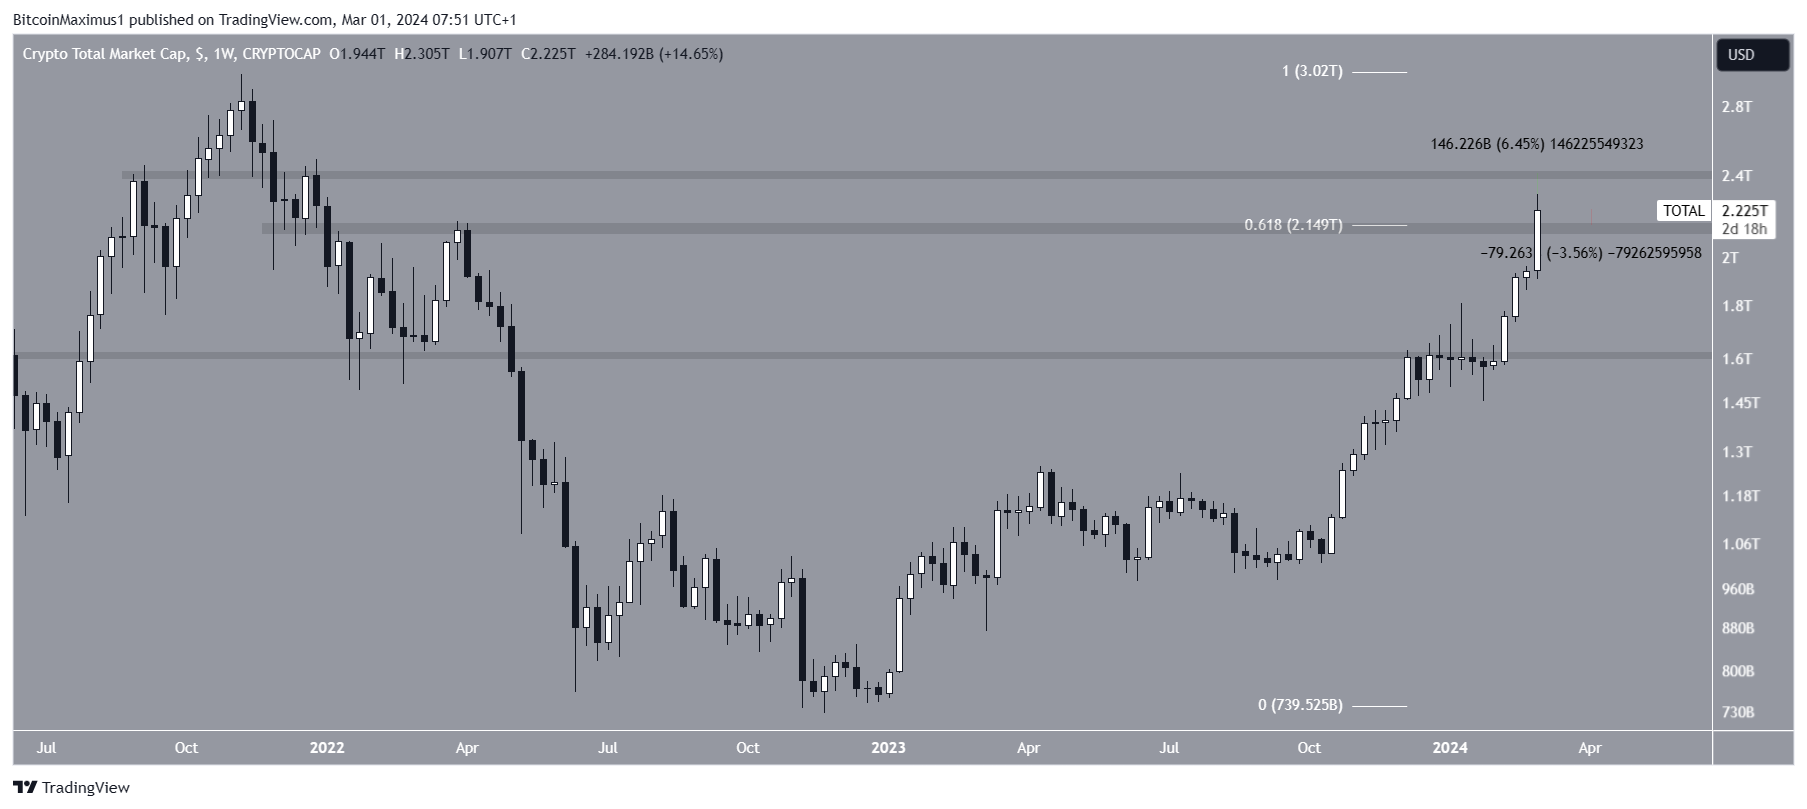
Despite the bullish TOTALCAP price prediction, a sudden rejection could trigger a 4% drop to the $2.15 trillion support area.
Read More: Where to Trade Bitcoin Futures
Bitcoin Surges Above $63,000
Similar to TOTALCAP, the Bitcoin price has increased since the start of January. The upward movement led to a high of $57,615 today, the highest since 2021. This also led to a close above the horizontal and Fib retracement resistance level of $48,600.
Bitcoin then broke out through the $60,000 horizontal resistance area, the final one before a new all-time high price. However, it has yet to reach a weekly close above it. If it does, the next resistance area is at the all-time high of $69,057, 12% above the current BTC price.
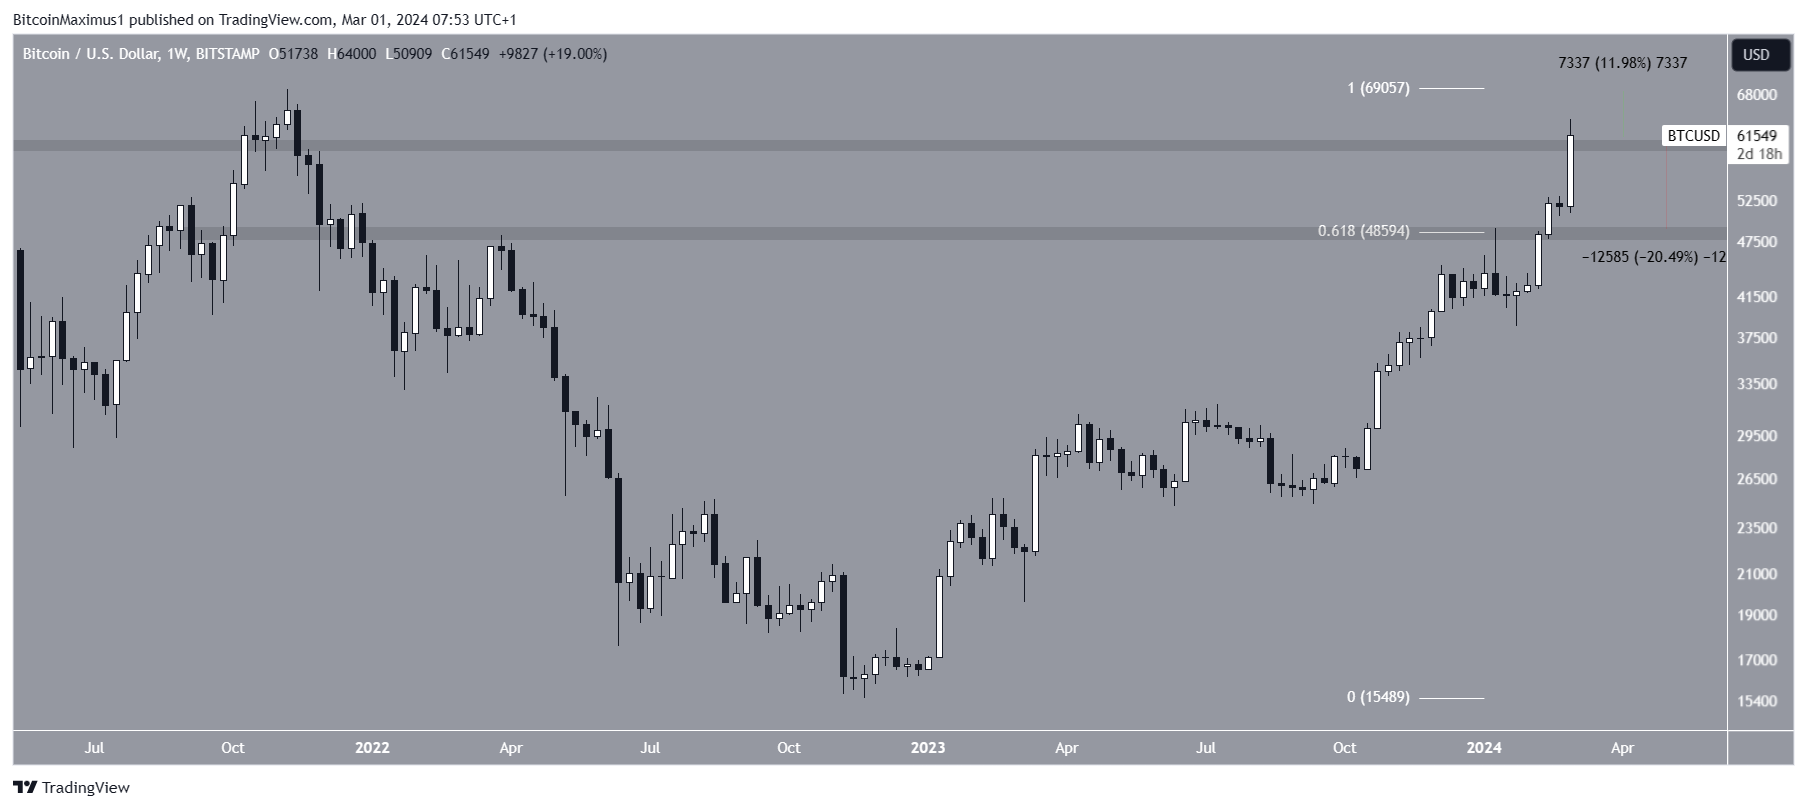
Despite the bullish BTC price prediction, a weekly close below $60,000 can trigger a 20% drop to the closest support at $48,000.
Read More: 13 Best Altcoins to Invest in January 2024
FET Reaches New All-Time High
The FET price has increased parabolically during the past four weeks. The upward movement caused a breakout from the $0.85 horizontal resistance area, leading to a new all-time high price of $1.67 today. The movement has been parabolic, devoid of any retracement.
FET is moving towards the 1.61 external Fib retracement of the previous decrease at $1.91, 22% above the current price.
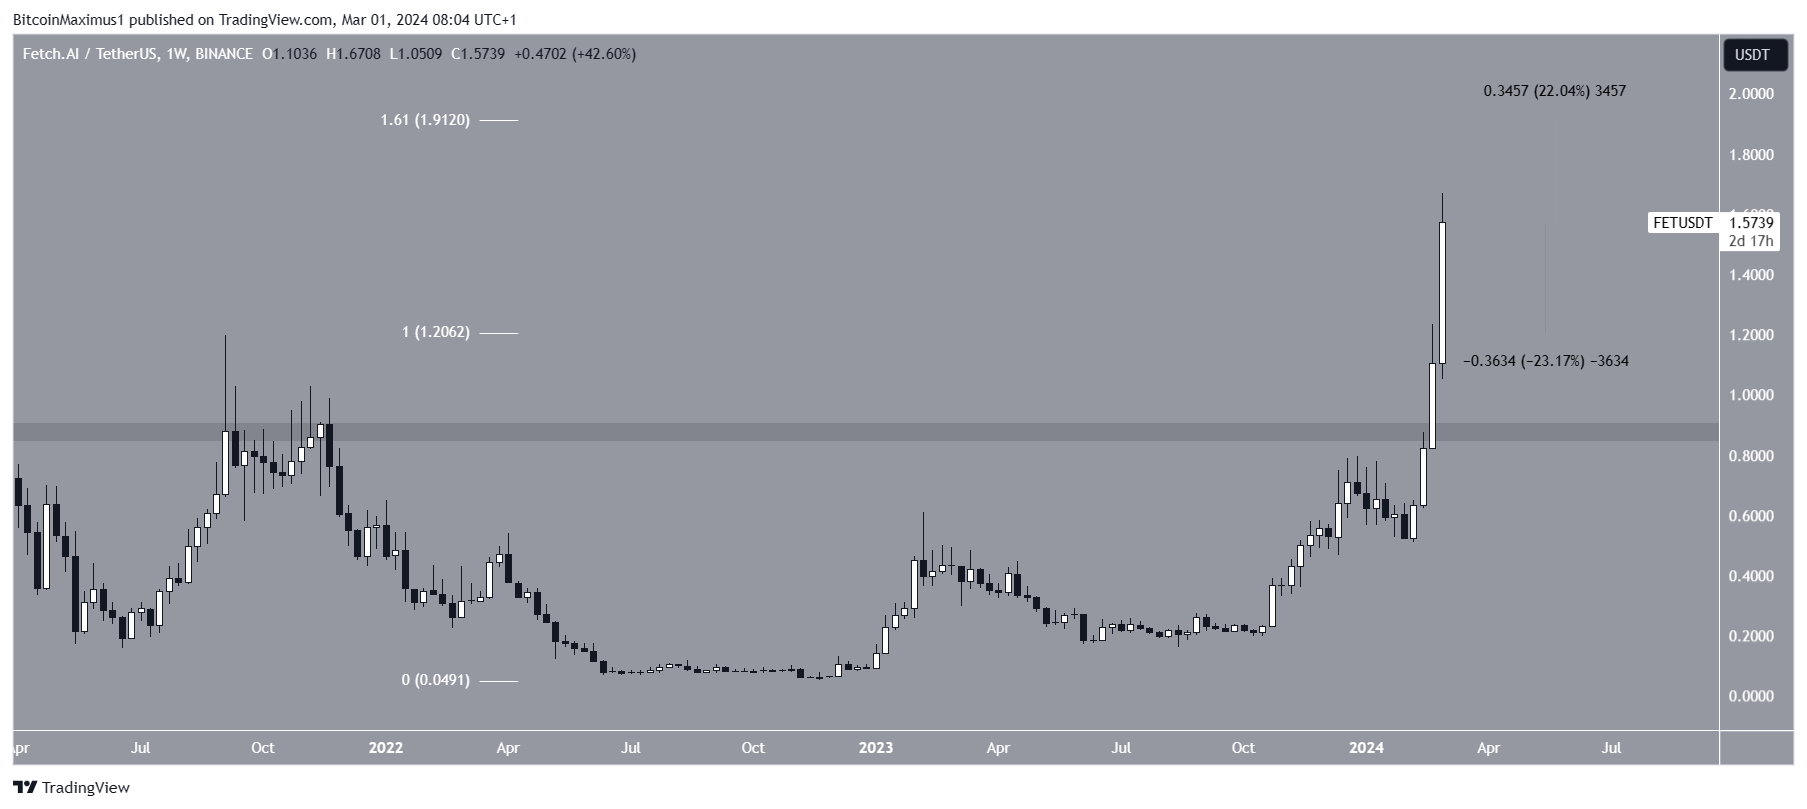
Despite this bullish FET price prediction, failure to sustain the increase can trigger a 23% drop to the previous all-time high of $1.20.
Read More: What are Meme Coins?
For BeInCrypto‘s latest crypto market analysis, click here.


