


The Bitcoin (BTC) price has decreased since reaching a high of $28,592 on October 2.
The decrease confirmed a deviation above the $28,000 horizontal area, which is now confirmed as resistance.
Bitcoin Falls After Range High Rejection
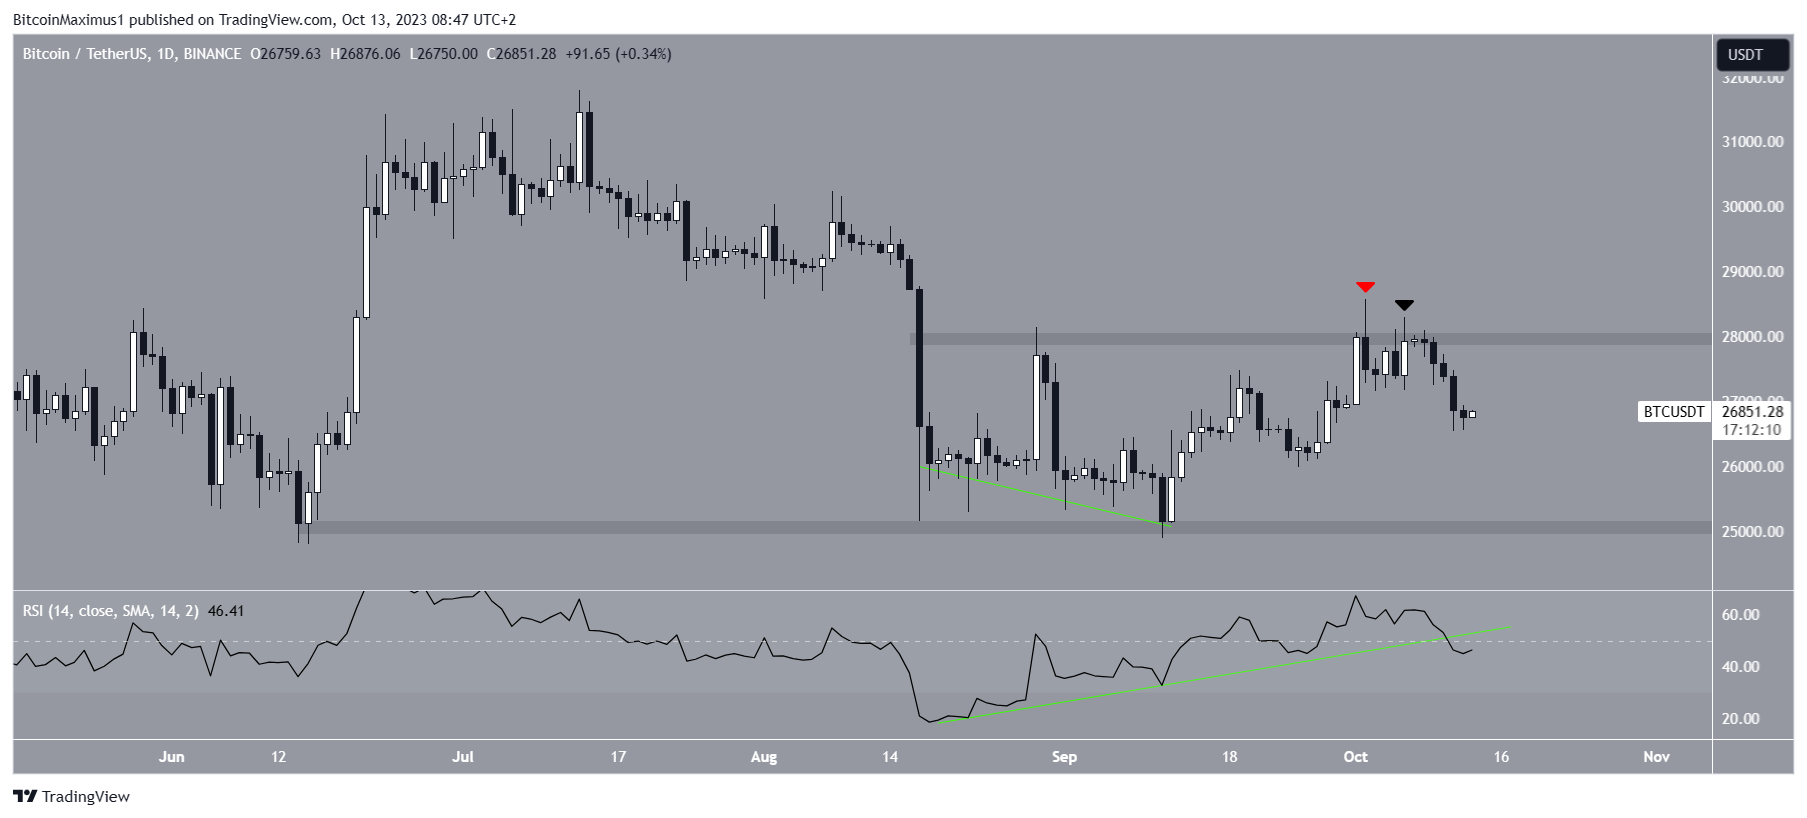
The daily timeframe technical analysis shows that the Bitcoin price has fallen since reaching a high of $28,580 on October 2 (red icon). At the time, it seemed that BTC had broken out from the $28,000 horizontal resistance area.
However, the price could not sustain its increase. It fell below the area shortly afterward, validating it as resistance (black icon) on October 6.
Bitcoin has fallen at an accelerated rate since, reaching a low of $26,538 on October 11.
Check out the Best Crypto Sign-Up Bonuses in 2023
The daily Relative Strength Index (RSI) gives a bearish reading. Market traders use the RSI as a momentum indicator to identify overbought or oversold conditions and to decide whether to accumulate or sell an asset.
Readings above 50 and an upward trend indicate that bulls still have an advantage, whereas readings below 50 suggest the opposite.
The indicator is below 50 and falling, both signs of a bearish trend. Also, it has broken down from its bullish divergence trendline (green line), which preceded the entire upward movement.
There is some very interesting Bitcoin news today.
Today marks the final deadline for the Securities and Exchange Commission (SEC) to challenge a court’s decision, which deemed insufficient grounds to block a Spot Bitcoin Exchange-Traded Fund (ETF).
If the SEC neglects to contest this ruling by day’s end, they will exhaust their options to reject any other Spot Bitcoin ETFs.
Consequently, they would be obligated to grant approval to all such ETFs. If the SEC does not take action today, it is increasingly probable that we will see the green light given to all spot, and not just Bitcoin ETFs.
In other news, 24,000 Bitcoin options contracts that are worth $640 million are set to expire today. This amount is 50% larger than that of last week.
Finally, the US Consumer Price Index (CPI) for September came at 3.7%, only slightly higher than the forecast of 3.6%.
When combined with the slightly higher-than-expected Producer Price Index, this could cause a slight interest rate hike next meeting. While the US dollar index responded positively to the CPI, Bitcoin decreased slightly.
BTC Price Prediction: When Will Price Bottom?
Technical analysts employ the Elliott Wave theory as a means to identify recurring long-term price patterns and investor psychology, which helps them determine the direction of a trend. The most likely Elliott Wave count is bearish.
Starting from the November 2022 bottom of $15,479, the BTC price has completed a five-wave upward movement. If so, it is now correcting that increase.
If the decrease continues, the most likely level for the bottom of wave C will be at $21,800. The area coincides with the 0.618 Fib retracement support level (white) and would give waves A:C a 1:1 ratio (black).
An analysis of BTC halving cycles also supports this possibility. A drop to $21,800 will be a nearly 20% decrease from the current price.
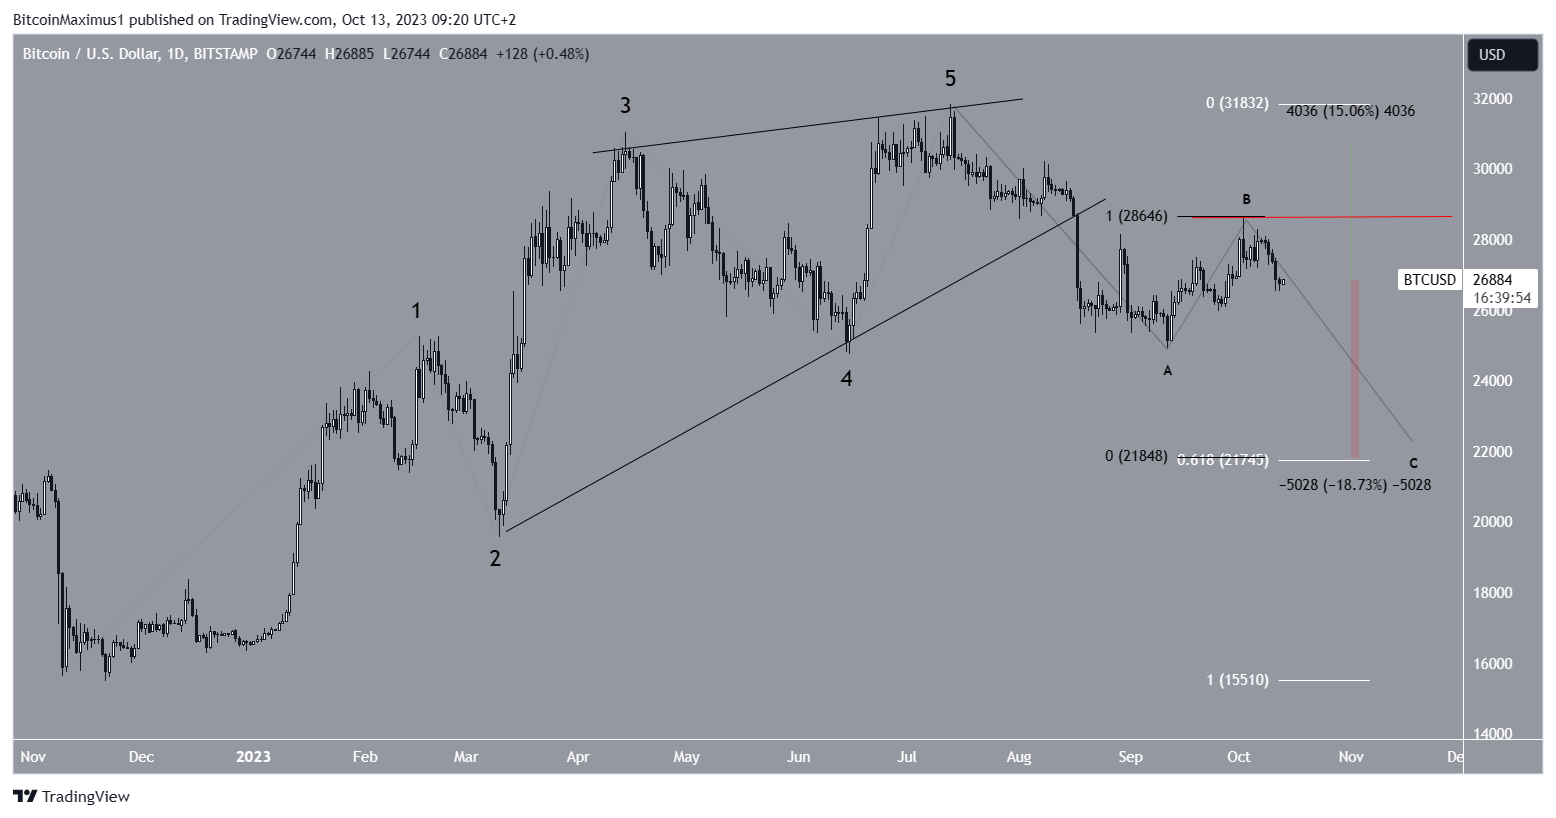
Despite this bearish Bitcoin price prediction, an increase above the B wave high of $28,592 can lead to a 15% upward movement towards the $30,500 resistance area.


