


These altcoins have bullish-looking formations and could reach new all-time highs in March.
February was extremely bullish for the cryptocurrency market. New highs were seen across the board in Bitcoin (BTC) and several altcoins. BeInCrypto looks at the top altcoins for March that could hit new all-time highs.
Ocean Protocol (OCEAN) Begins Ascent Towards All-Time High
OCEAN’s price has increased since the start of 2023. Initially, it struggled to break out from a descending resistance trend line that existed since the all-time high. However, after five unsuccessful attempts, OCEAN finally broke out in October and has accelerated since.
This week, OCEAN reached a new yearly high of $0.88, with the wave count supporting the upward movement and breakout. Indeed, Elliott Wave theory identifies recurring long-term price patterns and investor psychology, which helps them determine the direction of a trend.
The most likely count suggests OCEAN is in wave three of a five-wave upward movement. If the count is correct, the OCEAN price can increase to the next resistances at either $1.36 or $2.03. The first would give waves one and three a 1:1 ratio, while the second would give them a 1:1.61 ratio.
These would amount to upward movements of 50% and 120%, respectively, with the second constituting a new all-time high price.
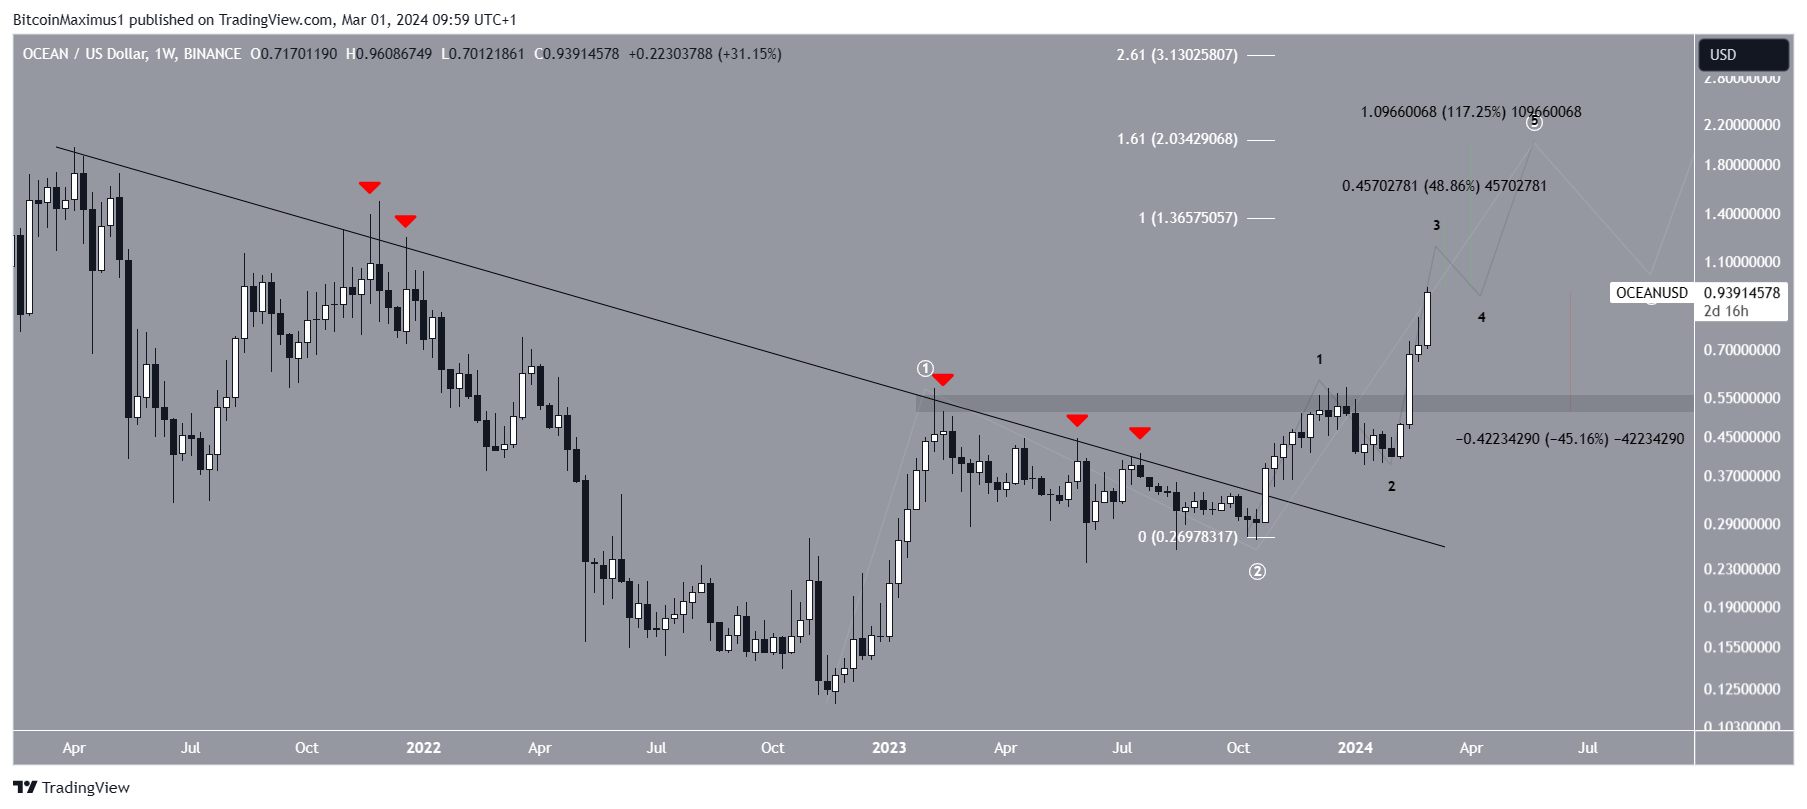
Despite the bullish OCEAN price prediction, a swift rejection at the current level can trigger a 45% drop to the closest support at $0.55.
Aptos (APT) Breaks Out From Long-Term Resistance
The APT price has increased since breaking out from a long-term descending resistance trend line in November 2023. The increase has been parabolic, leading to a high of $13.60 this week. APT reached the $12.60 confluence of resistance levels, created by a horizontal resistance area and the 0.5 Fib retracement resistance level, the final resistance before the all-time high of $20.55.
The weekly Relative Strength Index (RSI) supports the breakout. Indeed, it is increasing and has nearly moved above 70 (green icon), a sign of a bullish trend.
It is worth noting that the RSI is a momentum indicator that helps evaluate whether a market is overbought or oversold and whether to accumulate or sell an asset. Readings above 50 and an upward trend suggest that bulls still have an advantage, while readings below 50 indicate the opposite.
Therefore, if the APT price breaks out above $12.60, it can increase by another 70% and reach an all-time high of $2.55.
Read more: An Ultimate Guide to Aptos (APT)
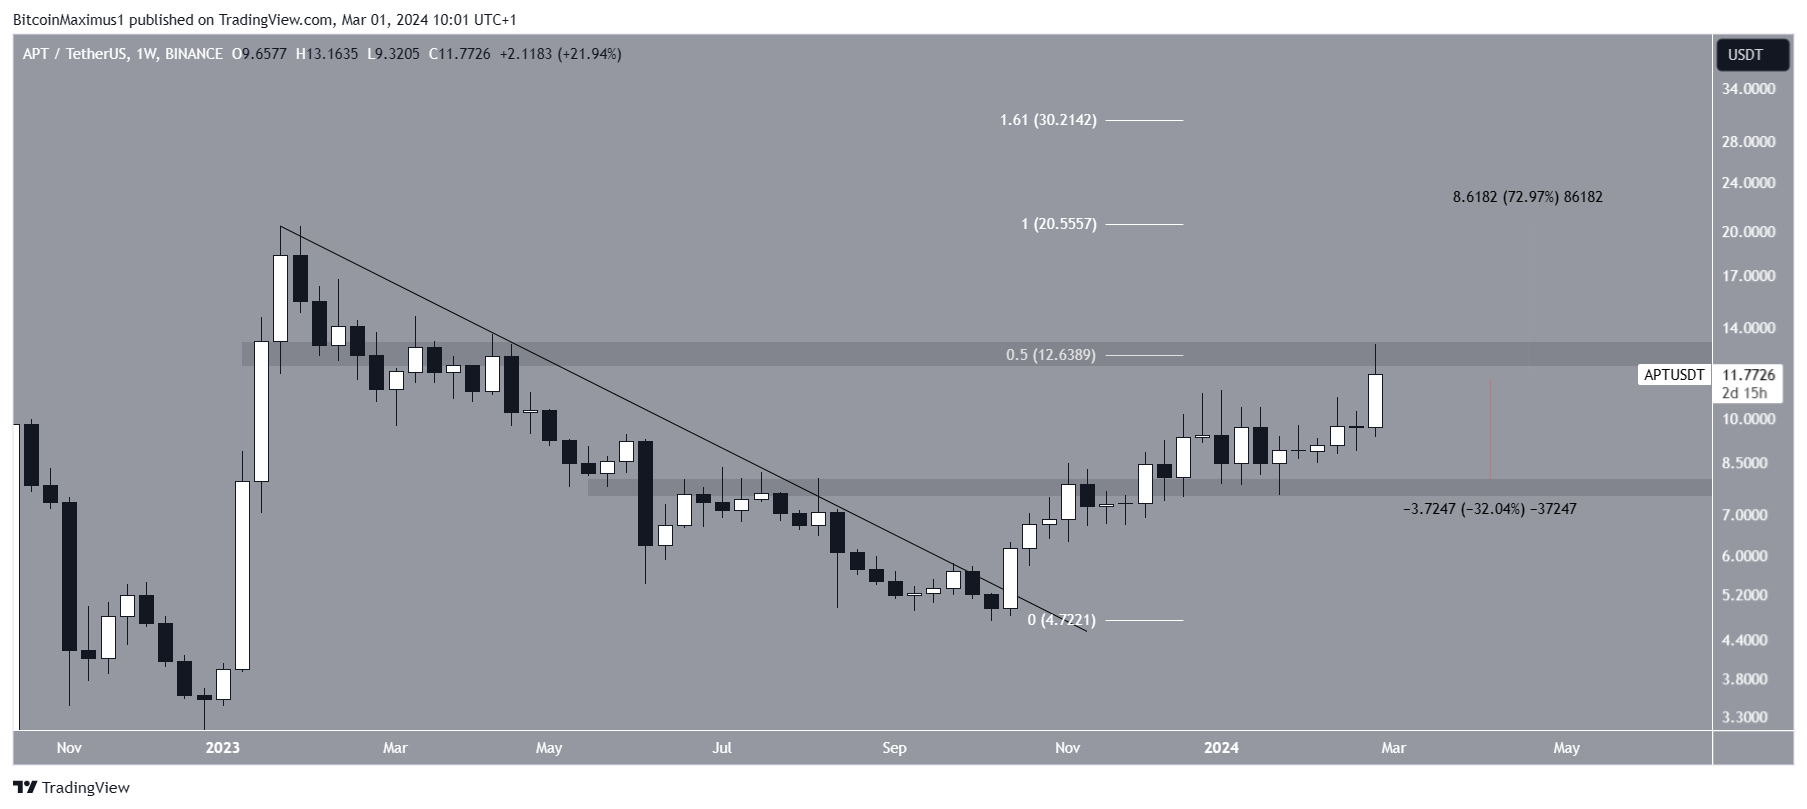
Despite the bullish APT price prediction, a rejection from the $12.60 area can trigger a 35% drop to the closest support at $7.90.
iExec RLC (RLC) Concludes All-Time High Altcoins
The final altcoin that is expected to move towards an all-time high is RLC. RLC broke out from a key horizontal resistance area at $2.30 in the last three weeks and moved above an ascending parallel channel. The channel has existed since June 2022, and the breakout above it suggests the upward movement is impulsive.
The upward movement was also supported by an RSI increase above 70 (green icon), legitimizing the breakout. Now, the RLC price approaches the $5.30 resistance area, which is the final one before an all-time high. If the altcoin breaks out, it can increase by another 140%, near the all-time high of $10.
Read more: Top 11 Platforms to Trade the Cheapest Cryptocurrencies
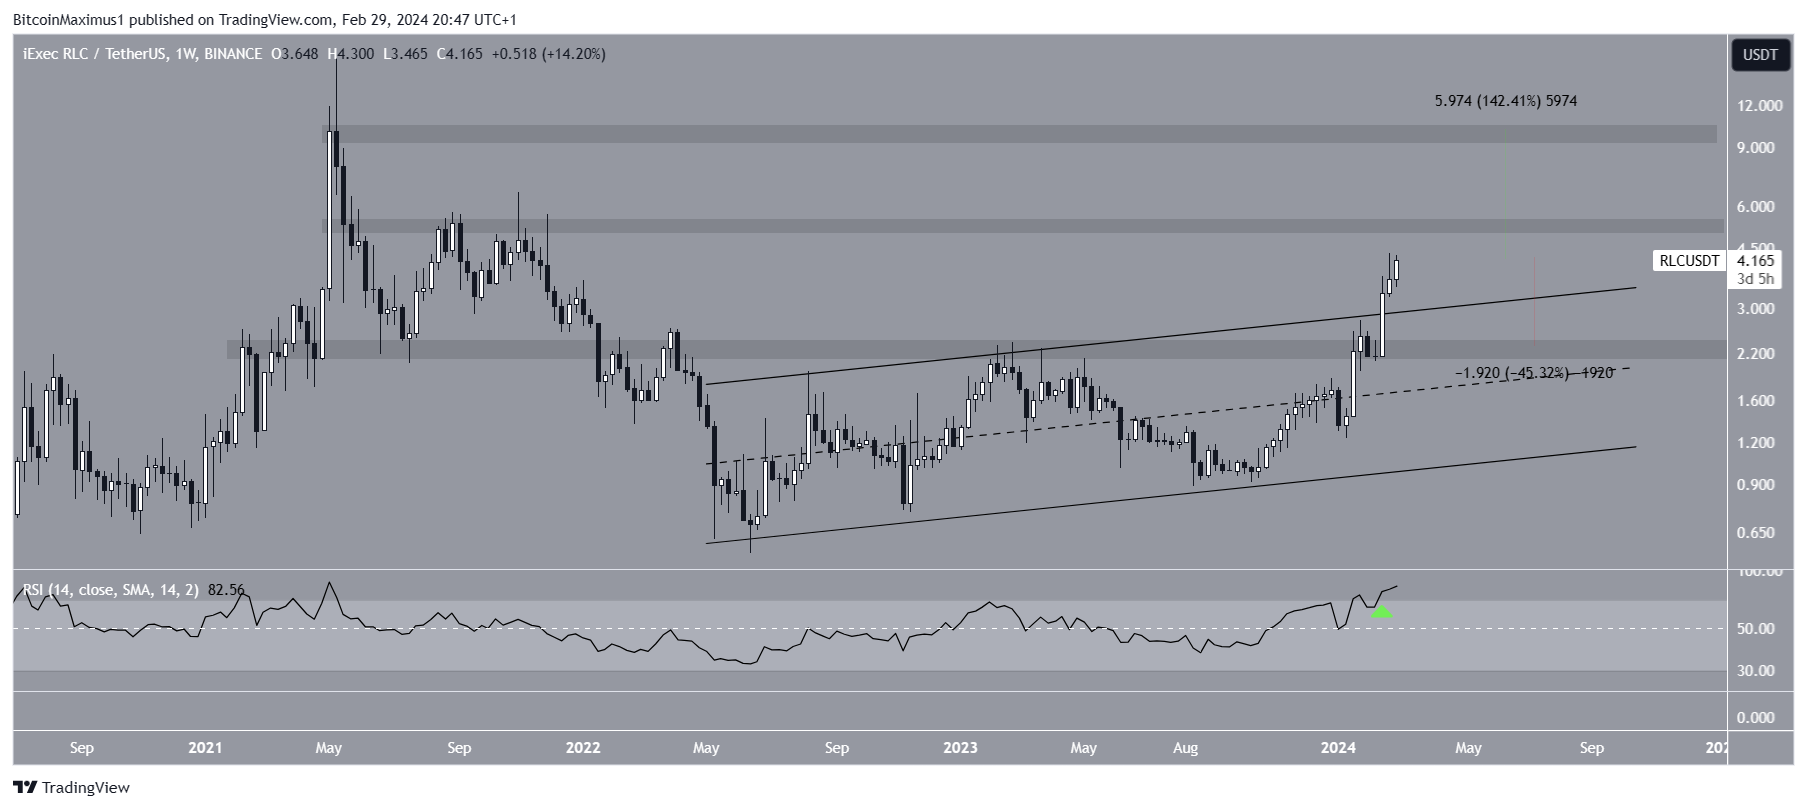
Despite this bullish RLC price prediction, a rejection from the $5.30 area can trigger a 45% drop to the closest support at $2.30.


