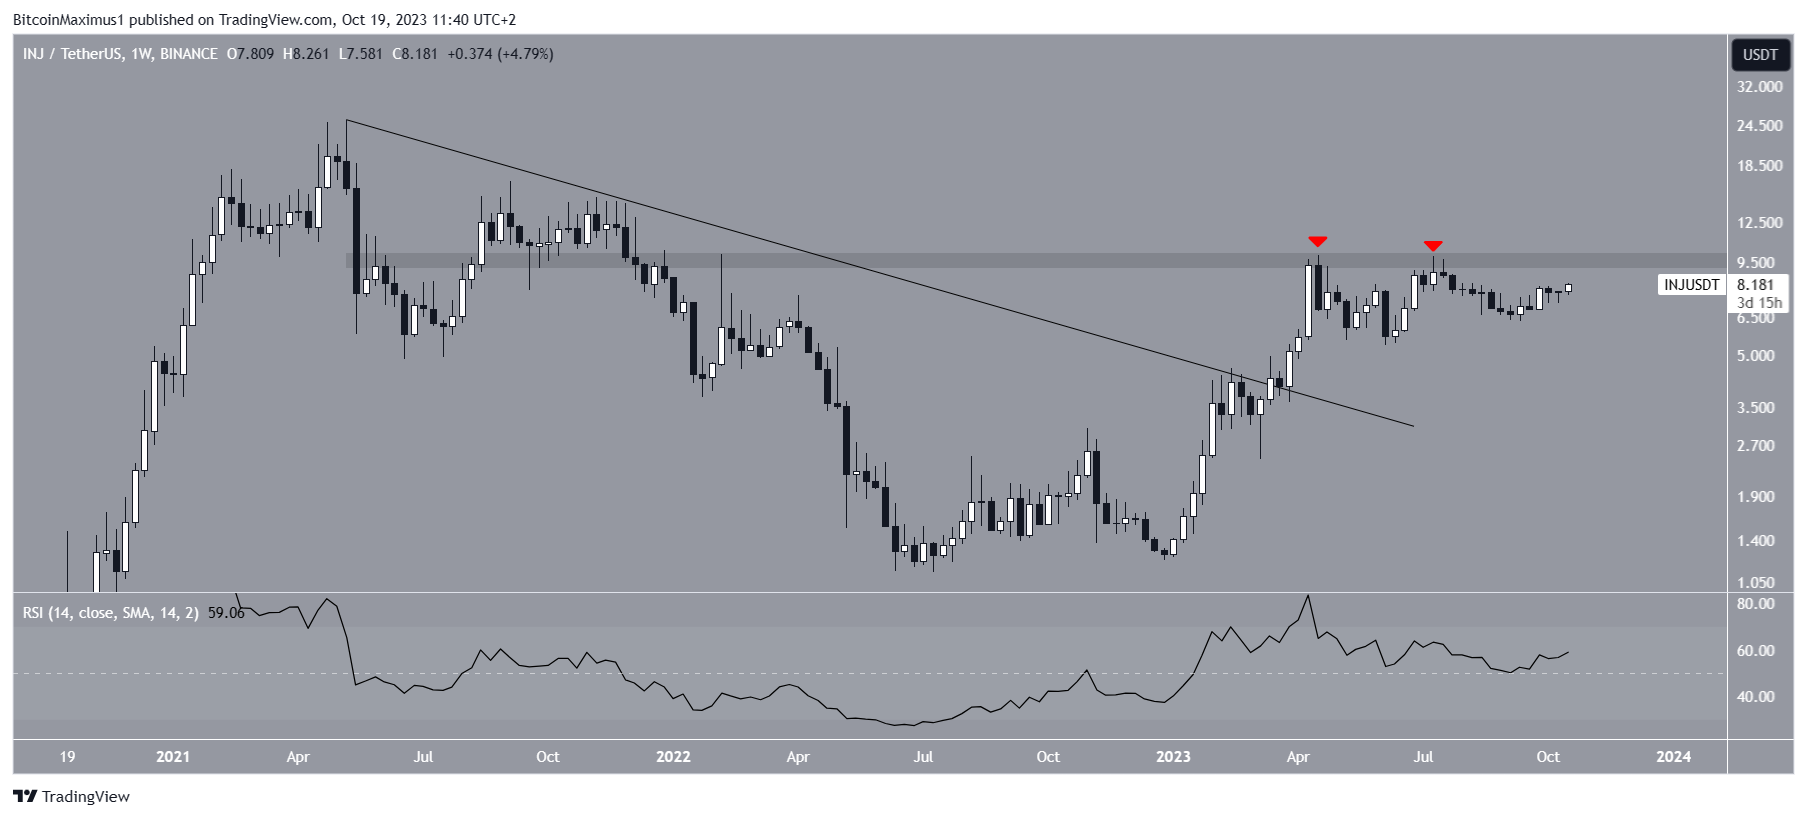
The Injective (INJ) price has traded slightly below the $10 horizontal resistance area since it reached its yearly high in April.
INJ regained its footing in September and is moving towards the resistance area again. Will it break out?
Injective Approaches $10 Resistance Area
The INJ price has increased rapidly since the beginning of the year when it was trading at a low of $1.22. The increase caused a breakout from a long-term descending resistance trendline in March.
This led to a new yearly high of $9.97 in April.
The INJ price has fallen since, twice validating the $10 horizontal area as resistance and creating lower highs (red icons).
When evaluating market conditions, traders use the RSI as a momentum indicator to determine if a market is overbought or oversold and to decide whether to accumulate or sell an asset.
But, the trend has seemingly shifted bullish since September, and the altcoin is approaching the $10 resistance area again.
If the RSI reading is above 50 and the trend is upward, bulls still have an advantage, but if the reading is below 50, the opposite is true.
The RSI is increasing and is above 50, both signs of a bullish trend. Also, the indicator has generated hidden bullish divergence (green), a sign of trend continuation.

The Injective protocol has announced a series of highly positive developments recently.
Firstly, the protocol introduced compatibility with Ethereum applications through the inEVM feature, facilitating their operation on the Injective network. Additionally, they unveiled .inj domains for the first time, and an impressive 100,000 individuals eagerly registered for the whitelist.
In a significant October announcement, Injective revealed the initiation of the Illuminate Hackathon, backed by Google Cloud.
This event boasts a substantial $100,000 prize pool dedicated to fostering innovative web3 finance applications. The hackathon is set to run throughout the entire month of October.
Lastly, Injective’s decentralized exchange, Helix, made a noteworthy declaration of its own by pledging support for pre-launch futures.
This move aims to ensure that traders have an equitable opportunity to access popular token markets before their official launch. Previously, these markets were only available to early contributors or VCs.
INJ Price Prediction: Can All-Time High Be Reached?
Technical analysts employ the Elliott Wave theory as a means to identify recurring long-term price patterns and investor psychology, which helps them determine the direction of a trend.
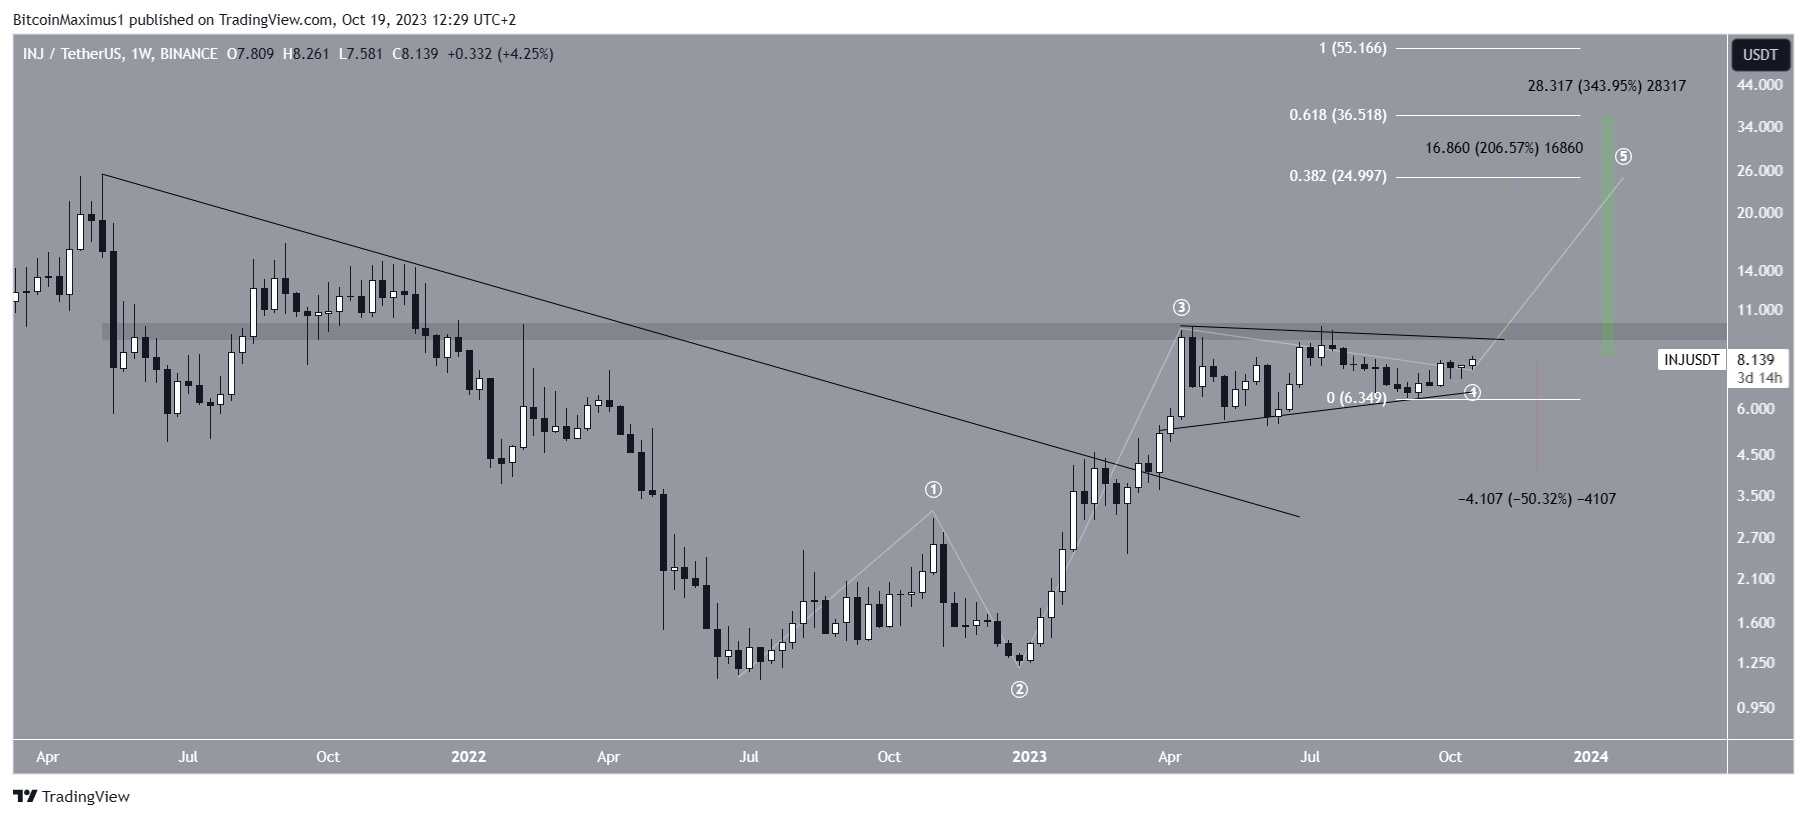
The most likely wave count suggests that the trend is bullish. If the count is correct, INJ is nearing the end of wave four in a five-wave upward movement.
The count is characterized by a symmetrical triangle in wave four, which is the most common pattern in this wave.
Read More: 9 Best Crypto Demo Accounts For Trading
The most likely target for the top of the fifth wave is at $25, found by the 0.382 Fib length of waves one and three combined. The target is 200% above the current price.
The target is very close to the INJ price all-time high of $25.30.
If the movement extends, the next most likely target will be at $36.50, found by the 0.618 Fib length of waves one and three combined.

Despite this bullish INJ price prediction, a weekly close below the triangle’s support line will invalidate the count.
In that case, a 50% drop to the $4 horizontal support area will be likely.
For BeInCrypto’s latest crypto market analysis, click here.
Disclaimer
In line with the Trust Project guidelines, this price analysis article is for informational purposes only and should not be considered financial or investment advice. BeInCrypto is committed to accurate, unbiased reporting, but market conditions are subject to change without notice. Always conduct your own research and consult with a professional before making any financial decisions. Please note that our Terms and Conditions, Privacy Policy, and Disclaimers have been updated.


