


The biggest October crypto predictions deal with Bitcoin Cash (BCH), Ethereum (ETH) and EOS.
October has been a roller-coaster ride so far. A significant increase on October 1 was followed by a sharp drop the next day. With that in mind, BeInCrypto looks at the crypto predictions for the month of October.
Bitcoin Cash Will Reach a New Yearly High
The BCH price has been falling since reaching its yearly high of $329 on June 30. The decrease was contained inside a descending parallel channel, which is considered a corrective pattern.
Read More: Best Upcoming Airdrops in 2023
The movement inside the channel led to a low of $165 on August 17. The ensuing bounce validated the channel’s support line and initiated an upward movement, which is still ongoing. BCH broke out from the channel on August 29.
The main reason for the bullish prediction comes from the wave count. Elliott Wave theory involves the analysis of recurring long-term price patterns and investor psychology to determine the direction of a trend.
The most likely wave count suggests that the BCH price is in the fifth and final wave of an upward movement (white), which began in November 2022.
If the count is correct, BCH will reach a new yearly high near $425. The target is found by wave four’s 1.61 external Fib retracement (black). It is 75% above the current price.
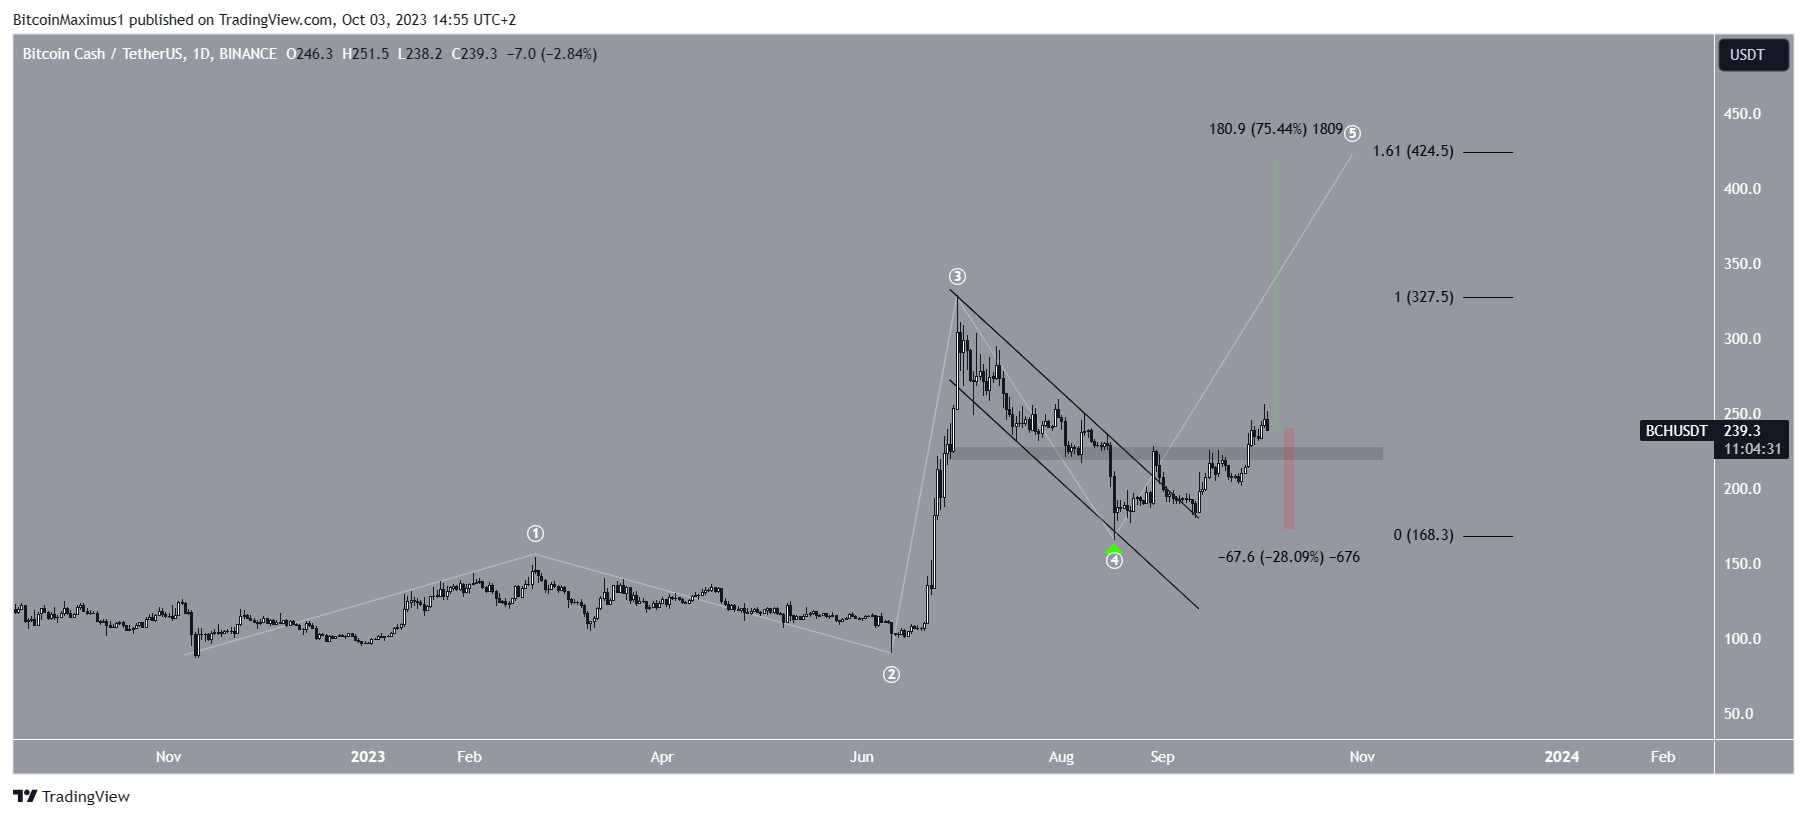
Despite this bullish BCH price prediction, a close below the minor horizontal support area at $225 will mean that the count is invalid and the price is still being corrected.
In that case, a 28% decrease to the August 17 lows at $168 will likely be the future price outlook.
EOS Will Fall to a New All-Time Low
The EOS price has fallen under a descending resistance trendline since May 2021.
More recently, the line caused a rejection on April 10 (red icon). This led to a low of $0.50 in August.
The low was important since it coincided with the all-time low support level, which had not been reached since 2017. The accurate all-time low is at $0.48, nearly 20% below the current price.
A breakdown from the $0.50 region could cause EOS to decrease to $0.13, 80% below the current price.
Since there is no horizontal support below $0.50, the 1.61 external Fib retracement of the most recent bounce determines areas for a potential bottom.
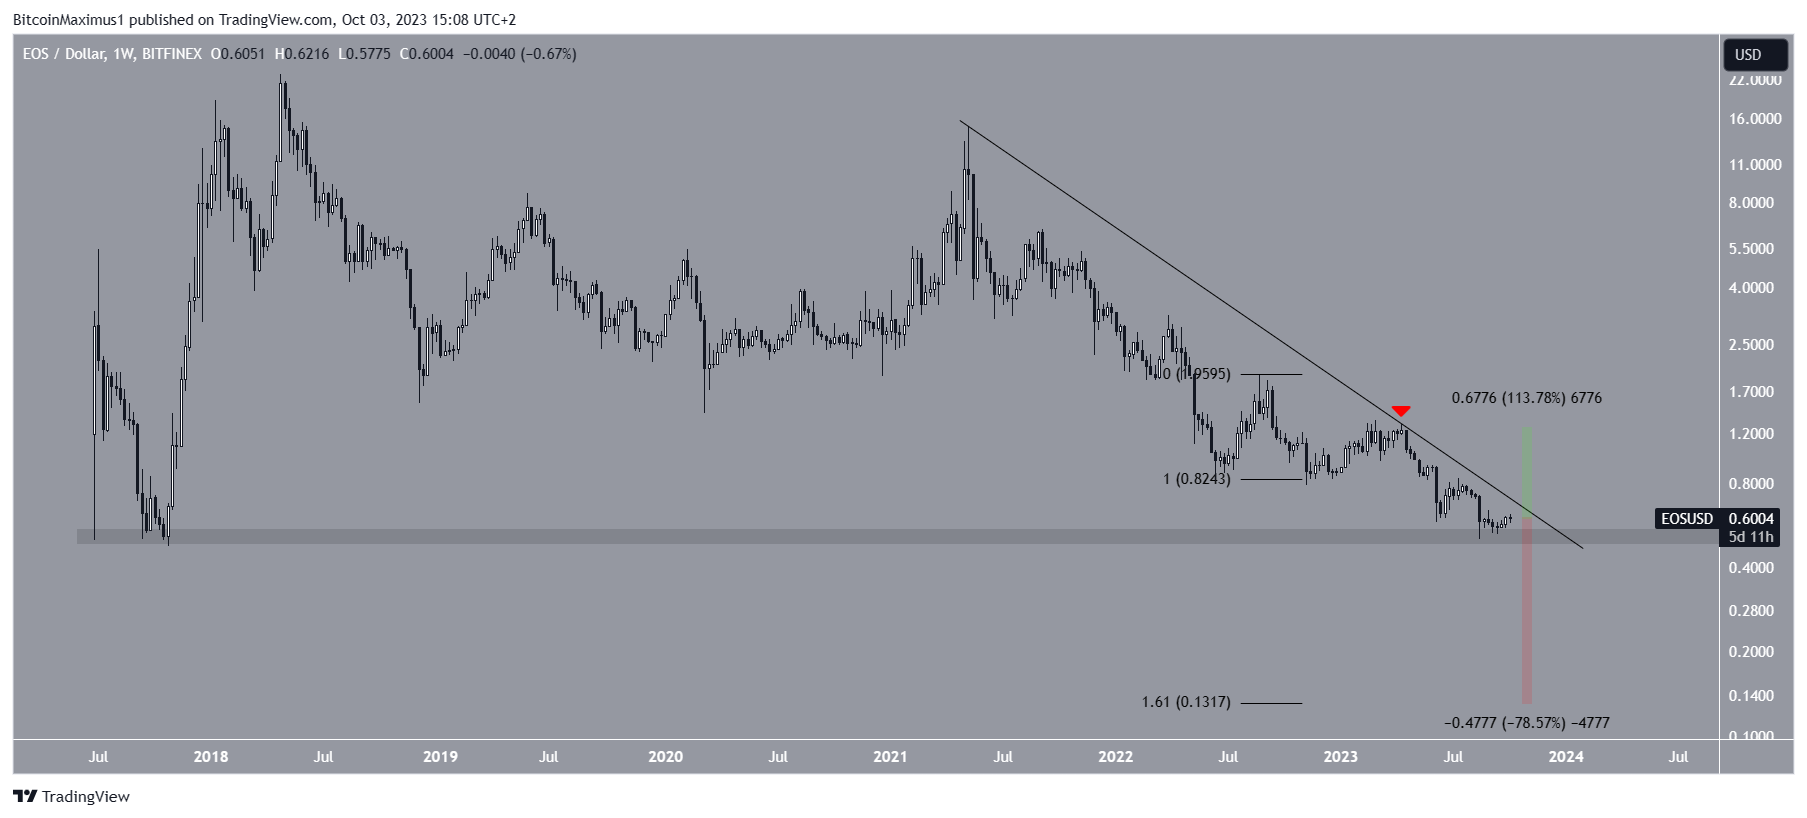
Despite this bearish EOS price prediction, a breakout from the descending resistance trendline will invalidate the bearish forecast.
In that case, a 120% increase to the next closest resistance at $1.25 will likely be the future price scenario.
Ethereum Concludes October Crypto Predictions
Ethereum has fallen in a descending wedge against Bitcoin (BTC) for over a year. More specifically, the wedge has been in place since July 2022. The ETH price currently trades very close to the wedge’s support line.
The point of convergence between the resistance and support trendlines is approaching, so a decisive movement outside of it is likely to occur soon.
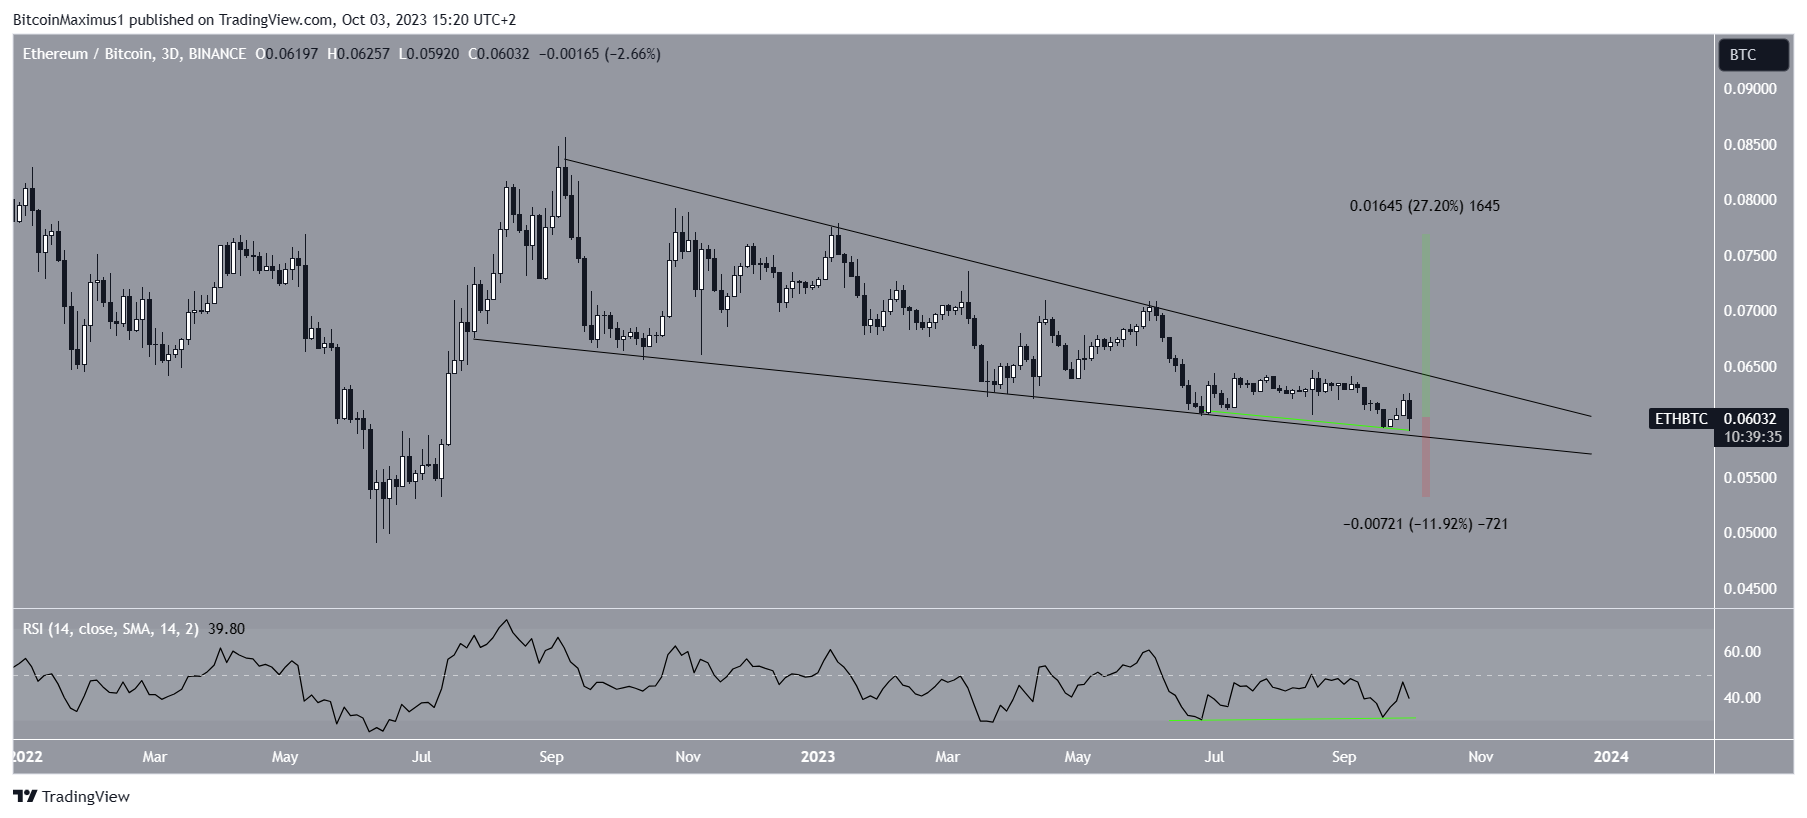
Besides the wedge being considered a bullish pattern, the daily Relative Strength Index (RSI) supports the possibility of a breakout.
The RSI is a popular metric among traders for gauging momentum and informing their buy or sell decisions on assets.
Readings above 50 and an upward trend suggest that bulls still have an advantage, while readings below 50 indicate the opposite.
The indicator has generated bullish divergence (green line), an occurrence when a price decrease is combined with a momentum increase. This divergence often leads to bullish trend reversals.
If ETH breaks out from the wedge, it can increase by 25% to the ₿0.075 resistance region. On the other hand, a breakdown from the wedge’s support line will invalidate this bullish prediction, likely causing a 12% drop to the ₿0.052 support.
Read More: Top 11 Crypto Communities To Join in 2023
For BeInCrypto’s latest crypto market analysis, click here.


