The Ripple XRP price has been moving downwards since July 13 and created a lower high on November 13.
The decrease is taking XRP close to a pivotal horizontal support area. Whether the price bounces or gets rejected can determine the direction of the trend.
Ripple Falls After Range High Rejection
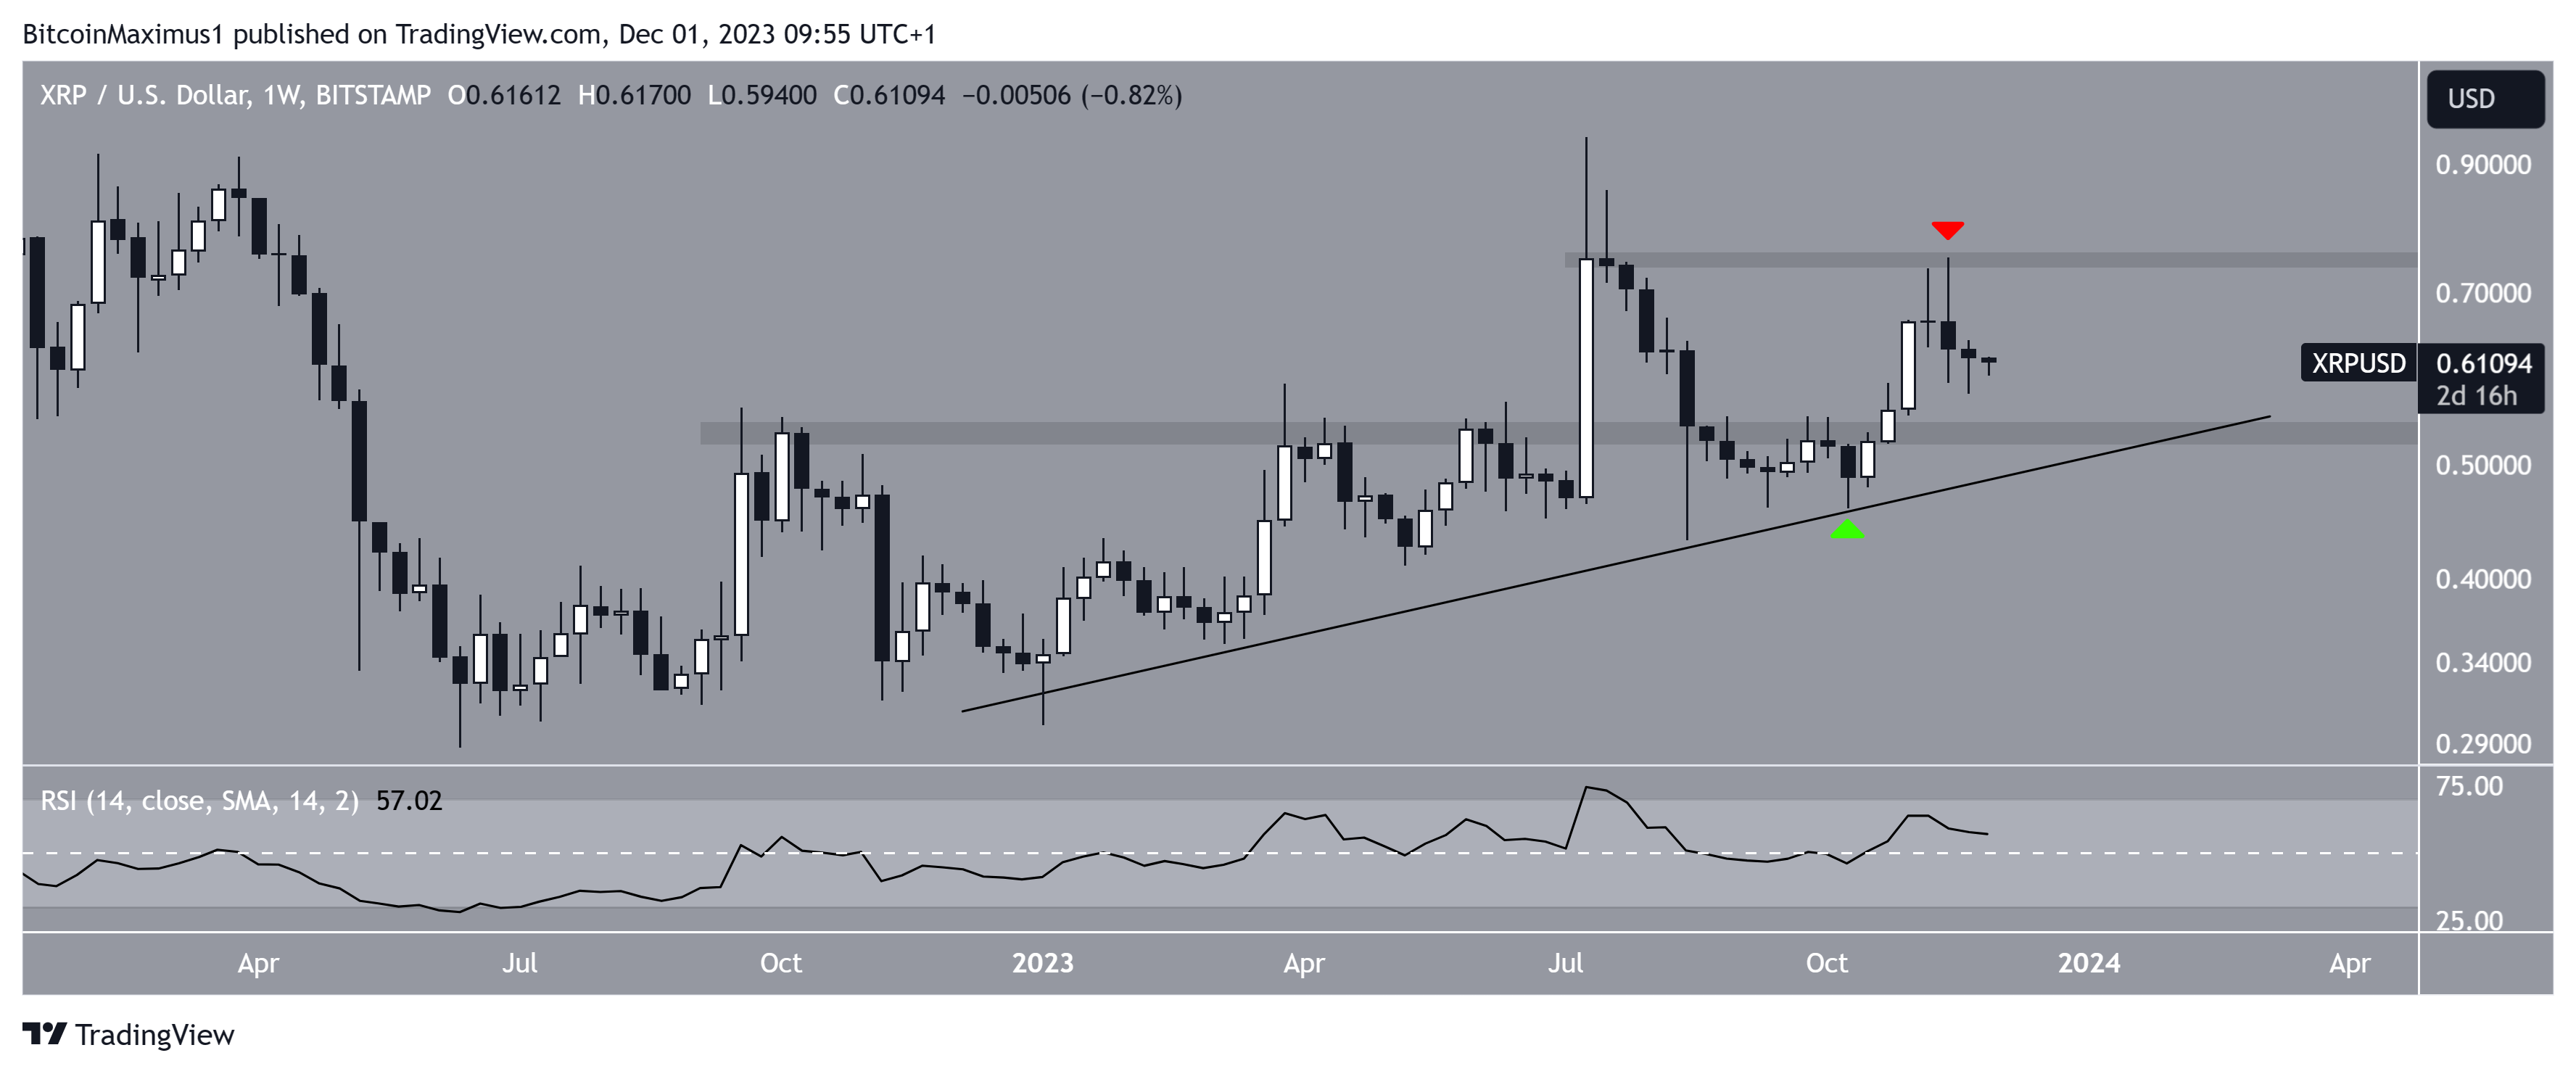
The technical analysis of the weekly timeframe shows that the XRP price has increased above an ascending support trend line since the start of the year.
More recently, the price bounced at the trend line in October (green icon), beginning a significant upward movement. Despite the increase, XRP did not break out from its range high.
Instead, it created a long upper wick and fell (red icon). Such wicks are considered signs of selling pressure.
Currently, XRP trades in the middle of a horizontal range.

When evaluating market conditions, traders use the Relative Strength Index (RSI) as a momentum indicator to determine whether a market is overbought or oversold and whether to accumulate or sell an asset.
If the RSI reading is above 50 and the trend is upward, bulls still have an advantage, but if the reading is below 50, the opposite is true.
The RSI gives a mixed reading since the indicator is falling but is above 50.
Read more: Best Crypto Sign-Up Bonuses in 2023
What Do Analysts Say About the Increase?
Cryptocurrency traders and analysts on X believe the long-term XRP price trend is bullish.
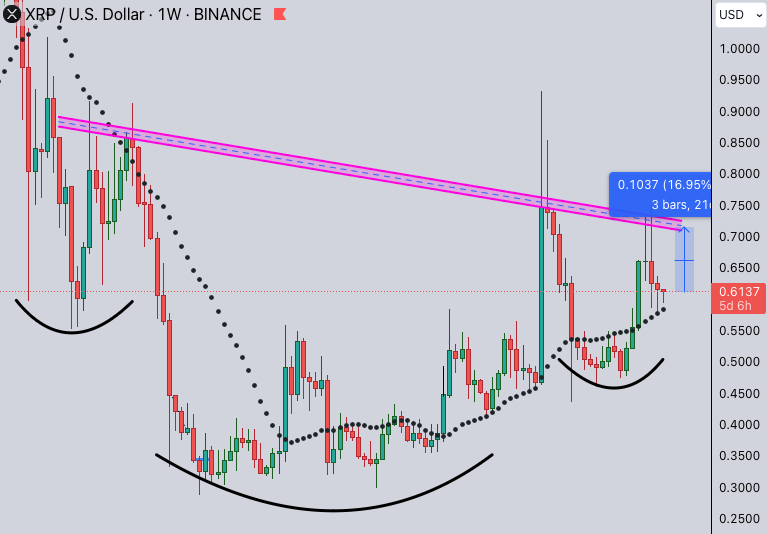
CryptoToesTA posted a bullish inverse head and shoulders pattern, suggesting that the breakout from its neckline can catalyze a significant price increase.

EgragCrypto has an extremely bullish view of the future trend. He posted two scenarios for the price movement until the end of 2024:
“But wait, the historical records offer two potential scenarios: A) 5 Months Consolidation: After a 5-month consolidation phase, a staggering 1500% surge ensued. If history repeats itself, brace for a potential surge to $10 from the current price position for #XRP start 1st of April 2024
B) 12 Months Consolidation: In another instance, a 12-month consolidation preceded an incredible 8000% spike. Should history mirror this scenario, #XRP might skyrocket to $50 from its current standing start 1st of November 2024″
CryptoInsightUK is also bullish, though the believes that the price will appreciate against Bitcoin (BTC) instead.
Read more: (XRP) Ripple Price Predictions
XRP Price Prediction: Will Price Bounce or Break Down?
Similarly to the weekly time frame, the daily one gives mixed readings. This is because of the RSI and the price action.
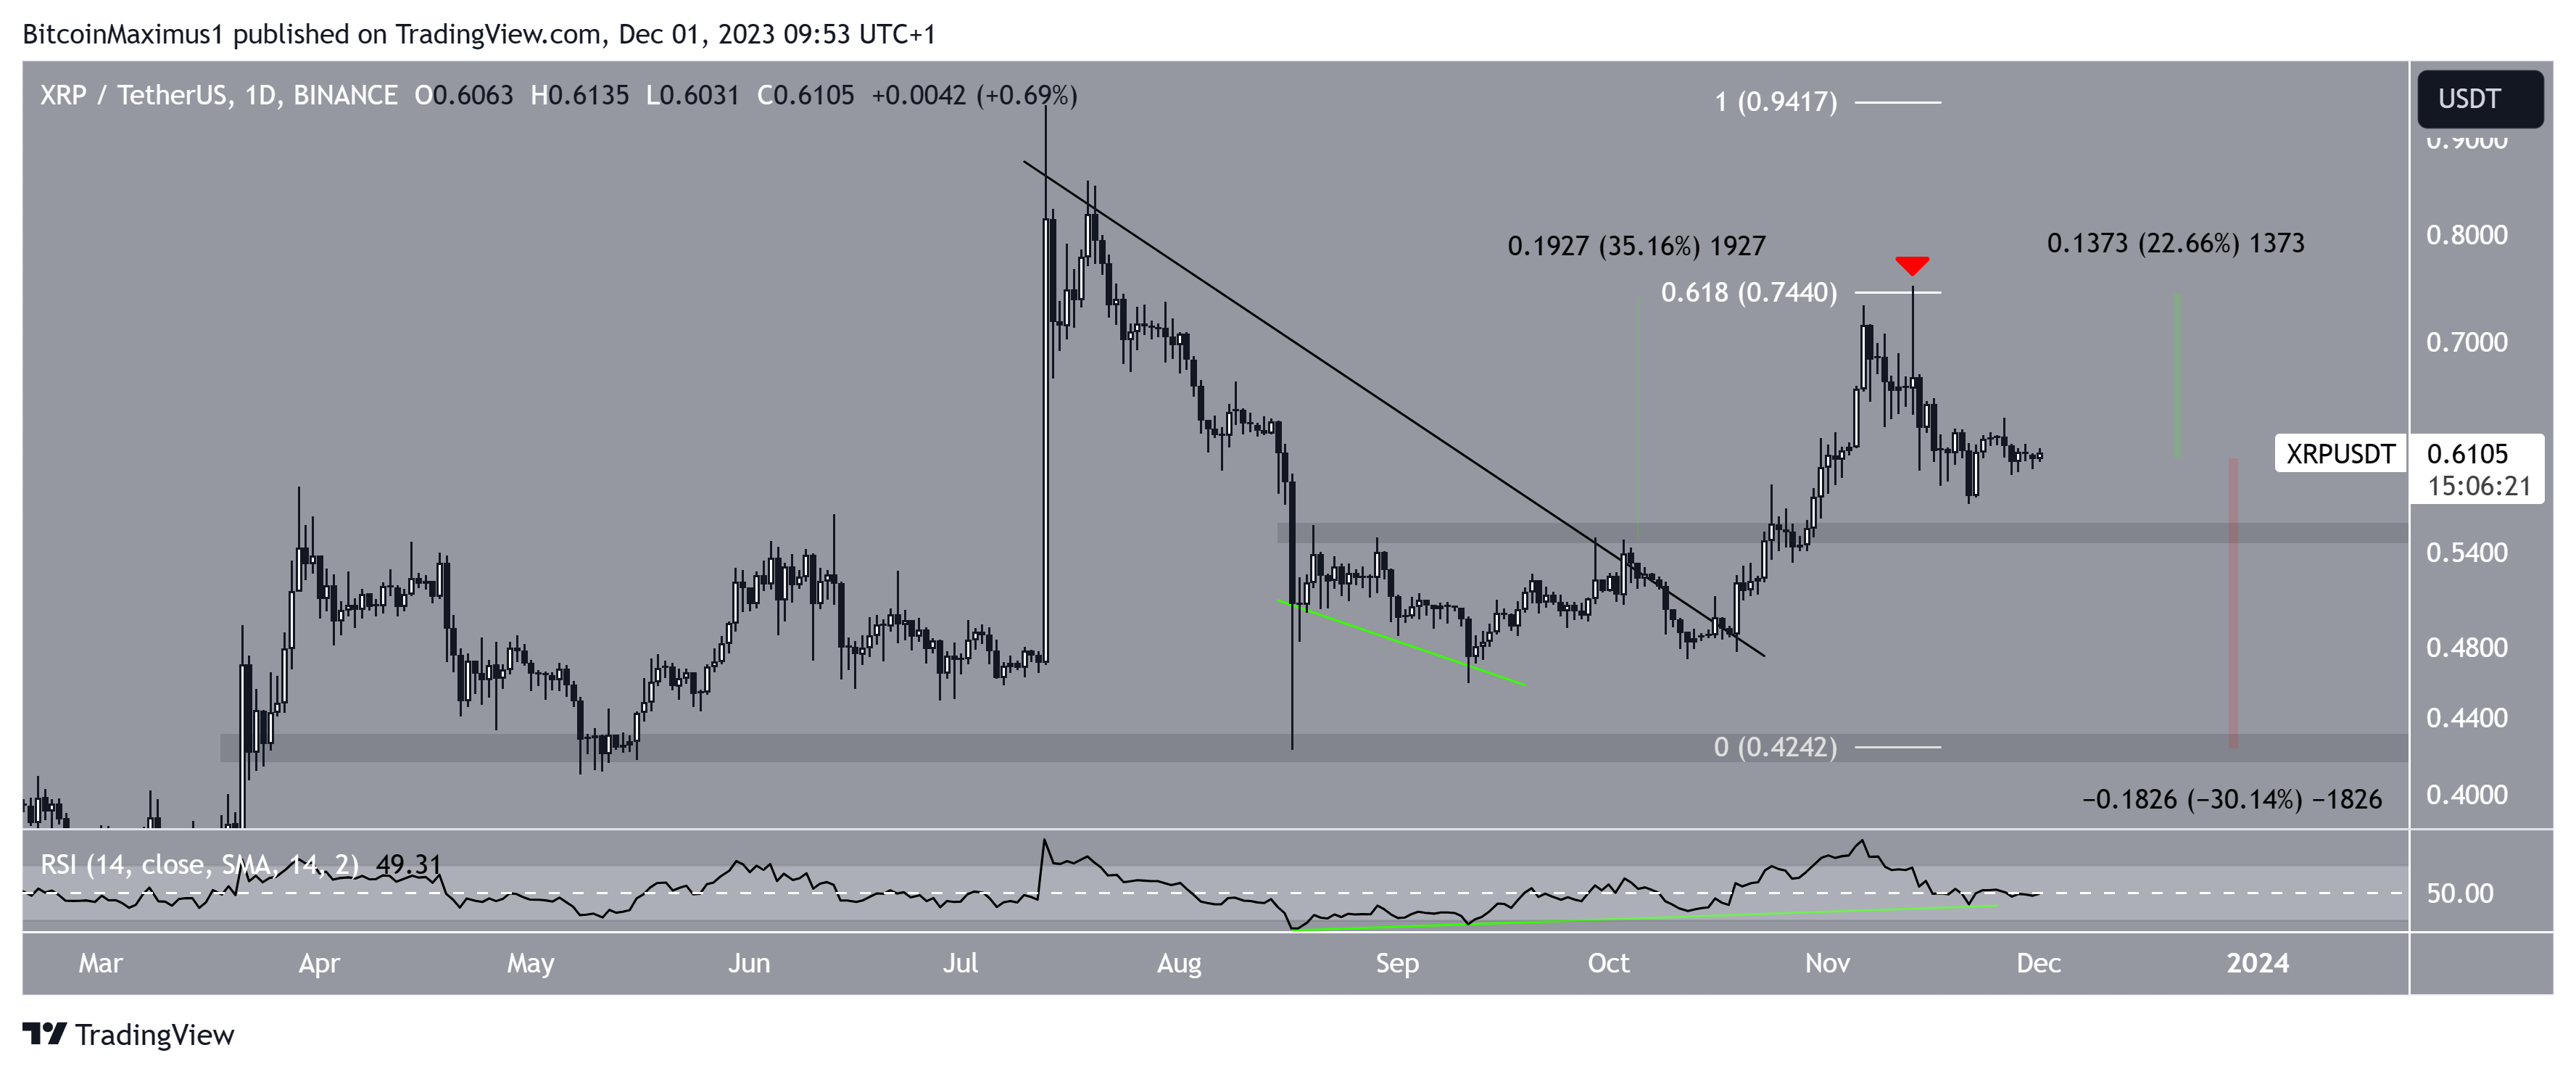
On October 19, the XRP price broke out from a long-term descending resistance trend line. This seemingly indicated that the previous correction was complete, and a new upward movement had begun.
However, the XRP price was rejected by the 0.618 Fib retracement resistance level on November 13, creating a long upper wick (red icon). The wick is a sign of selling pressure and validated the $0.74 resistance area.
The daily RSI is decreasing and is below 50. However, its bullish divergence trend line (green) is still intact, allowing for the possibility that the increase is still valid.
As a result of these mixed readings, the XRP price reaction to the $0.55 support area will be key in determining the future trend. Since the area also coincides with the long-term ascending support trend line, a breakdown below will confirm that the upward movement is over.
A 30% drop to the next support at $0.42 will be expected in that case.

On the other hand, a strong bounce at the $0.55 area can cause the XRP price to revisit the 0.618 Fib resistance. This would be an increase of 22% from the current price and 35% from the $0.55 area.
For BeInCrypto’s latest crypto market analysis, click here.
Disclaimer
In line with the Trust Project guidelines, this price analysis article is for informational purposes only and should not be considered financial or investment advice. BeInCrypto is committed to accurate, unbiased reporting, but market conditions are subject to change without notice. Always conduct your own research and consult with a professional before making any financial decisions. Please note that our Terms and Conditions, Privacy Policy, and Disclaimers have been updated.


