


The Ripple XRP price increase stalled despite a breakout from the $0.55 long-term horizontal resistance area.
Will the XRP price regain its footing and make another breakout attempt, or are new lows in store?
XRP Breaks out but Struggles to Maintain Increase
The technical analysis in the weekly time frame for XRP shows that the price has increased alongside an ascending support trend line since the start of the year.
During this time, the price broke out from the $0.55 horizontal resistance area and reached a new yearly high of $0.94 in July (red icon).
However, XRP failed to maintain its increase. Rather, it created a very long upper wick and fell, reaching the ascending support trend line again in August (green icon).
Read more: Best Crypto Sign-Up Bonuses in 2023
After bouncing at the trend line again in October, the XRP price broke out from the $0.55 area. XRP reached a high of $0.75 this week, but the XRP price increase stalled once more.
Rather, it created a long upper wick, and is nearing the $0.55 horizontal area.
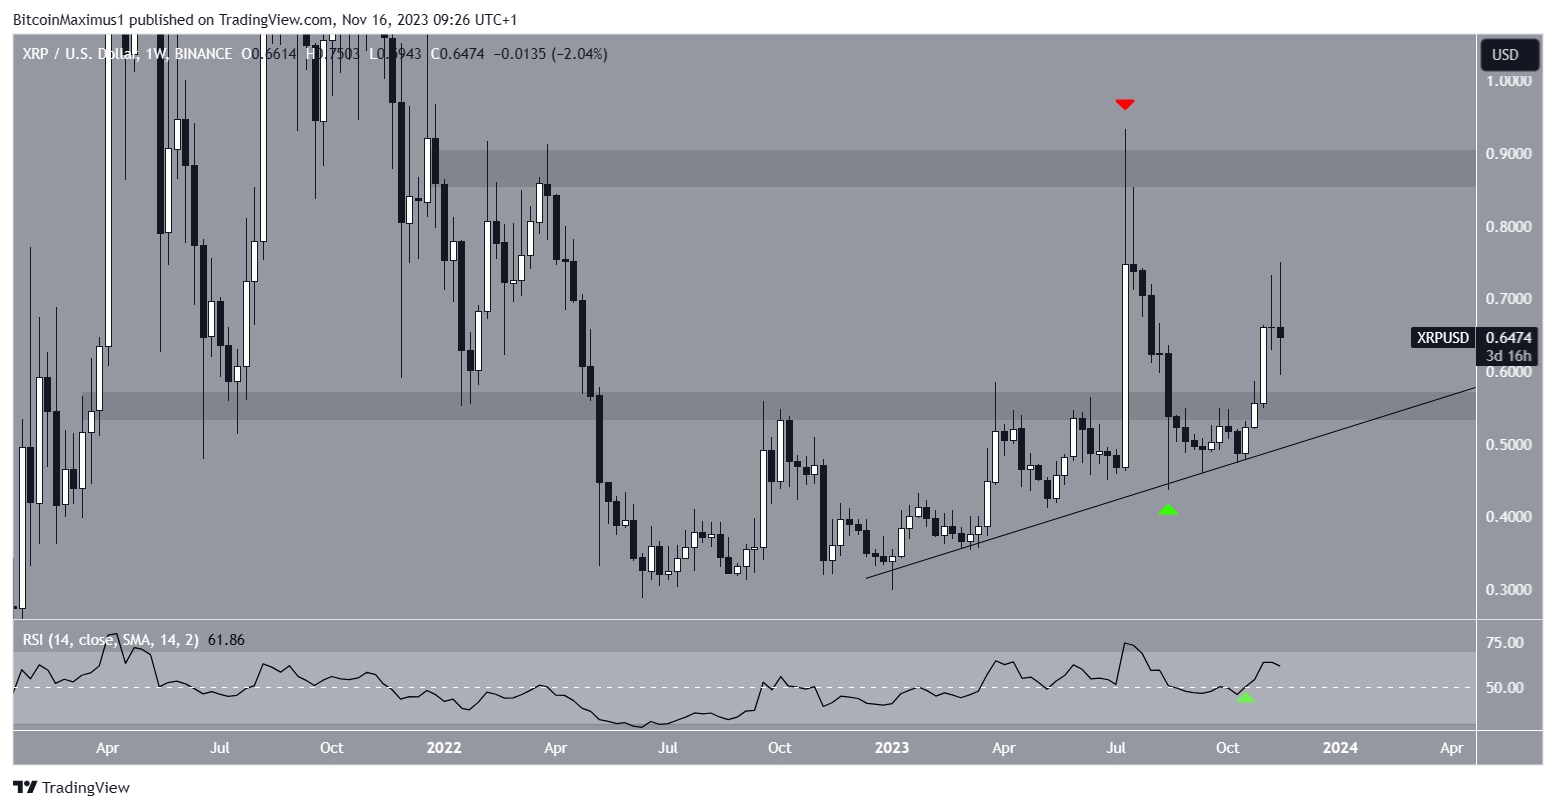
The weekly Relative Strength Index (RSI), a momentum indicator, gives a positive reading.
When evaluating market conditions, traders use the RSI as a momentum indicator to determine whether a market is overbought or oversold and whether to accumulate or sell an asset.
If the RSI reading is above 50 and the trend is upward, bulls still have an advantage, but if the reading is below 50, the opposite is true. The RSI is currently above 50.
Read more: (XRP) Ripple Price Predictions
What Do Analysts Say About Increase?
Cryptocurrency trader TonythebullBTC is extremely bullish on the XRP prospects for several reasons. He stated that:
“I find it challenging not to be bullish on XRP just glancing at this: BBW is the second tightest ever, %B is above 0.5 suggesting bullish price action, price poked out of the upper Bollinger Band – closing above it is a breakout buy signal.”
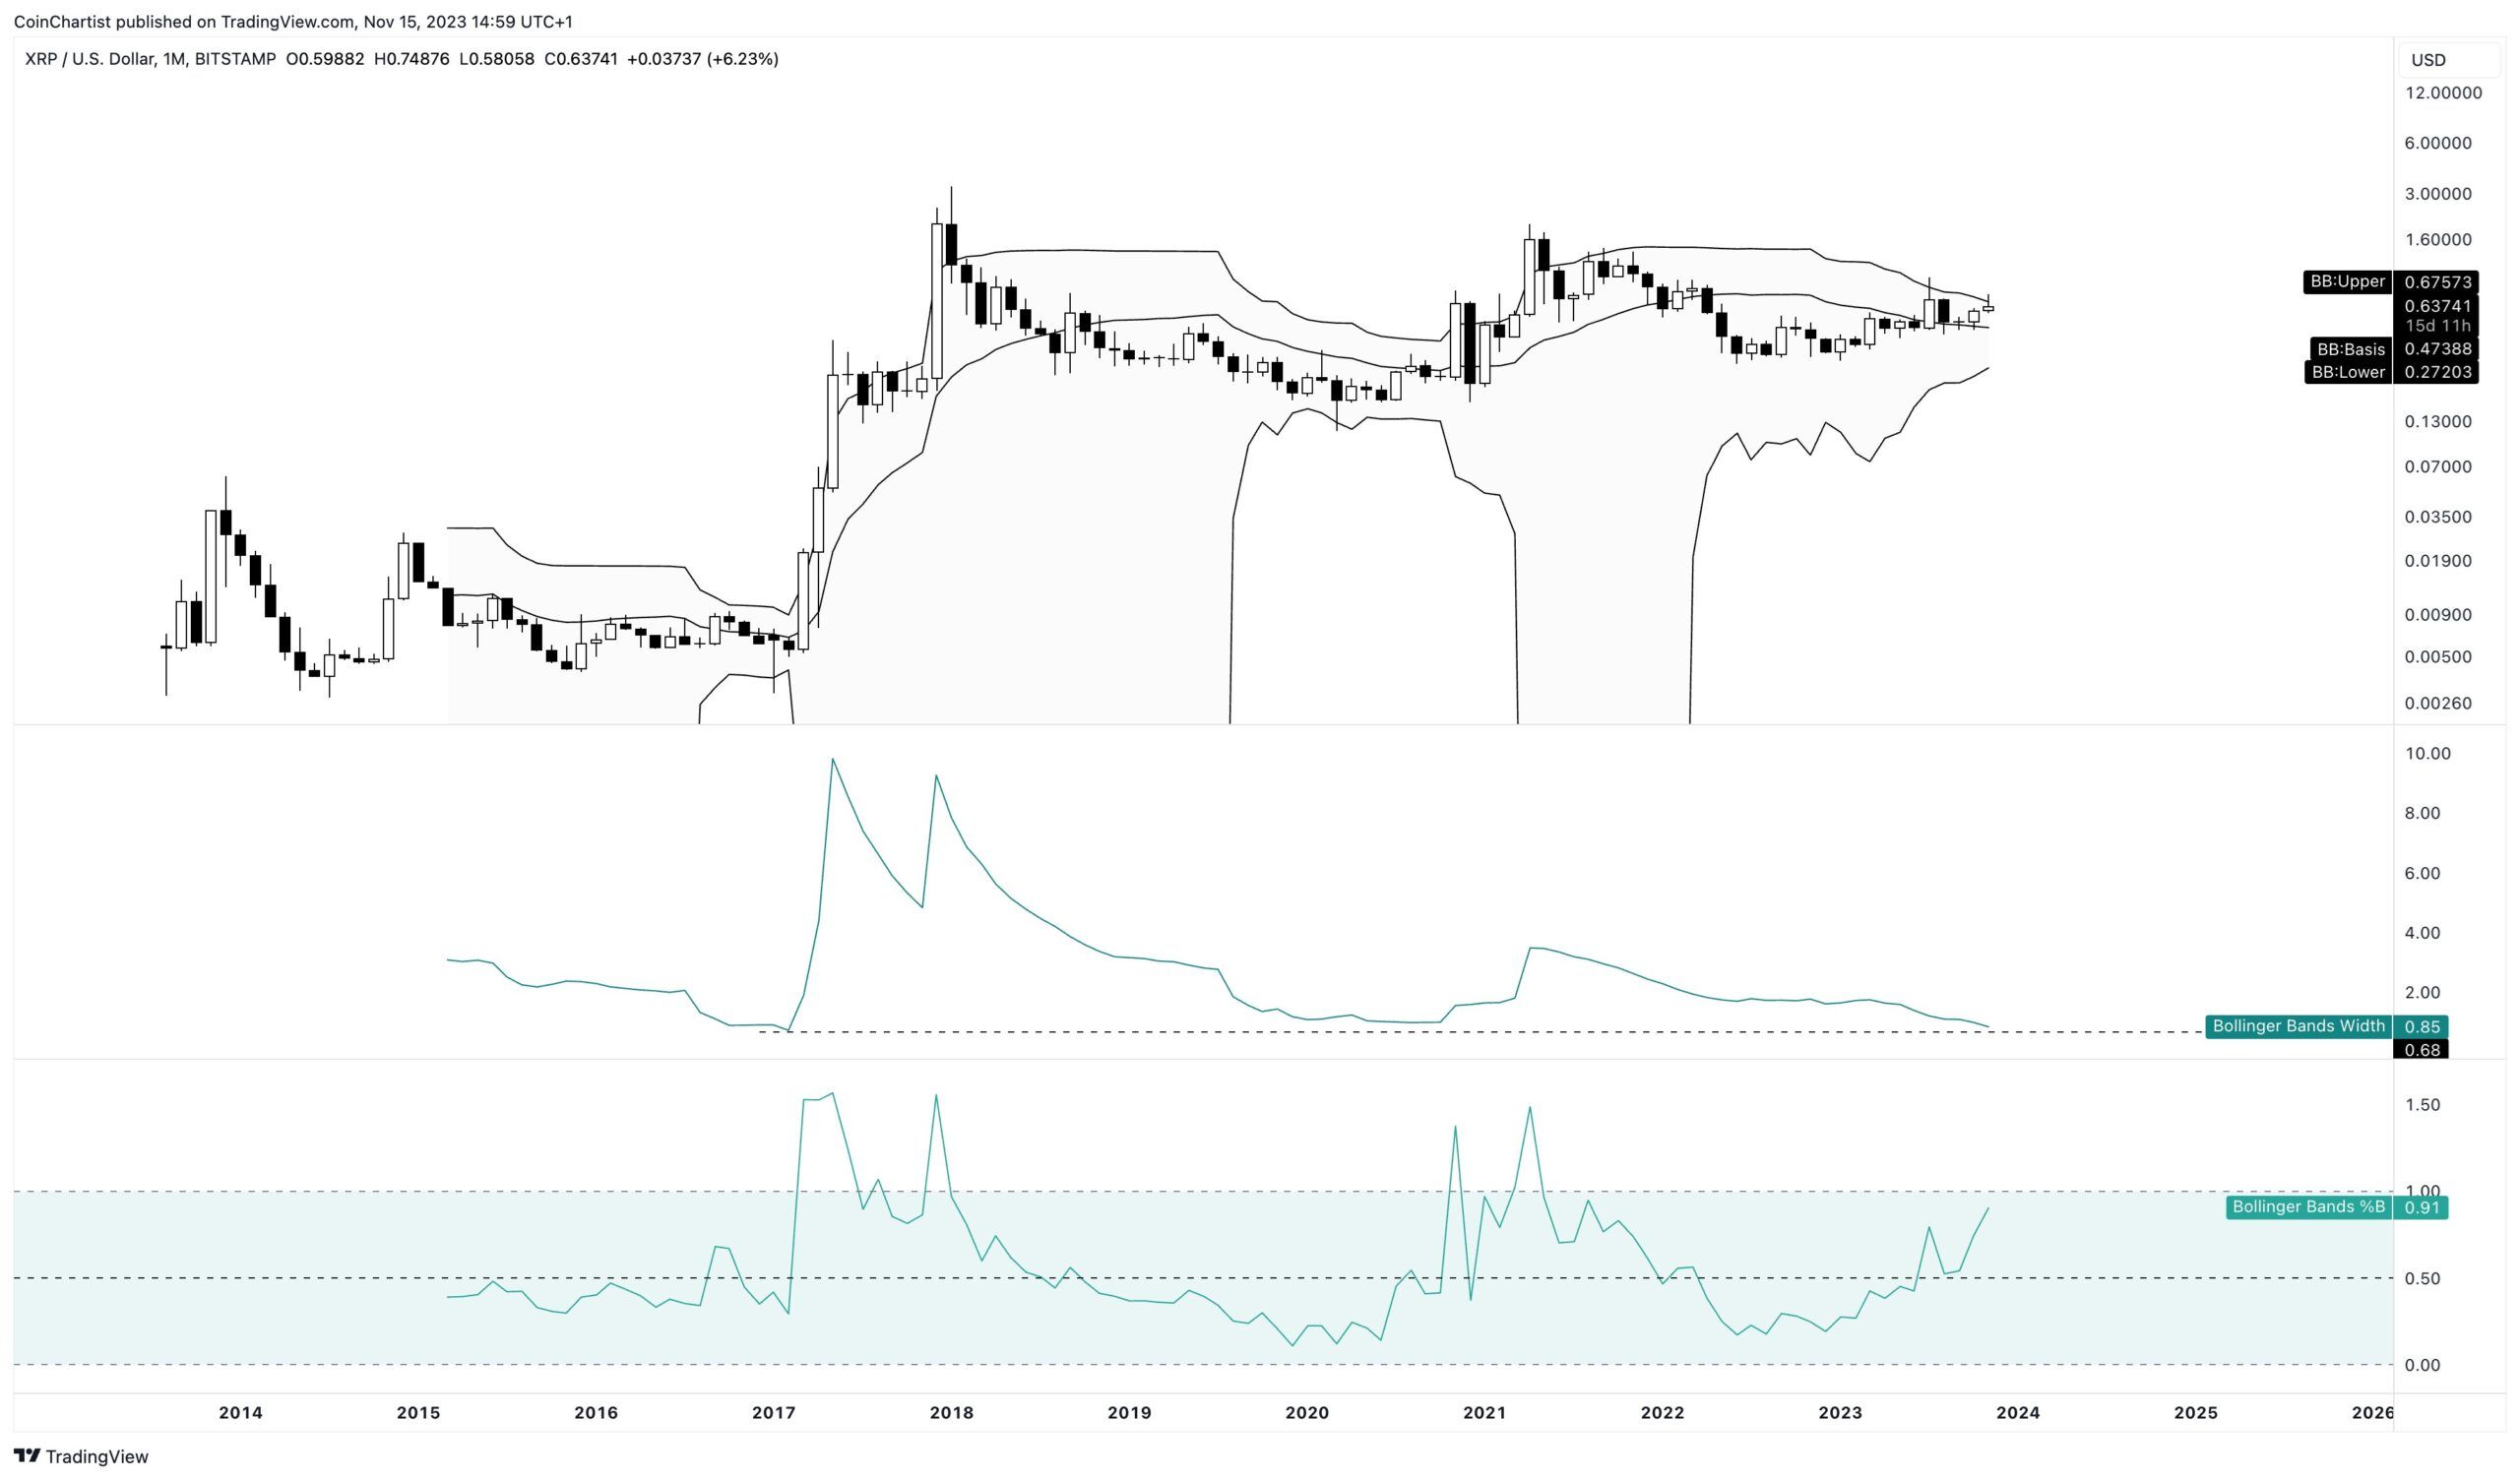
Cryptoes_ta is also bullish since the price holds above the $0.60 minor support area. However, Naveed Ahmad expressed his skepticism after a 1.5% decrease since Nov. 13.
Ripple XRP Price Prediction: Will Price Regain Footing?
The technical analysis from the daily time frame gives a mixed reading.
On the positive side, XRP broke out from a descending resistance trend line on Oct. 19. The trend line had been in place for 98 days at the time of the breakout.
After breaking out, the XRP price was rejected by the 0.618 Fib retracement resistance level on Nov. 13. This created a long upper wick (red icon) and validated the $0.74 area as resistance. XRP has fallen since the rejection.
Read more: How To Buy XRP and Everything You Need To Know
The daily RSI is also mixed. While the indicator is decreasing, it is still slightly above 50. Additionally, it is approaching the bullish divergence trend line (green) that preceded the entire increase.
So, whether the RSI bounced at the 50 level can determine the future trend.
A successful RSI bounce alongside a XRP price bounce at the $0.60 support can lead to an increase. This could cause a breakout from the 0.618 Fib resistance and a 50% increase to the next resistance at $0.94.
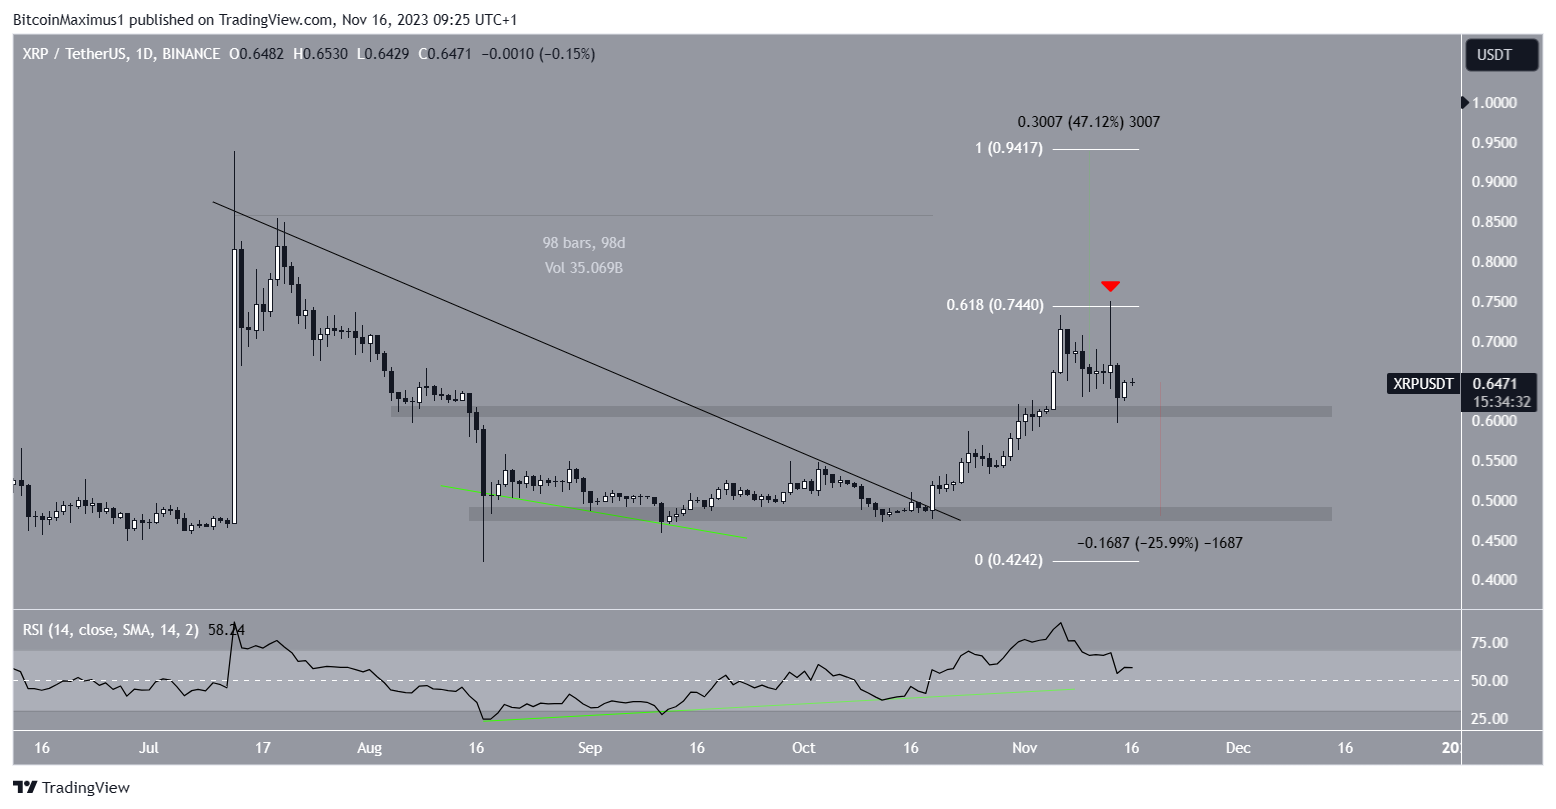
Despite this bullish XRP price prediction, a close below the $0.60 horizontal support area can cause a 25% drop to the next closest support at $0.50.
For BeInCrypto’s latest crypto market analysis, click here.


