


The Tezos (XTZ) price broke through a 230-day resistance trendline, leading to a 13% increase in a single day.
This breakthrough has generated considerable market attention due to its unexpected nature and a surge in trading volume, leaving many investors and traders pondering why it happened and its potential implications.
Tezos Breaks Out from 230-Day Resistance Trendline
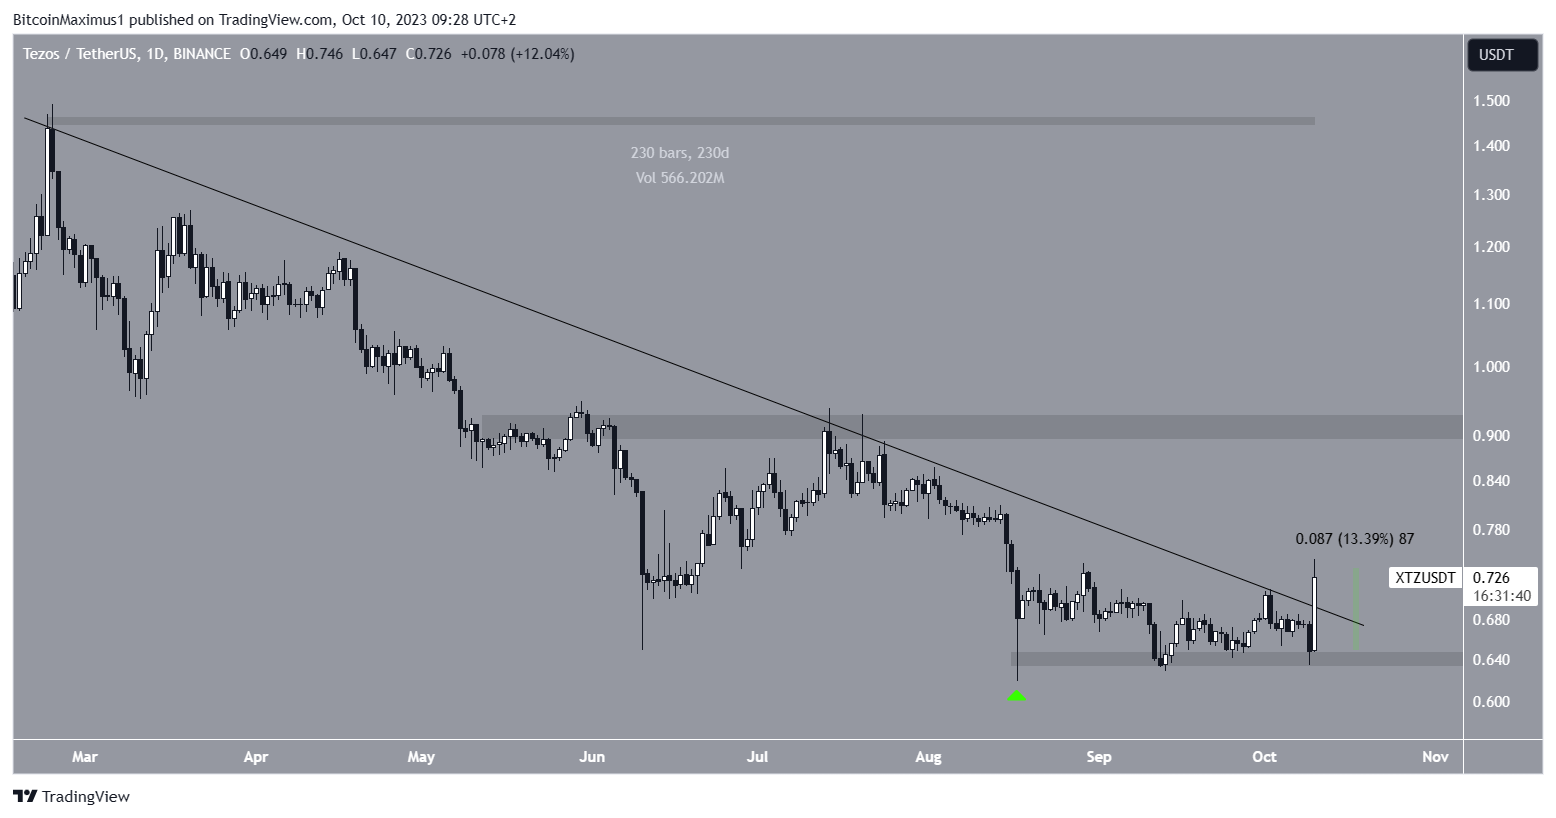
The XTZ price has fallen under a descending resistance trendline since February. The decrease led to a low of $0.62 on August 17.
The price bounced afterward, creating a long lower wick (green icon) and validating the $0.64 horizontal area as support. After consolidating above the area for a long period of time, Tezos finally broke out on October 10.
So far, the Tezos price has increased by 13% today. While it has moved above the resistance trendline, it has yet to reach a daily close above it. The trendline has been in place for 230 days.
There has been considerable speculation surrounding the underlying factors behind the recent surge in XTZ. However, a definitive rationale for this upward movement still remains elusive.
What has notably captured the attention of numerous investors is the substantial surge in trading volume. In fact, the trading volume observed over the course of the past six hours stands as the highest since September 2021, a period during which the altcoin‘s price approached its all-time high.
Such an abrupt increase in trading activity typically indicates a few significant accounts executing many orders.
This spike in volume has led market participants to speculate whether a large trader, referred to as a “whale,” possesses privileged information pertaining to imminent events and has accordingly chosen to accumulate positions.
Nevertheless, it is imperative to acknowledge that not all market participants are convinced of the sustainability of this rally, as some are actively exploring potential short-selling opportunities.
XTZ Price Prediction: How Long Will Increase Continue?
The daily RSI supports the continuing of the increase. Market traders use the RSI as a momentum indicator to identify overbought or oversold conditions and to decide whether to accumulate or sell an asset.
Readings above 50 and an upward trend indicate that bulls still have an advantage, whereas readings below 50 suggest the opposite.
The RSI is above 50 and increasing, both signs of a bullish trend.
Also, the entire rally was preceded by a bullish divergence in the RSI (green line). This occurs when a momentum increase accompanies a price decrease and often precedes trend reversals.
Read More: Best Upcoming Airdrops in 2023
It is worth mentioning that open interest (green icon) grew massively on the increase, meaning that the futures market could have fueled at least a portion of the rally.
Open interest is the number of open positions, including both long and short positions. So, these traders could either be short traders who are caught offside and have yet to close their positions or well-positioned long traders profiting off the move.
If the increase continues, the cryptocurrency can increase by 25% and reach the next resistance at $0.90.
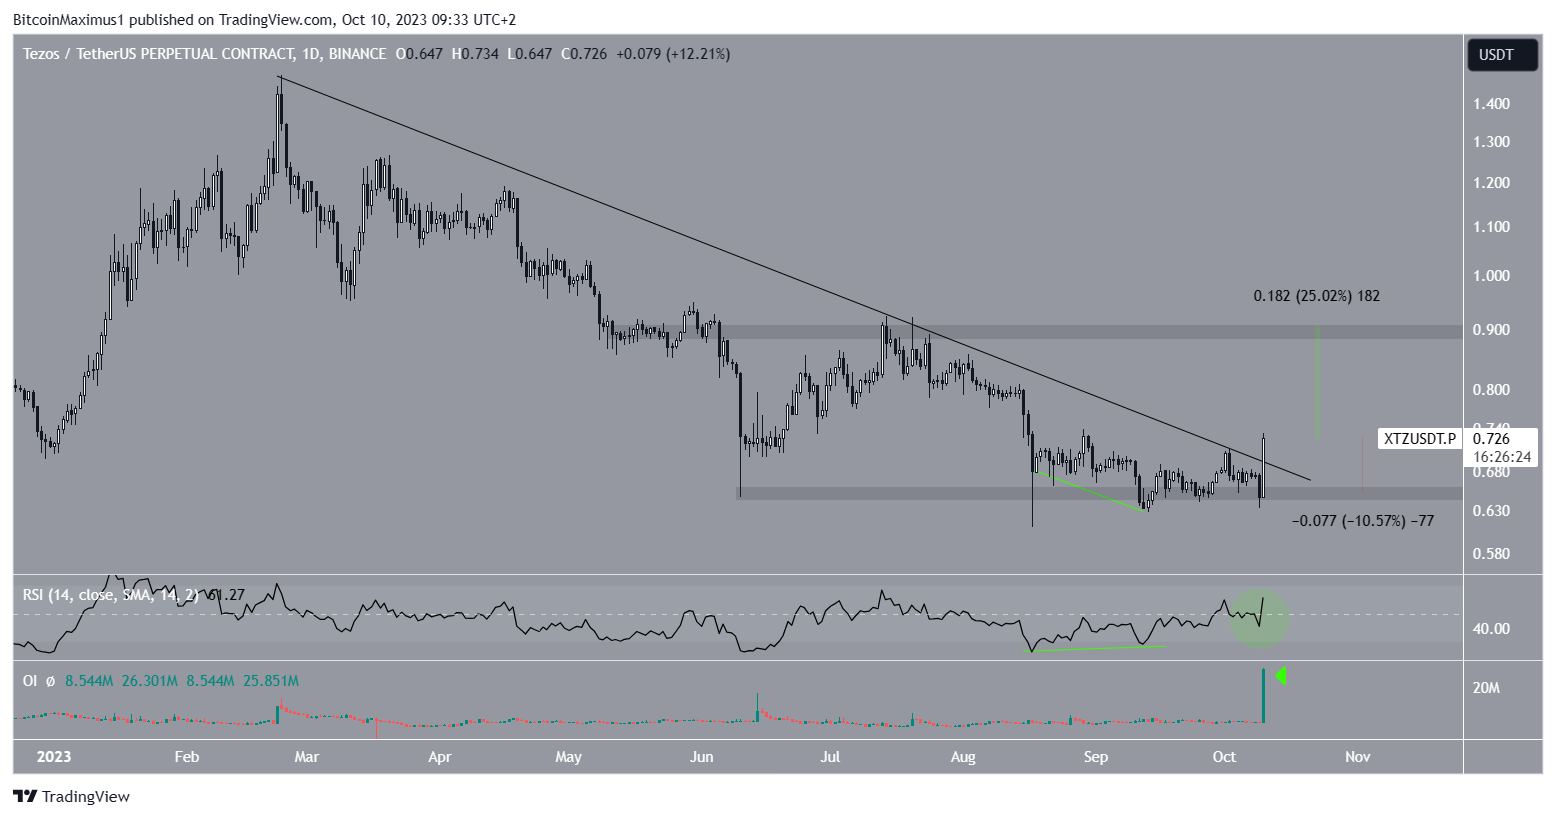
Despite this bullish XTZ price prediction, failure to close above the descending resistance trendline will likely cause a 10% drop to the closest support at $0.65.


