Tezos is an altchain that thrives on smart contracts and looks much like Ethereum. Or, at least, it does on paper. However, there is a significant difference between the two blockchains. Tezos is invested heavily in governance-backed blockchain development without running into issues concerning hard forks. This is one of the few reasons the altchain’s native coin, XTZ, looks desirable. But is XTZ a worthy investment in this bear market? What are the coin’s long-term price capabilities? This Tezos price prediction takes a look.
- Tezos price prediction and the role of fundamentals
- Crucial Tezos insights
- Tezos price prediction and performance analysis
- Tezos price prediction and the related tokenomics
- Tezos price prediction and technical analysis
- Tezos (XTZ) price prediction 2023
- Tezos (XTZ) price prediction 2024
- Tezos (XTZ) price prediction 2025
- Tezos (XTZ) price prediction 2030
- Tezos (XTZ’s) long-term price prediction until 2035
- Is the Tezos price prediction model accurate?
- Frequently asked questions
Tezos price prediction and the role of fundamentals
The Tezos blockchain is a smart contract ecosystem that supports DApps. So, the most simplistic use case is one that appeals to blockchain developers. If moving beyond the scaling limitations of Ethereum and the restricted flexibility of Bitcoin is necessary, Tezos is an attractive option.
Did you know? The team behind the ecosystem puts a novel, secure, and powerful programming language — OCaml — at the helm. But the best part about Tezos is the non-contentious nature of upgrades.
With Tezos, expect zero hard forks and a governance-specific upgrade model.
Crucial Tezos insights
Here are a few additional insights that make sense from an investment-specific viewpoint:
- The blockchain involves staking but with a twist. The term here is baking and makes the participants a part of the network governance.
- The network infrastructure is segregated into consensus, transaction, and network protocols. This approach minimizes overlaps and stands for transparency.
- The overall consensus mechanism is still PoS (proof-of-stake), making Tezos environmentally friendly.
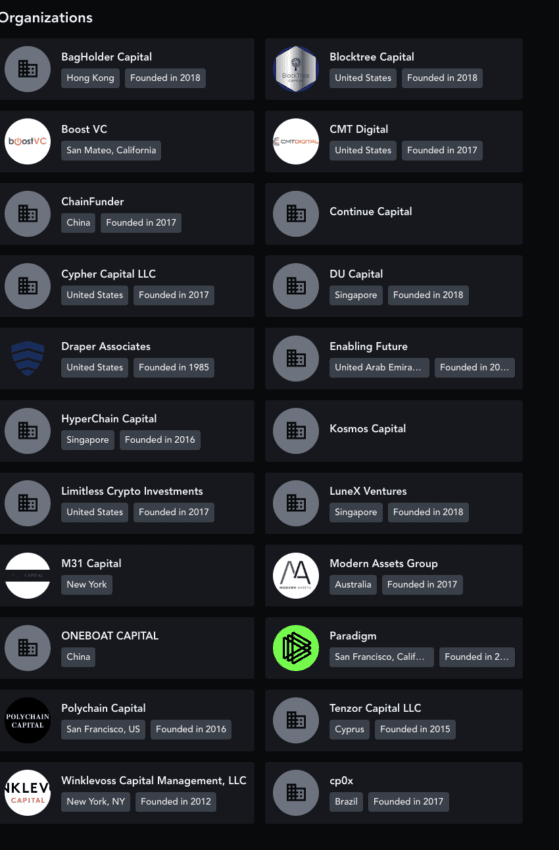
- The ecosystem has the famous Winklevoss Capital as an investor.
- Its latest protocol upgrade went live on Sep. 23, 2022. The next set of improvements is lined up for early 2023, focusing on scaling.
Arthur Breitman and his wife Kathleen were the brains behind the Tezos protocol — at least the whitepaper and the code underpinning the chain.
The fundamental structure of Tezos is solid. This might just push the future price of the Tezos coin.
Tezos price prediction and performance analysis
Several elements of the Tezos blockchain indicate that XTZ is worth your attention. Firstly, the Tezos NFT ecosystem is growing at a clip, per the January 2023 data.
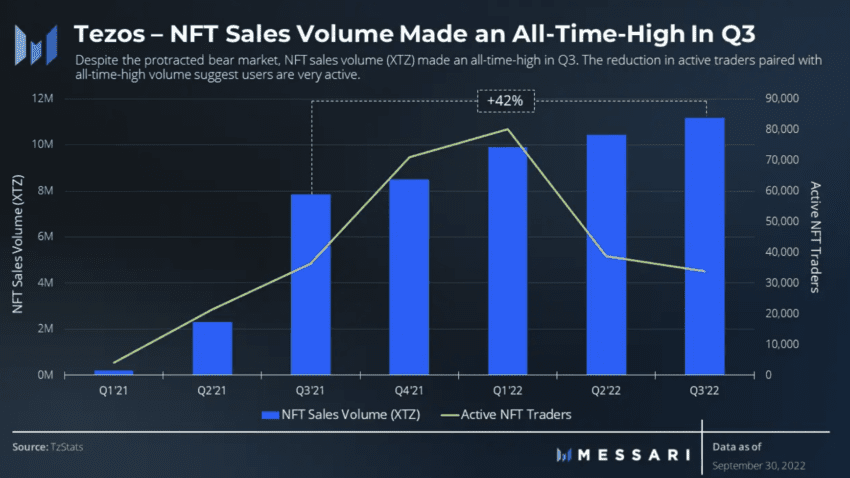
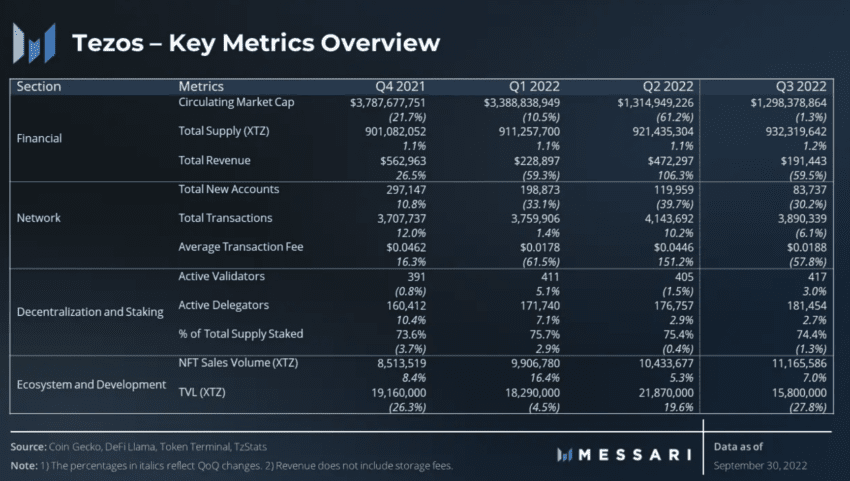
Messari’s State of Tezos report for Q3 2022 states that the NFT sales volume increased by almost 7%. The DeFi presence took a hit, though, with the TVL dipping almost 28% QoQ as of 30 September, 2022.
The news of Manchester United launching an NFT collection on Tezos broke in mid-December, 2022. This suggests the ecosystem’s NFT growth is looking up. This development might still impact prices positively.
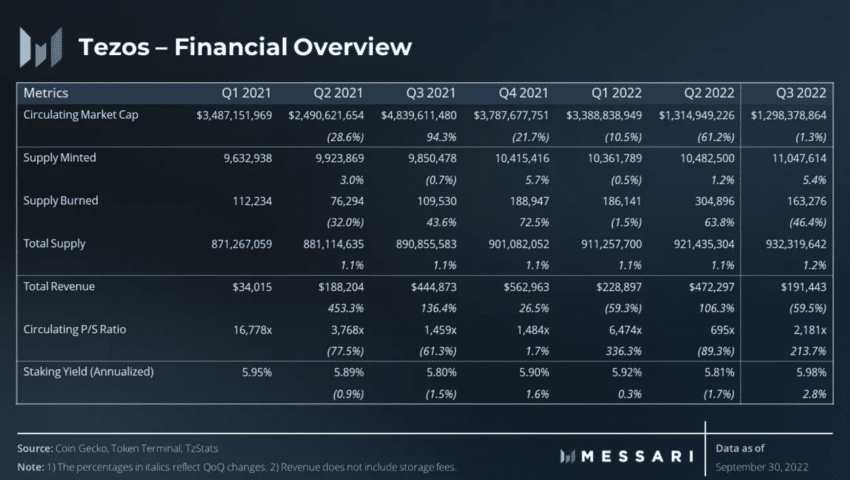
The Q3, 2022 financial performance wasn’t ideal: revenue dropped 58%. However, low transaction fees played a major role in keeping revenue down, which will please developers.

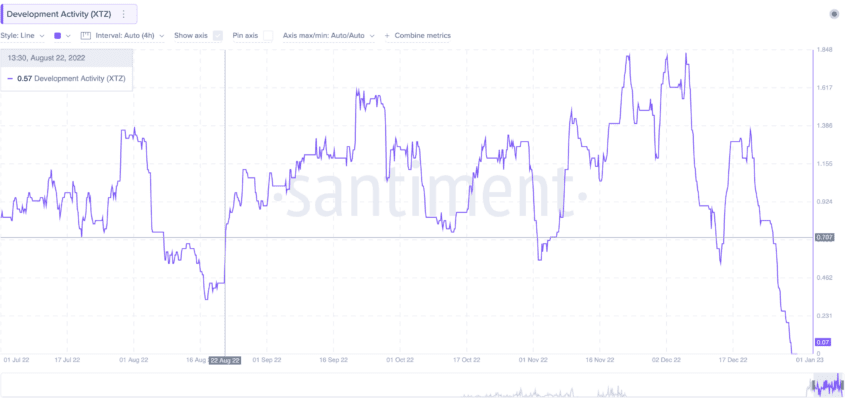
The network overview, as of January 2023, shows that smart contract calls dipped by 11% — showing a decline in developer activity. Here is a development activity chart with a discernible dip in mid-August, 2022.
But there is a positive hiding here, too — one that could easily be missed. A metric termed “total accounts cleared” saw a 73% dip in QoQ — revealing fewer people left the Tezos ecosystem. In Q2, this metric peaked at 98.3%. Despite this, the market cap of Tezos stayed relatively flat QoQ, dropping a mere 1.38%. However, the “total accounts cleared” metric is something that makes us optimistic about the price of XTZ in 2024 and beyond.
Finally, Tezos further decentralized in Q3 2022, with a 6% increase in active validators. This development might be positive for the XTZ price in the short and mid-term.
Tezos price prediction and the related tokenomics
XTZ, the native coin of Tezos, helps with the network-specific transaction fees. Developers executing smart contracts can use XTZ. However, the primary role of the Tezos coin is governance, as staking (baking in this case) helps with validation and block creation. And if a validator isn’t doing right by the power vested in them, a slashing mechanism is in place.
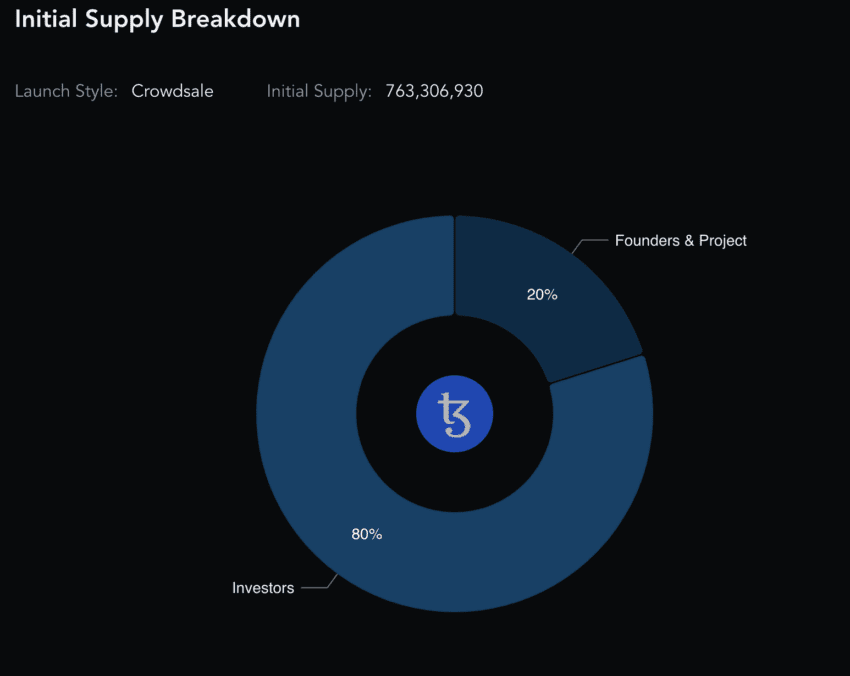
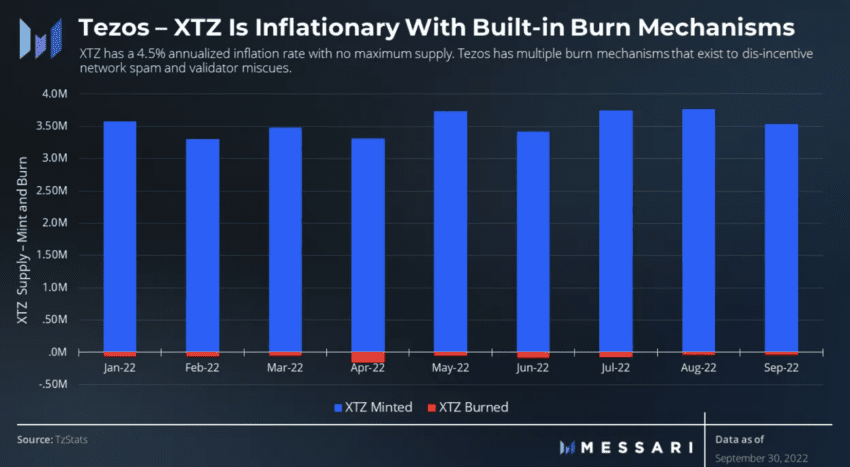
It is important to note that Tezos doesn’t have a capped supply. Simply put, the tokenomics model is inflationary. Also, the annual issuance rate is 4.5%. Currently, almost 993 million tokens are the maximum total supply. Almost 972 million make the circulating supply. Finally, the initial supply distribution shows that most tokens belong to investors, making the token model quite transparent.
Tezos blockchain also has a token burn mechanism. However, this is relatively slow and unable to offset the overall issuance rate as yet.
The demand-supply curve is hinged toward the supply side, and the price of XTZ might not see a monumental rise for this reason. However, if more smart contracts are deployed and validators slip up, slashing and other forms of token burning might help make XTZ disinflationary.
Tezos price prediction and technical analysis
The fundamentals and performance analysis of Tezos hint at long-term growth optimism. But the price charts and technical analysis remain a crucial part of the puzzle. Before we head over to the details and patterns relevant to the price charts, here are a few insights to take note of:
The peak price of Tezos is $9.18, which it touched on Oct. 4, 2021.
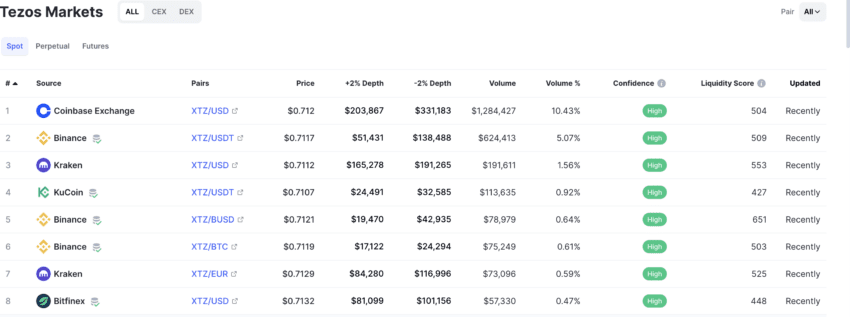
As far as trading activity is concerned, the spot market presence of Tezos is pretty strong. The XTZ-USD and the XTZ-USDT pairs on Coinbase and Binance occupy most of the trading volume.
In the short term, per the 2023 chart, the Tezos coin looks bullish. The trading pattern shows a bullish dropping channel/wedge that might lead to a price surge if XTZ manages to breach the upper trendline. Meanwhile, the RSI is hinting at a bullish divergence. The RSI is making a higher low, whereas the price action shows a lower low. Do note the pattern is not as strong and might reverse anytime. Still, the short-term price forecast of Tezos doesn’t look all that bearish.
Notably, the prices did go up as estimated, especially towards the end of 2023.
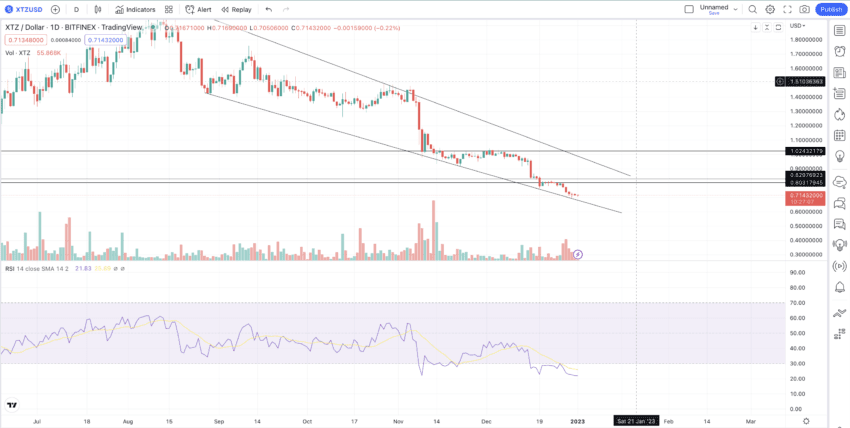
The short-term daily chart shows an increase in trading volume. However, the sellers are taking center stage, and we shall need towering green pillars to see a price surge. The current price of XTZ is $0.71 as of January 2023. It might have to breach the $1.02 mark to make an uptrend in the short term.
Weekly chart and pattern identification
Let us now turn to the weekly chart to identify a pattern. We can see that XTZ has made a series of higher highs to reach its October 2021 high. Once there, it starts a series of lower highs. Below is the weekly chart with the highs and lows marked clearly.
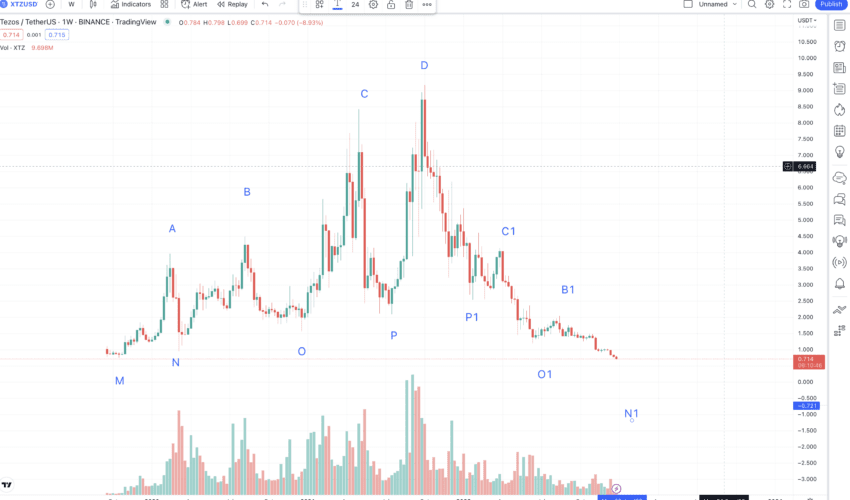
Do note that “D” is the middle point of a near-symmetrical pattern. XTZ forms a foldback pattern; we can expect the right side of the pattern to look similar to the left side. Also, a clear decline in the trading volume after reaching the peak is visible, illustrating an inherent market weakness. Therefore, seeing the price peaks lower on the right side would not be surprising.
Price changes: high to low
Now we can locate the distance and price changes from the peaks to the immediate lows. We will consider both the right and left sides of the pattern.
Left side values: (data set 1)
D to P = 77 days and -77.25% price change; C to O = 133 days and -81.6% price change; B to N = 154 days and -79.17% price change; A to M = 119 days and -81.78% price change.
Right side values: (data set 2)
D to P1 = 112 days and -72.4% price change; C1 to O1 = 77 days and -70.98% price change
Let us take an average of the drop datasets. This information will help us find the actual “N1” from B1. Here, we will see if the low has arrived or if we can expect some near-term corrections.
Average distance and price change % values come to be 112 days and -77.215%. These are the values to trace from B1. As we are in a bear market, the longest duration for the low to surface could be 154 days.
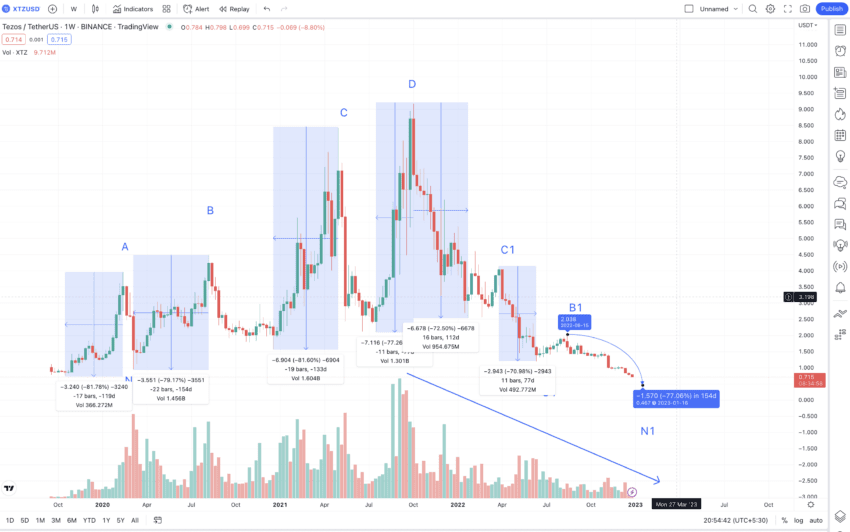
Therefore, the next low might surface at $0.467 in early 2023. Trading volume has been declining since, and this low value may not be out of the equation.
Tezos (XTZ) price prediction 2023
We predicted $1.6 for XTZ in 2023, but the gains flatlined at $1.12. Here is how we moved with the analysis:
We have the Tezos price prediction for 2023, but only a minimum price point. However, this might remain the lowest point in 2023 as per the Tezos price prediction 2023 model. To find the high, we must find the distance and price change percentages from the lows to the highs. Then, we can take an average to normalize the subsequent readings.
Calculations
Data set 3 is as follows:
M to A = 119 days and 420.97% price change; N to B = 154 days and 371.96% price change; O to C = 133 days and 430.71% price change; P to D = 77 days and 334.66% price change
Data set 4 (in reverse) is as follows:
N1 to B1 = 154 days and 319.17% price change; O1 to C1 = 77 days and 251.17% price change and P1 to D1 = 112 days and 265.59% price change
If we take an average of the values in data set 3 and data set 4, we get 118 days (max days can be 154) and 342.03%. As we are in a bear market, the lowest rise can be 251.17%, as per the lowest value in data set 4.
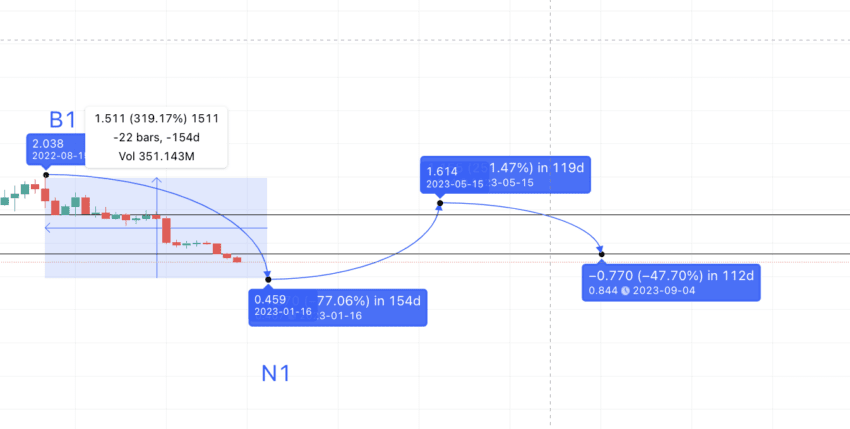
If we trace the path from N1, then the next high, or A1, shows up at $1.614. This level might surface somewhere in August or September 2023. The next drop, or M1, can then be in 112 days. If we go by the average drop of -77.215%, the low can show up at $0.374. However, considering the performance analysis of Tezos and the growing NFT and smart contract popularity, the low can take support at $0.844 (using the support line theory).
Tezos (XTZ) price prediction 2024
Outlook: Bullish
We have had several data points to use. However, if the price of the Tezos coin follows the historical pattern, then we might expect A2 to show up soon after M2. We can locate the next high using the low-to-high data points and average.
The average values were 118 days and a 342.03% hike, which puts 2024’s high at $3.73. However, we have assumed a few things here:
- Tezos will announce several key improvements in 2024.
- Financial performance improves, and the crypto market starts moving out of the grasp of the bear market.
Projected ROI from the current level: 210%
Tezos (XTZ) price prediction 2025
Outlook: Bullish
The next low could now be in 154 days (bull market vibes can delay the drop) but can take support at $2.027 instead of dropping 77.215%, according to the average high-to-low calculations. The next high could be in 154 days (max days) and at an increment of 342.03%, using data sets 3 and 4.
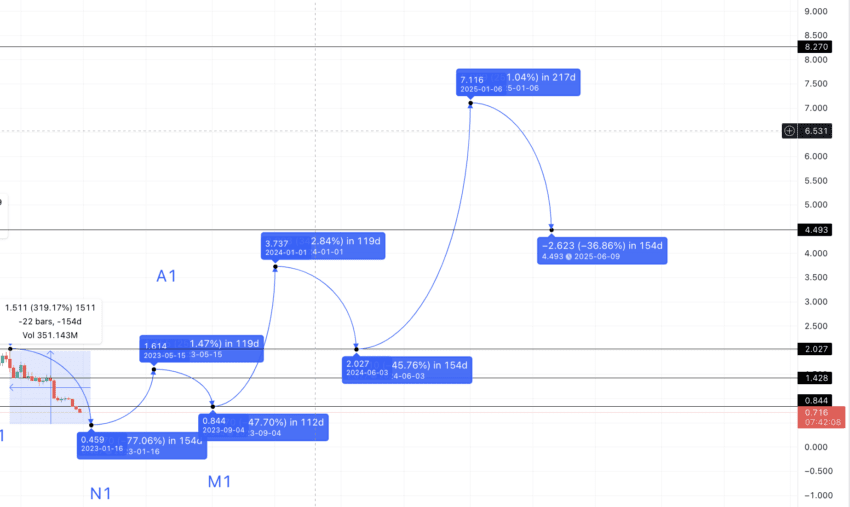
But here comes the twist. The tokenomics of the Tezos coin might keep the hike limited to the lowest value of 251.17% and even push the same to 2025. Therefore, the high in 2025 can surface at $7.116. We can mark this B2.
The drop from B2 can be anywhere between 77 days and 154 days. However, considering the uptrend at XTZ’s counter, we can expect the Tezos price prediction 2025 low to surface at $4.493. This level coincides with peak B from the first part of the pattern (the left side).
Projected ROI from the current level: 493%
Tezos (XTZ) price prediction 2030
Outlook: Very bullish
Now we have the minimum price as per the Tezos price prediction 2025 model, we can draw a path for the high in 2026. While the price of XTZ could reach 342.03%, there might be some strong resistance at $9.18 — the peak from October 2021.
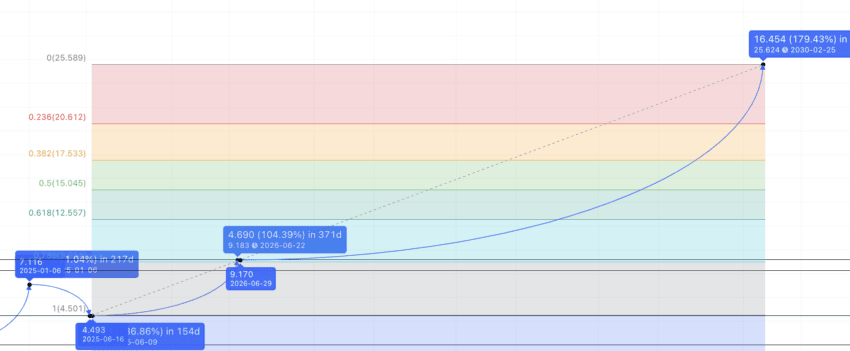
By now, we have a high in 2026 and a low in 2025. Connecting the points using the Fib indicator will give us the next set of highs.
The Fibonacci levels place the Tezos price prediction 2030 high at $25.589.
Projected ROI from the current level: 2032%
Tezos (XTZ’s) long-term price prediction until 2035
Outlook: Very bullish
You can easily convert your XTZ to USD
The Tezos coin price prediction for 2030 puts the high at $25.589. But for long-term investors, this might still not be enough as they might want to trace the Tezos price prediction 2035 and other models. Here is a table that might help with that:
| Year | | Maximum price of XTZ | | Minimum price of XTZ |
| 2024 | $3.73 | $1 |
| 2025 | $7.116 | $4.493 |
| 2026 | $9.18 | $5.69 |
| 2027 | $11.93 | $7.39 |
| 2028 | $15.51 | $12.09 |
| 2029 | $19.39 | $15.12 |
| 2030 | $25.589 | $19.95 |
| 2031 | $33.26 | $25.94 |
| 2032 | $46.57 | $36.32 |
| 2033 | $62.87 | $49.03 |
| 2034 | $94.30 | $73.55 |
| 2035 | $117.88 | $91.94 |
We can also locate the percentage change between the highs and lows to extrapolate the minimum and maximum prices on the Tezos price prediction 2040 path. That could validate a Tezos price prediction of $200 with ease. However, the state of the crypto market during the time of evaluation will take center stage in determining the growth of the Tezos blockchain.
Is the Tezos price prediction model accurate?
This Tezos crypto price prediction model isn’t doesn’t purely consider technical analysis and price chart patterns. Instead, it takes fundamentals, financial performance, and tokenomics into account in order to offer a holistic representation of future prices. This Tezos price prediction model also considers the changing bear and bull market conditions. As such, it is accurate, relatable, and practical for a long-term investor, as much so as possible in the crypto climate.
Frequently asked questions
Does Tezos have any future?
Will Tezos move up in 2024?
What will Tezos be worth in 2030?
How much will Tezos be worth in the next 5 years?
Is XTZ a good investment?
Does Tezos have a fixed supply?
Is XTZ better than Ethereum?
How much will Tezos be worth in 10 years?
Disclaimer
In line with the Trust Project guidelines, the educational content on this website is offered in good faith and for general information purposes only. BeInCrypto prioritizes providing high-quality information, taking the time to research and create informative content for readers. While partners may reward the company with commissions for placements in articles, these commissions do not influence the unbiased, honest, and helpful content creation process. Any action taken by the reader based on this information is strictly at their own risk. Please note that our Terms and Conditions, Privacy Policy, and Disclaimers have been updated.