


On October 4, Binance announced adding four tokens to its “Monitoring Tag” list. The tokens are Beta Finance (BETA), BarnBridge (BOND), Waltonchain (WTC) and NEM (XEM).
These tokens will be closely monitored and could be delisted if they do not pass periodic tests.
Why Are Tokens Placed in the Monitoring Tag List?
Tokens are mainly placed in the Binance monitoring tag list because of high volatility and risk compared to other listed tokens. These tokens are monitored periodically, and if they fail to meet the listing criteria, they are delisted from the Binance platform.
Some of the criteria that are considered during the review are:
- The team’s commitment to the project
- Trading volume and liquidity
- Level of public communication
- Safety of the network from attacks
- Whether they contribute to a healthy crypto ecosystem
BETA Approaches Yearly Lows
The BETA price broke down from an ascending support trendline on June 10. Afterward, it bounced and validated the line as resistance twice, on June 23 and July 11 (red icons). Such movements are common after a breakdown.
The altcoin has fallen since. On October 4, it reached a low of $0.067, validating a descending support trendline that has been in place since June. This is the final support level before the yearly low.
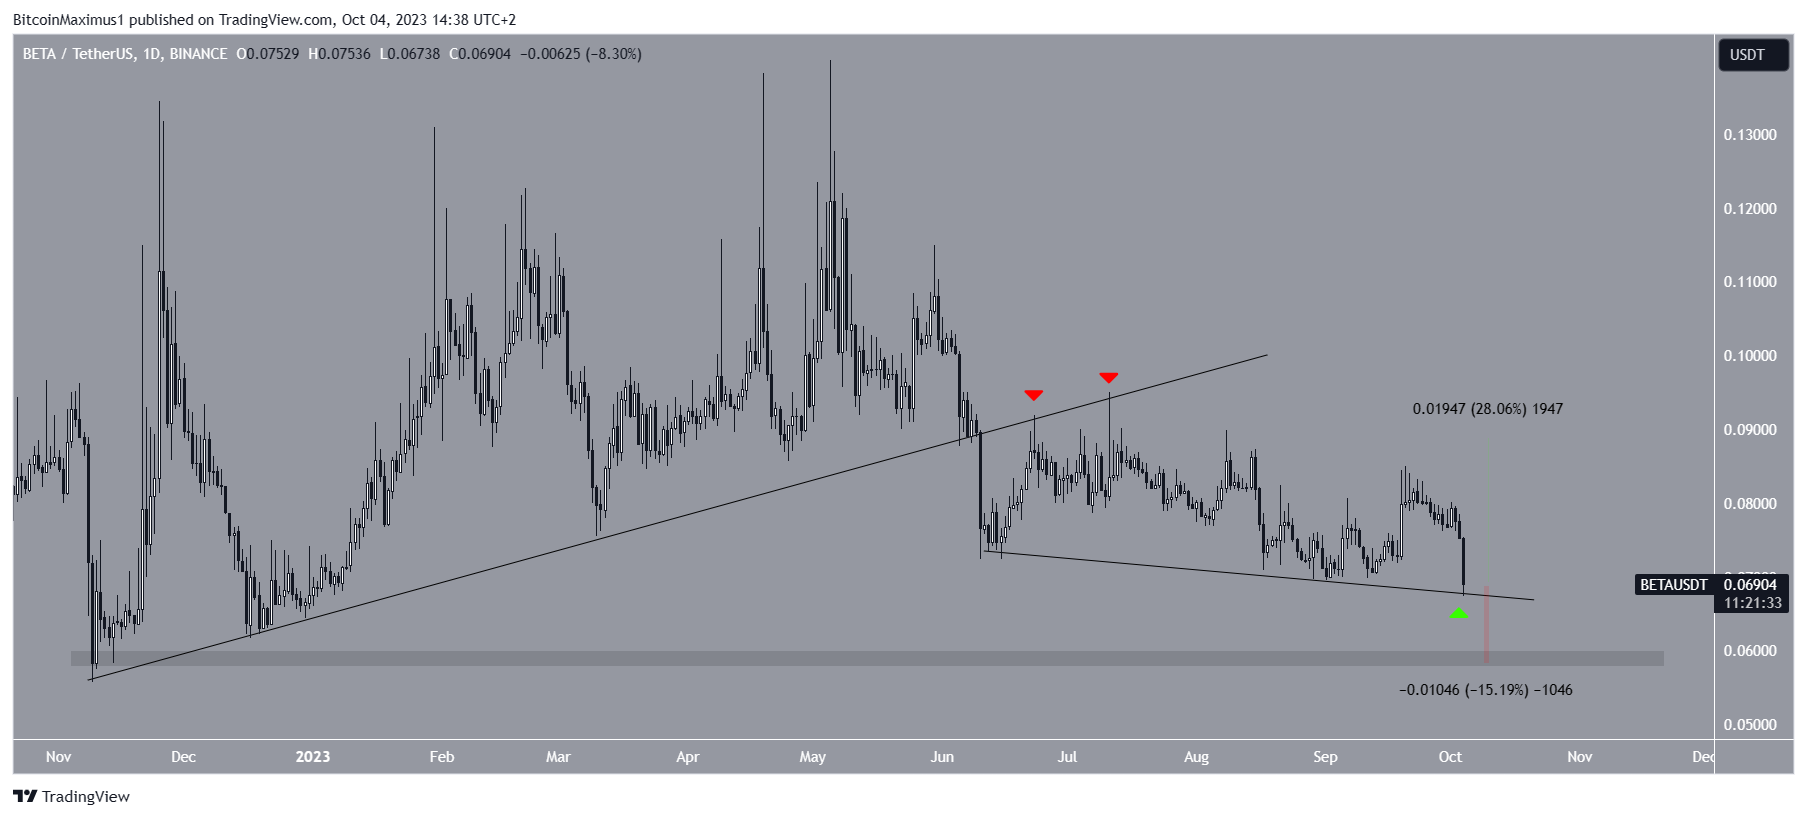
If BETA breaks down from the line, it will likely decrease by another 15% and reach the $0.058 horizontal support area.
This would constitute a new yearly low. On the other hand, a bounce can cause a 28% increase to the next closest resistance at $0.089.
BOND Could Fall to All-Time Low
The BOND price has fallen under a descending resistance trendline since January 22. The line has caused numerous rejections so far, the most recent on October 1 (red icon). The cryptocurrency has fallen since the rejection.
Read More: 9 Best Crypto Demo Accounts For Trading
The daily RSI supports the ongoing decrease. Market traders use the RSI as a momentum indicator to identify overbought or oversold conditions and to decide whether to accumulate or sell an asset.
Readings above 50 and an upward trend indicate that bulls still have an advantage, whereas readings below 50 suggest the opposite.
The RSI was rejected by 50 (red circle), while the descending resistance trendline rejected the price. This supports the legitimacy of the downward movement.
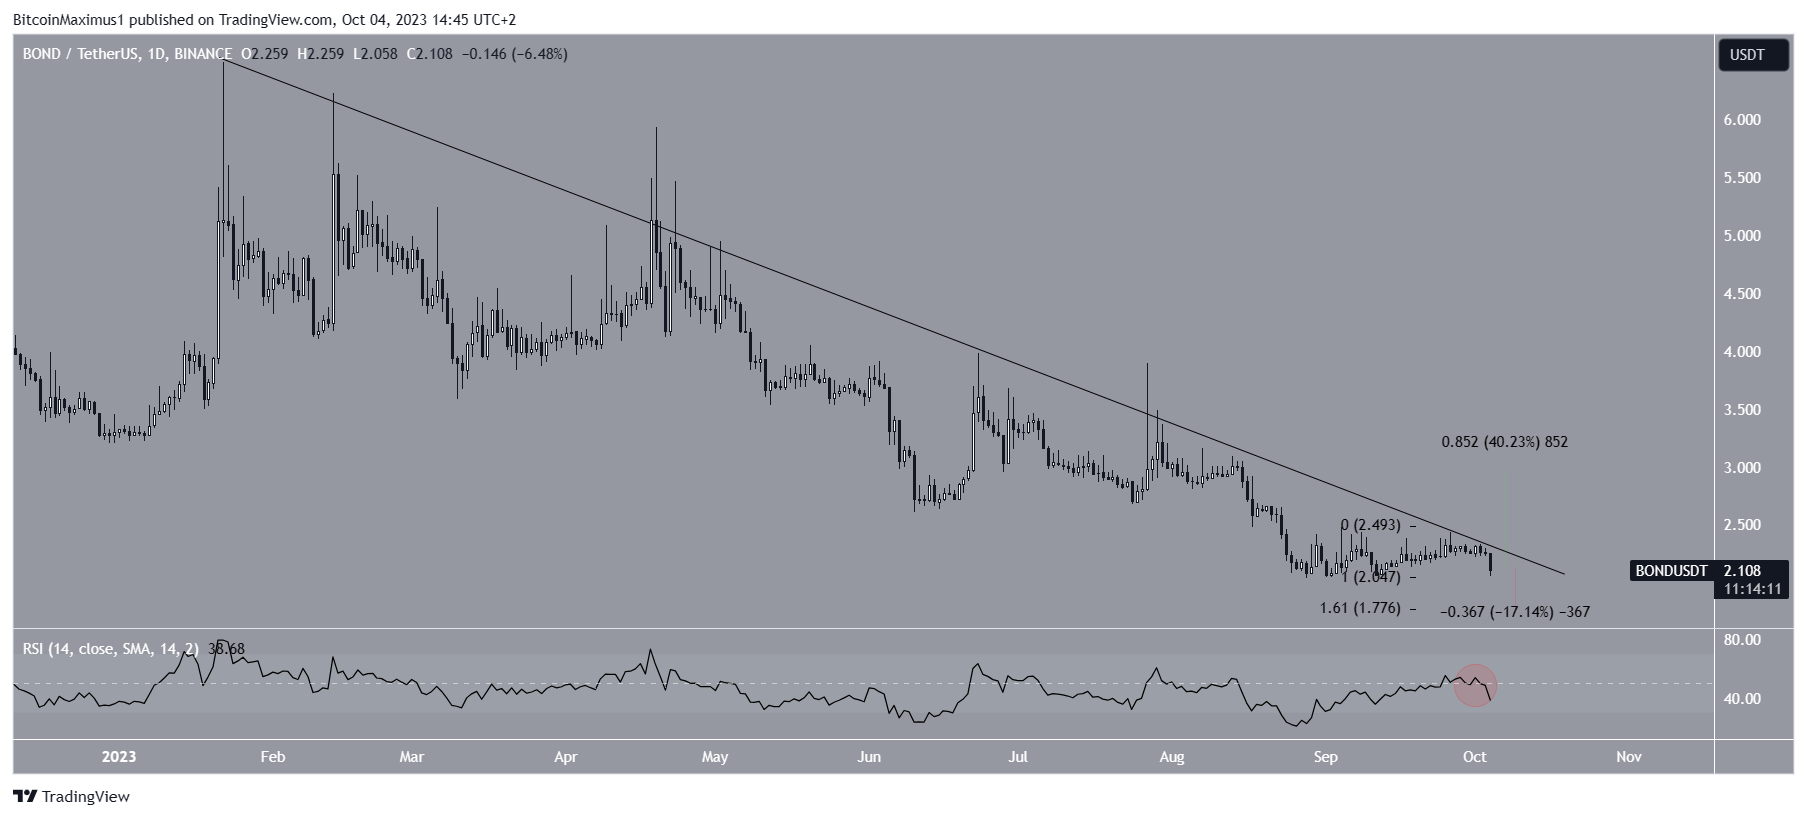
If the price continues to fall, the next support will be at $1.78, found by the 1.61 external Fib retracement of the most recent bounce. This would be a new all-time low price and would constitute a drop of 17%.
Despite this bearish BOND price prediction, a breakout from the descending resistance trendline will mean that a significant reversal has begun. BOND could increase by 40% to the next resistance at $3 in that case.
WTC Suffers Another Rejection
The WTC price has fallen under a descending resistance trendline since February 2023. The line has caused numerous rejections, most recently on September 23 and October 3 (red icons). Both created long upper wicks, indicating that sellers have taken over.
If the rejection continues, the WTC price will fall to the closest support at $0.140. This is a decrease of 12%, measuring from the current price.
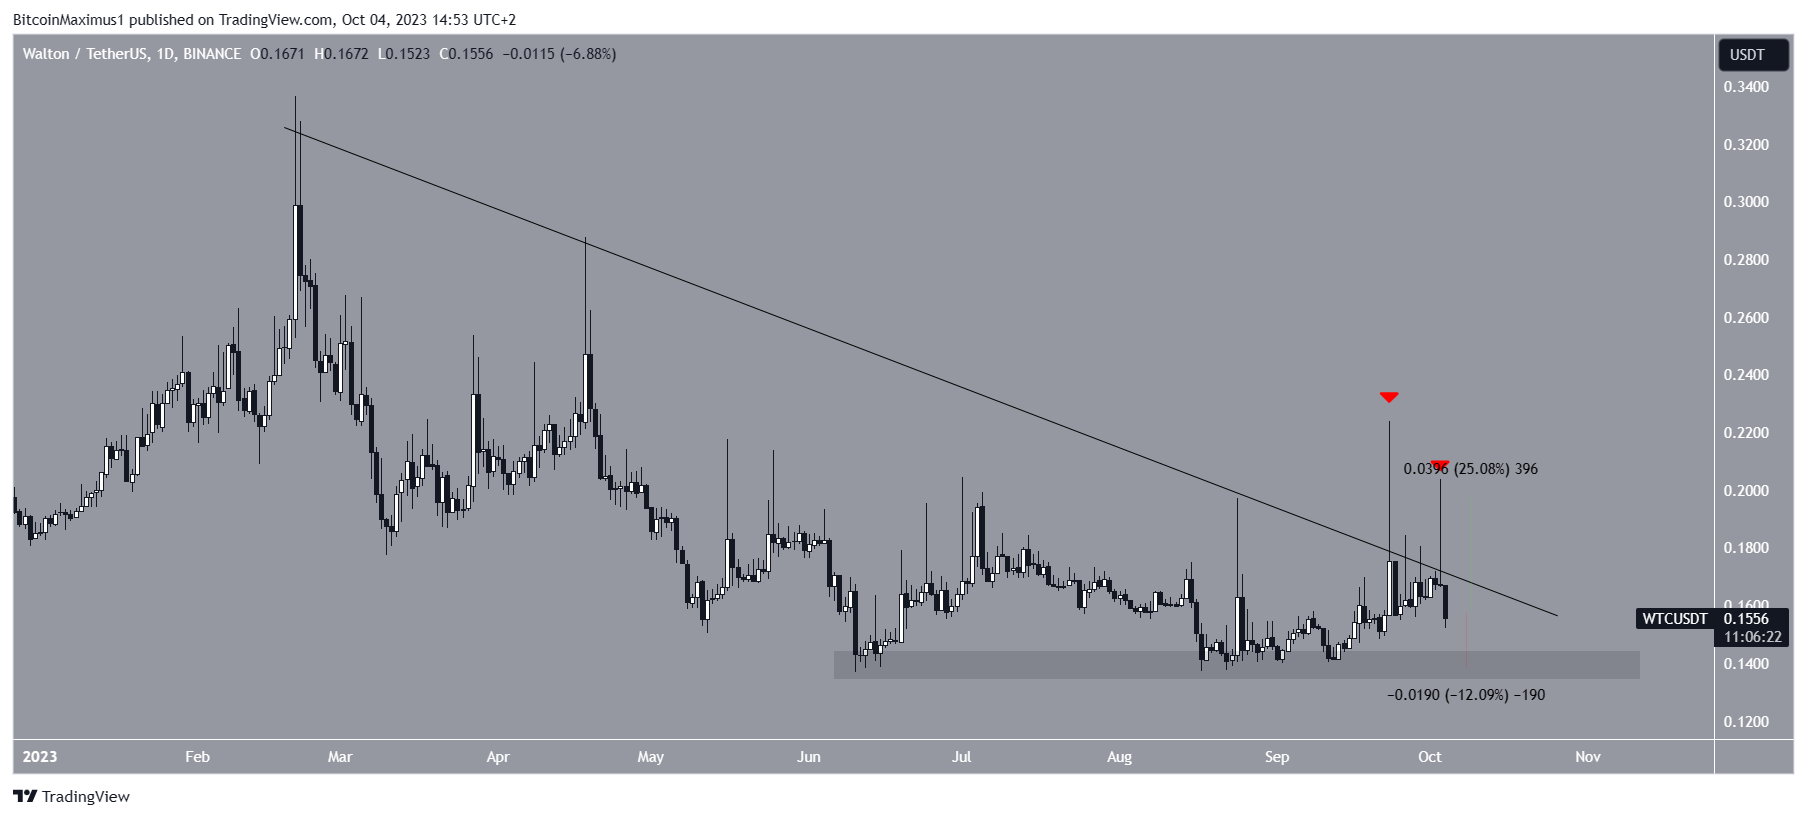
On the other hand, a sudden breakout from the resistance trendline could cause a 25% bounce, taking the price to the $0.200 resistance area.
XEM Price Trades in Bearish Pattern
The final token at risk of being delisted from the Binance platform is NEM (XEM). The XEM price has fallen under a descending resistance trendline since the beginning of June.
More recently, the line caused a rejection on October 2 (red icon) and initiated the current downward movement.
XEM trades above the $0.022 horizontal support area, which has been in place since June. The trendline and the support area create a descending triangle, considered a bearish pattern.
Since the triangle is a bearish pattern, a breakdown from it is the most likely future price outlook.
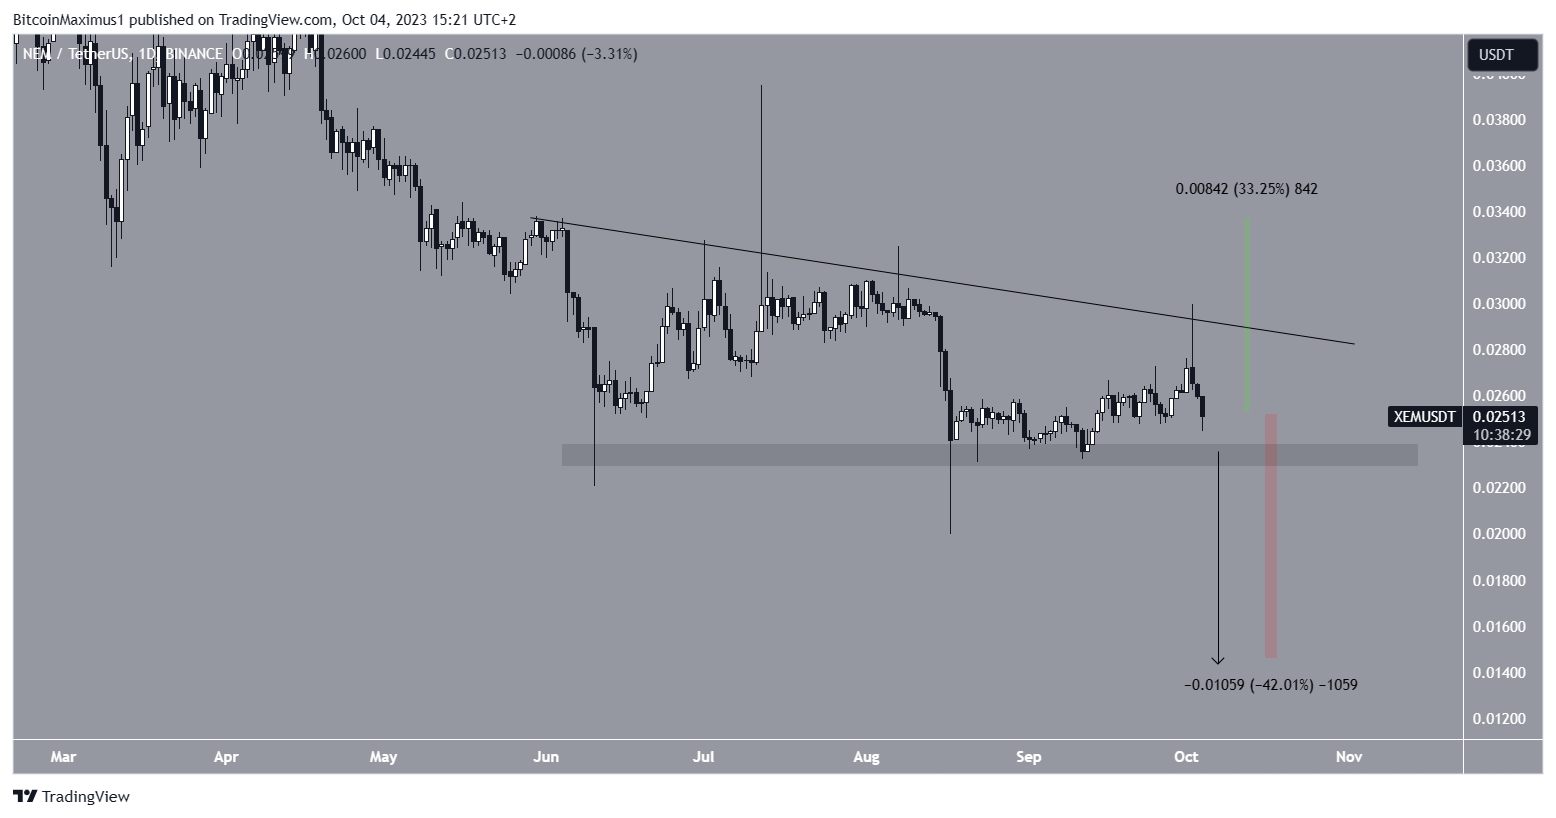
A breakdown that travels the entire triangle’s height could cause a 42% drop and take XEM to $0.014.
On the other hand, a sudden reversal and breakout from the resistance trendline could cause a 33% increase to $0.033.
Read More: Best Upcoming Airdrops in 2023
For BeInCrypto’s latest crypto market analysis, click here.


