


The Tezos (XTZ) price has created a long-term bullish pattern inside a crucial horizontal support area. While the pattern is intact, it has not been confirmed by the short-term movement yet.
The Tezos blockchain implemented its fourteenth upgrade, known as “Nairobi,” on Monday. This upgrade brings several improvements, including a significant boost in transaction speeds, which can now be up to eight times faster.
Before the Nairobi upgrade, the blockchain was capable of processing up to 1 million transactions per second (tps) following the previous upgrade called “Mumbai” in March.
The developers also introduced a new fee mechanism in Nairobi that charges users based on their network usage, moving away from the previous approach of applying a uniform flat fee for all transactions in earlier versions of the blockchain.
Additionally, the Nairobi upgrade on Tezos enables continuous and automatic upgrades for Tezos’ Smart Rollups, which is a scaling tool that facilitates even faster network usage.
This means that as newer upgrades are deployed on Tezos in the future, Smart Rollups will be able to undergo seamless and automatic enhancements to keep up with the evolving capabilities of the blockchain.
Read More: Best Crypto Sign-Up Bonuses in 2023
Tezos Price Fails to Take Off Despite Upgrade
Even though the XTZ price did not increase this week in response to the Nairobi upgrade, the price movement from the weekly time frame still looks bullish. While XTZ fell to a new yearly low of $0.65 on June 10, it immediately bounced back.
This created a long lower wick (green icon). This is a bullish sign since it means that the alleged breakdown was not legitimate.
The bounce validated the $0.70 area as support and led to a bullish candlestick last week.
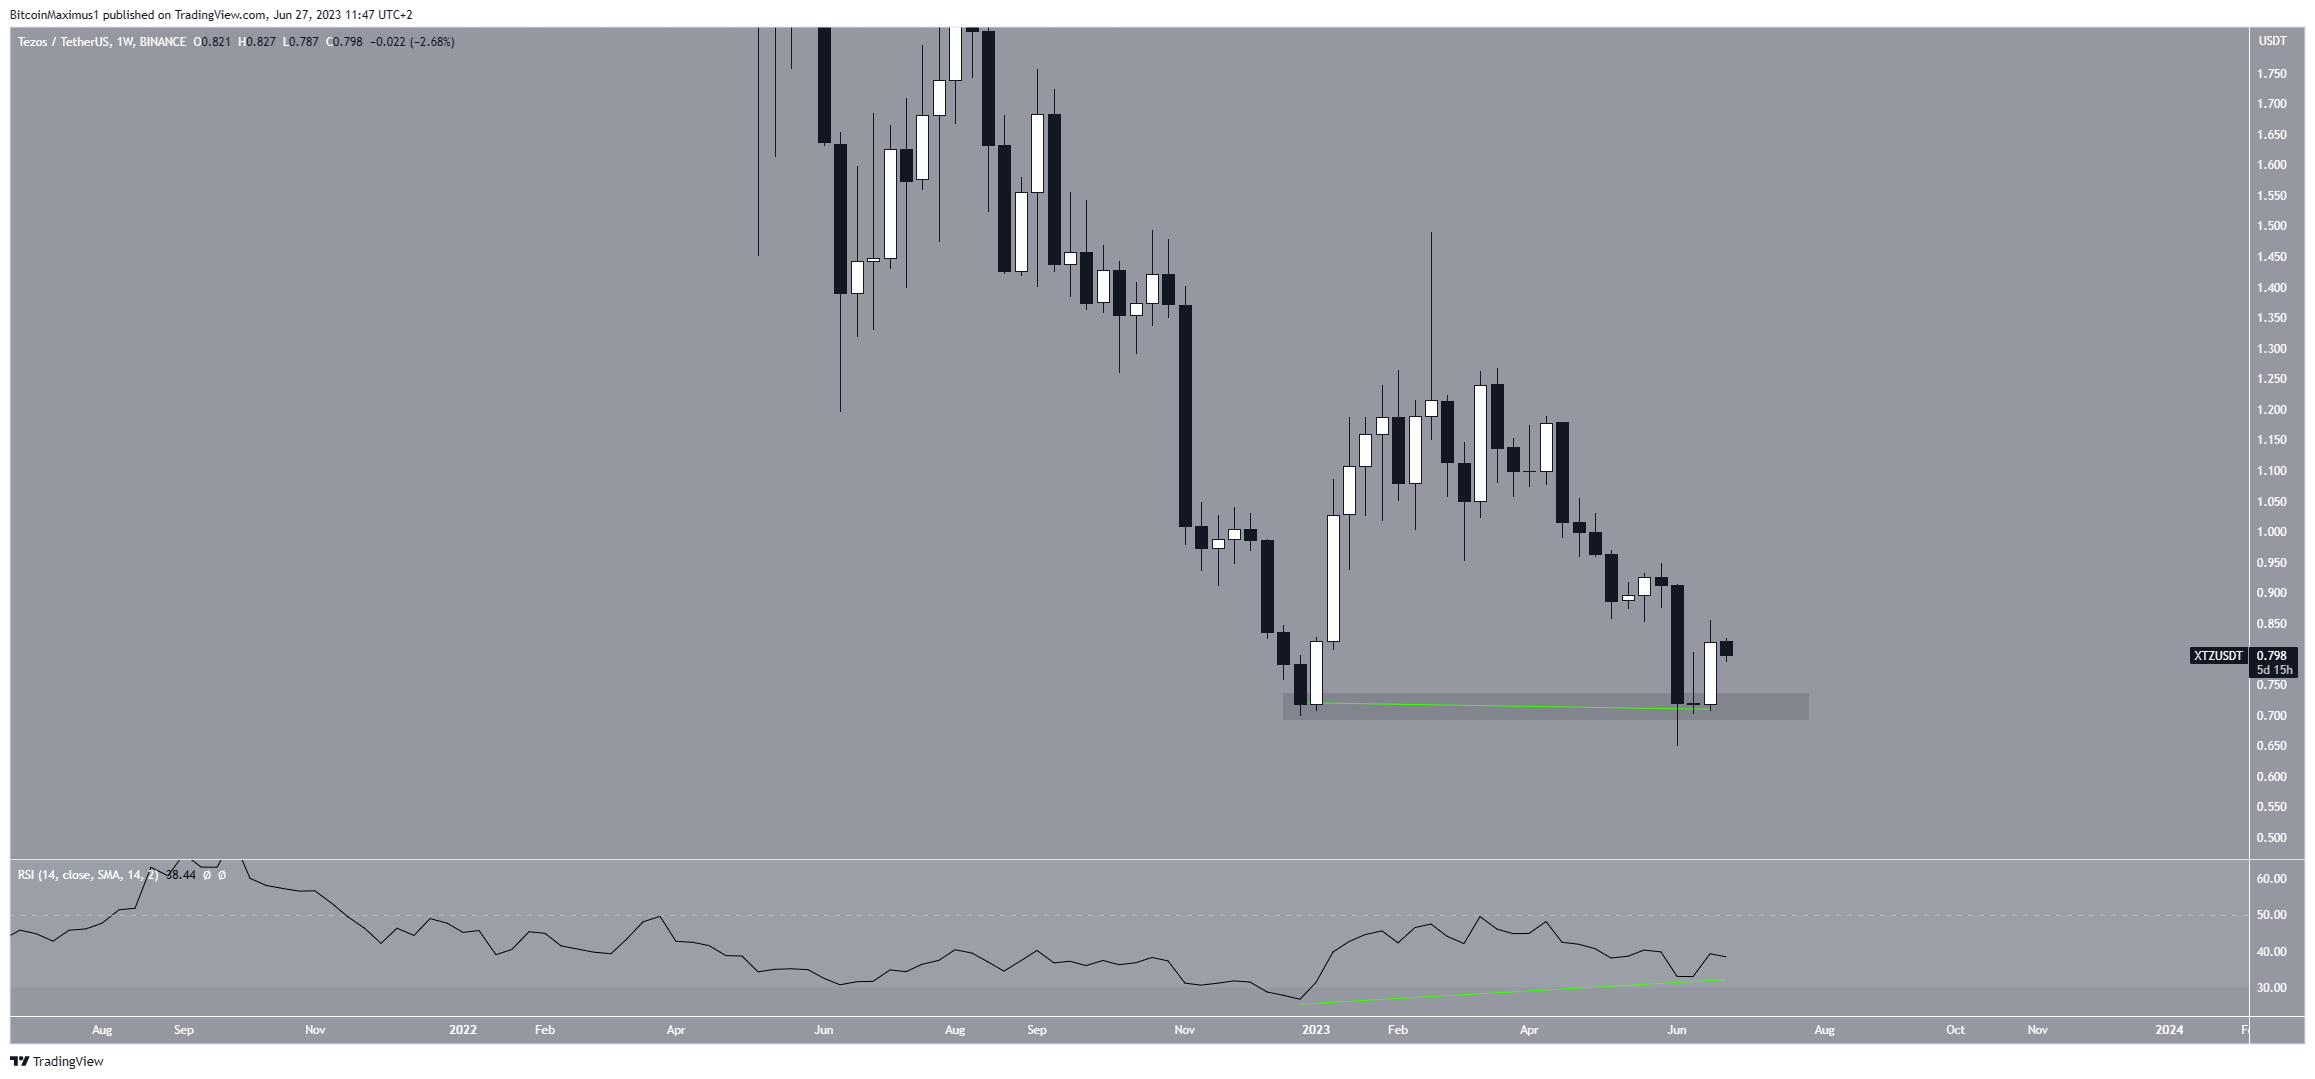
Moreover, the weekly RSI is bullish. With the RSI as a momentum indicator, traders can determine whether a market is overbought or oversold and decide whether to accumulate or sell an asset. Bulls have an advantage if the RSI reading is above 50 and the trend is upward, but if the reading is below 50, the opposite is true.
While the RSI is still below 50, it has generated considerable bullish divergence. This is a bullish occurrence in which a momentum increase accompanies a price decrease.
It fits perfectly with the failed breakdown, increasing the possibility for a bullish trend reversal.
Read More: Best Upcoming Airdrops in 2023
XTZ Price Attempts Crucial Breakout
While the weekly time frame analysis is decisively bullish, the daily time frame is still unclear. There are several reasons for this.
Mainly, the XTZ price trades below a descending resistance line for 125 days. Since the line has been in place for such a long time, the trend can be considered bearish as long as the XTZ price trades below it.
Secondly, while the RSI is increasing, it is still below 50. The 50 line often acts as resistance during upward movements, as is the case here.
So, whether the XTZ price breaks out from the line or gets rejected will likely determine the future XTZ price trend. A successful breakout will likely take the price to the next resistance at $1.15. This would also confirm the long-term double-bottom pattern.
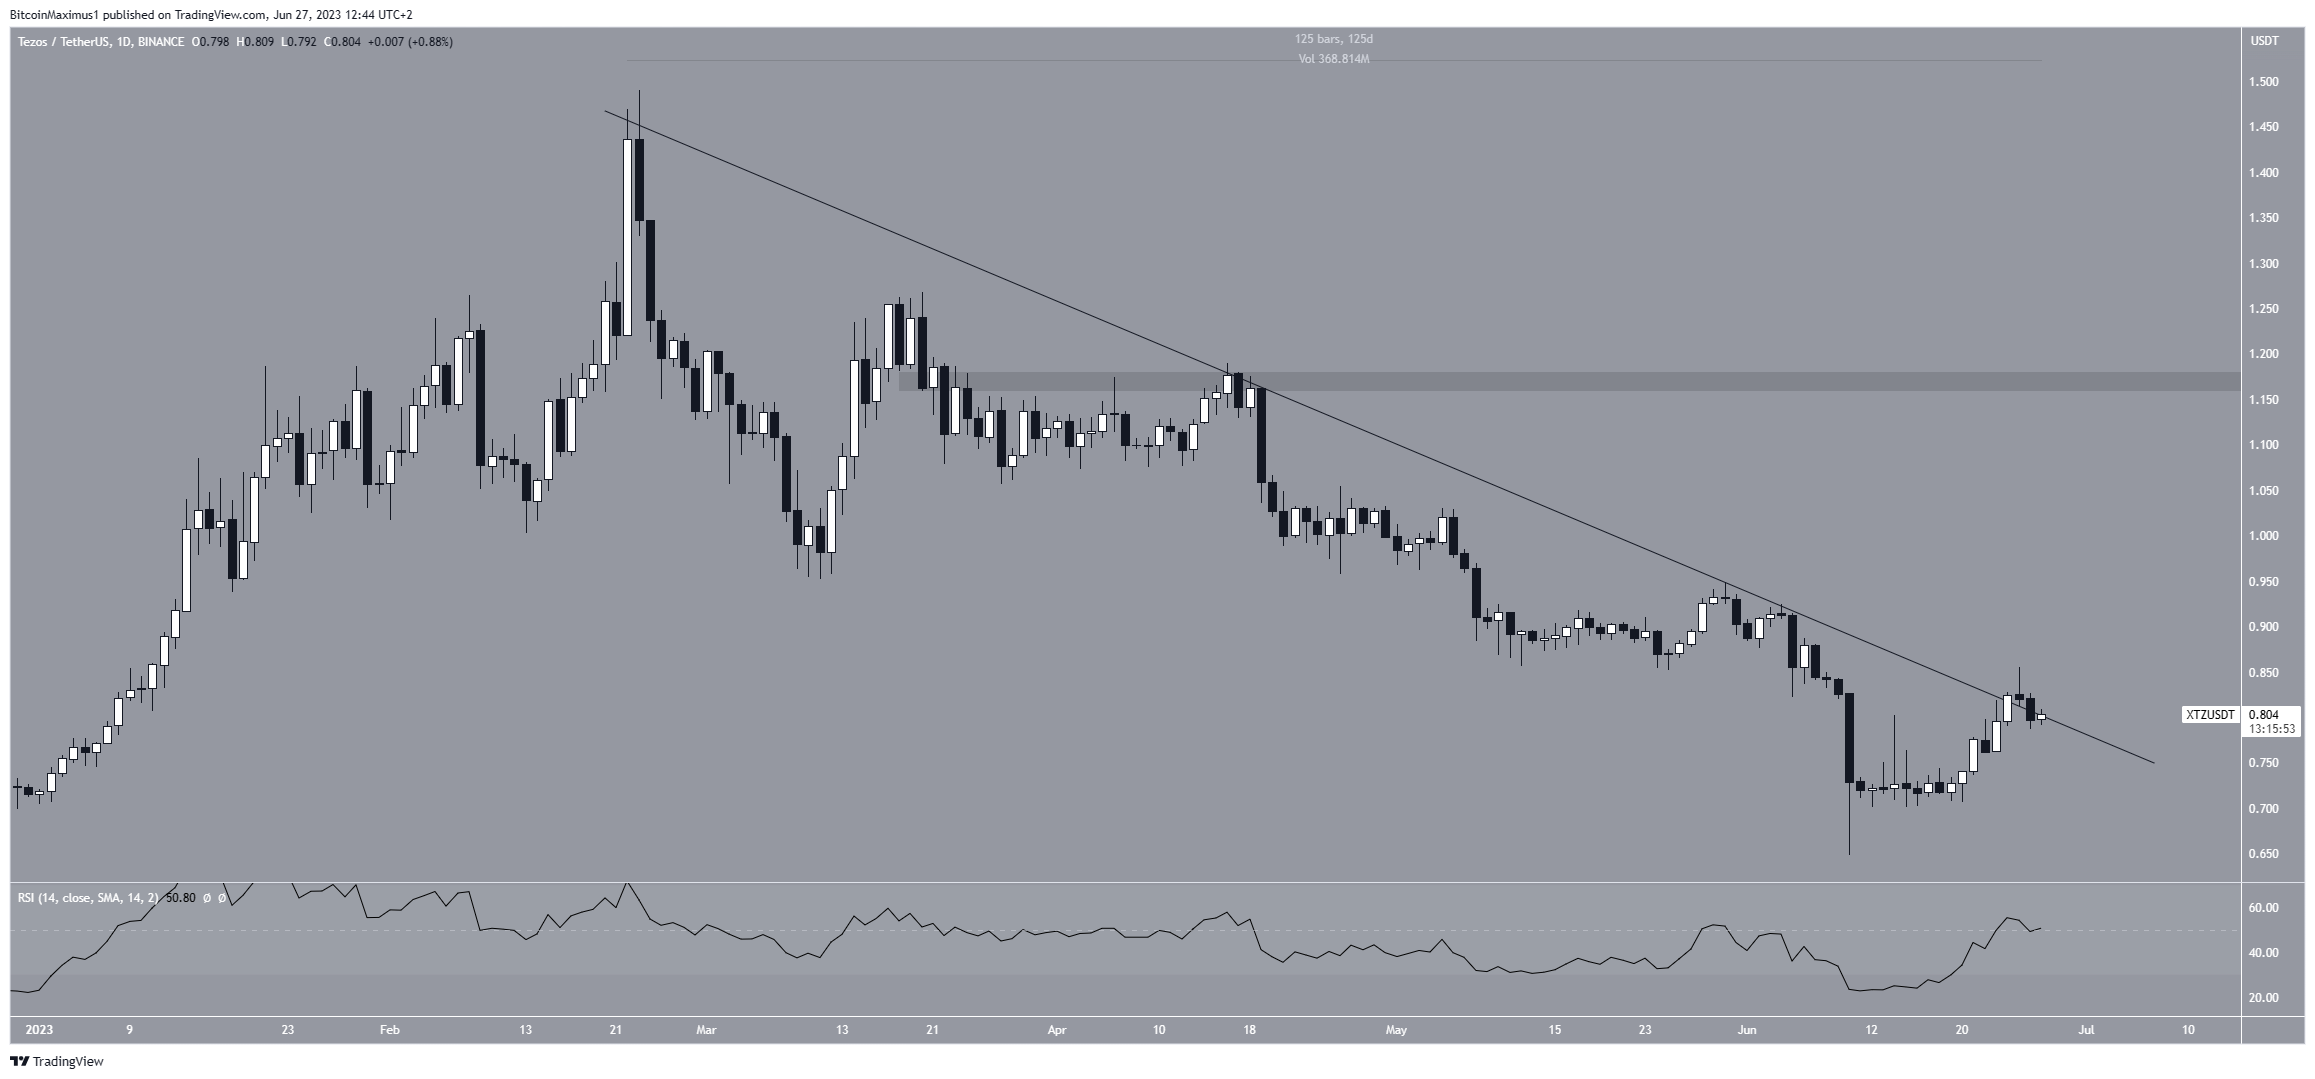
However, if the XTZ price gets rejected from the line instead, it could drop to a new yearly low.
This would invalidate the long-term double-bottom pattern and could lead to a decrease to $0.50.
More From BeInCrypto: 9 Best AI Crypto Trading Bots to Maximize Your Profits


