


Stellar’s (XLM) price has increased since a significant bounce on August 17, which created a long lower wick.
The price is trading at a confluence of resistance levels. Whether it breaks out or gets rejected can determine the future trend.
Stellar Bounce Validates $0.105 Area
The weekly time frame technical analysis shows that the XLM price broke out from a 616-day resistance line at the beginning of the year. The breakout from such a long-term structure indicates the previous movement is complete. Therefore, the breakout was expected to catalyze a long-term bullish trend reversal.
Initially, XLM struggled to move above the $0.105 horizontal area. However, it eventually broke out in July, reaching a new yearly high of $0.195. The high was slightly below the $0.23 horizontal resistance area.
However, Stellar lumens has fallen since its yearly high. The same week, it created a long upper wick (red icon), considered a sign of selling pressure. The decrease led to a low of $0.105 last week, validating the $0.105 area as support. This created a long lower wick (green icon), considered a sign of buying pressure.
If the bounce continues, the XLM price can increase by 86% and reach the $0.23 area again. On the other hand, if the rally loses momentum, the price can fall by 43% to the $0.105 area.
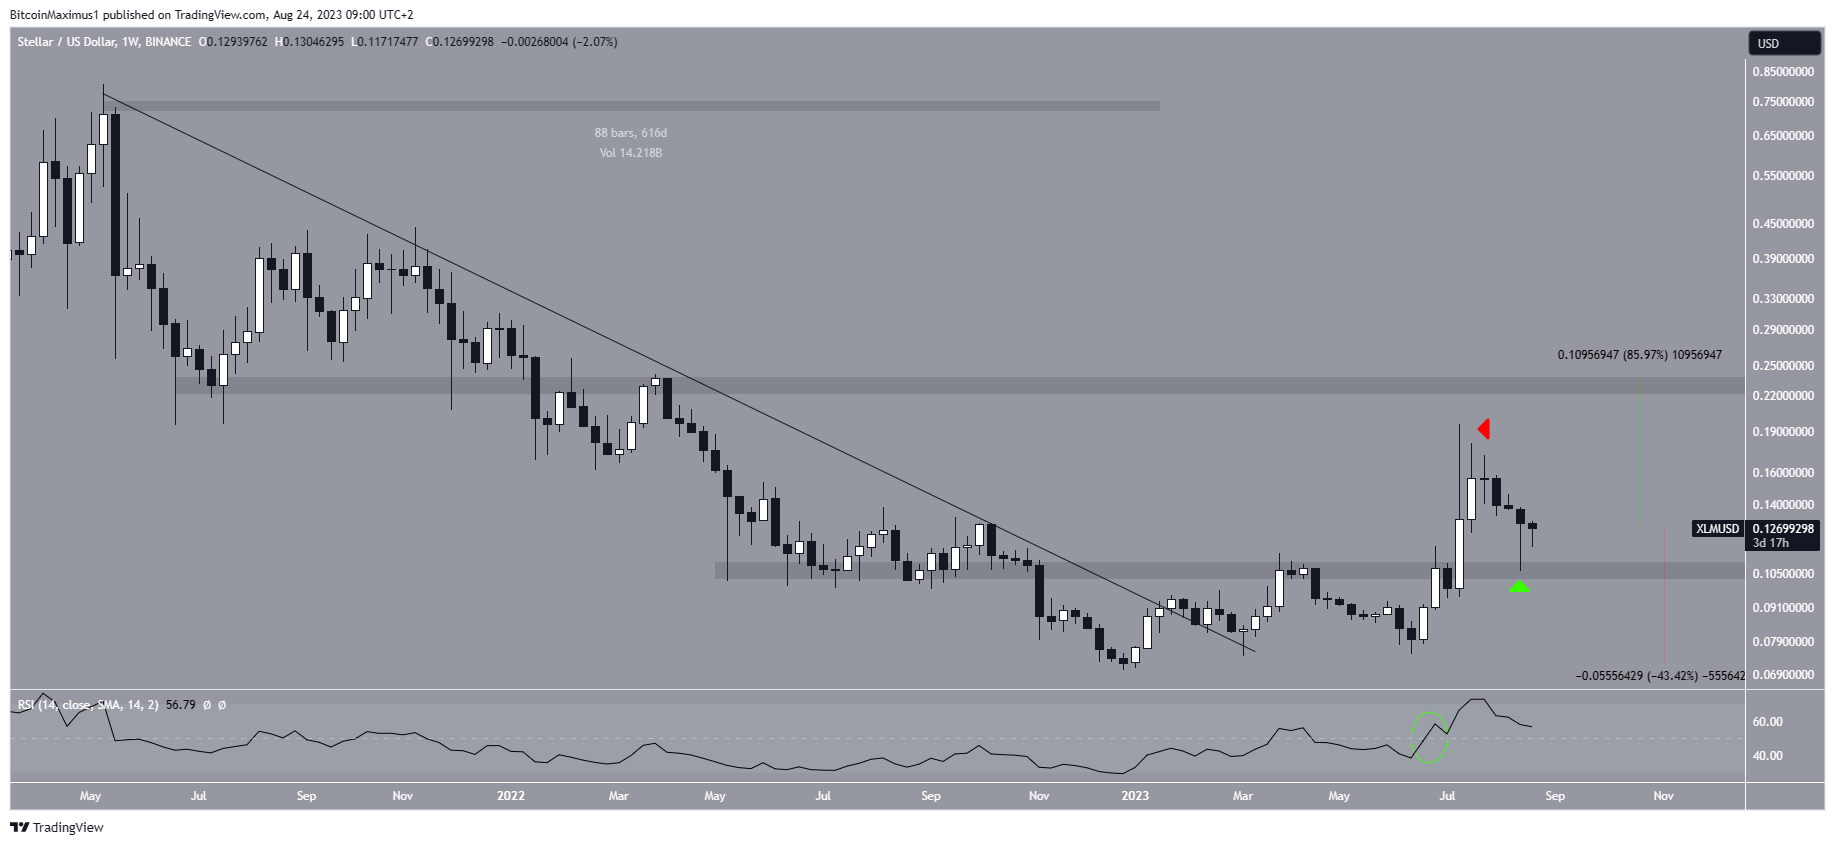
The weekly Relative Strength Index (RSI) is undetermined. Traders utilize the RSI as a momentum indicator to assess whether a market is overbought or oversold and to determine whether to accumulate or sell an asset.
If the RSI reading is above 50 and the trend is upward, bulls still have an advantage, but if the reading is below 50, the opposite is true. While the RSI is decreasing, it is still above 50 (green circle). These mixed signs suggest that the trend is undetermined.
XLM Price Prediction: Will XLM Break Out?
The daily timeframe analysis presents an uncertain perspective for XLM’s price movement. Following a decline below a descending resistance line starting from July 13, the price reached a low of $0.105 by August 17. However, a subsequent recovery confirmed the minor support zone around $0.110.
Despite this rebound, XLM was unable to surpass the descending resistance line. Instead, it faced resistance from the line and the horizontal resistance area at $0.130 (red circle).
The presence of these multiple resistance levels highlights the significance of a potential breakout from the descending resistance line to confirm a bullish trend.
Looking at the daily RSI, there are mixed signals. The indicator is on the rise but remains below 50, also staying under a descending resistance line. Much like the price action, the RSI’s breakout or rejection will be crucial in gauging the future trend.
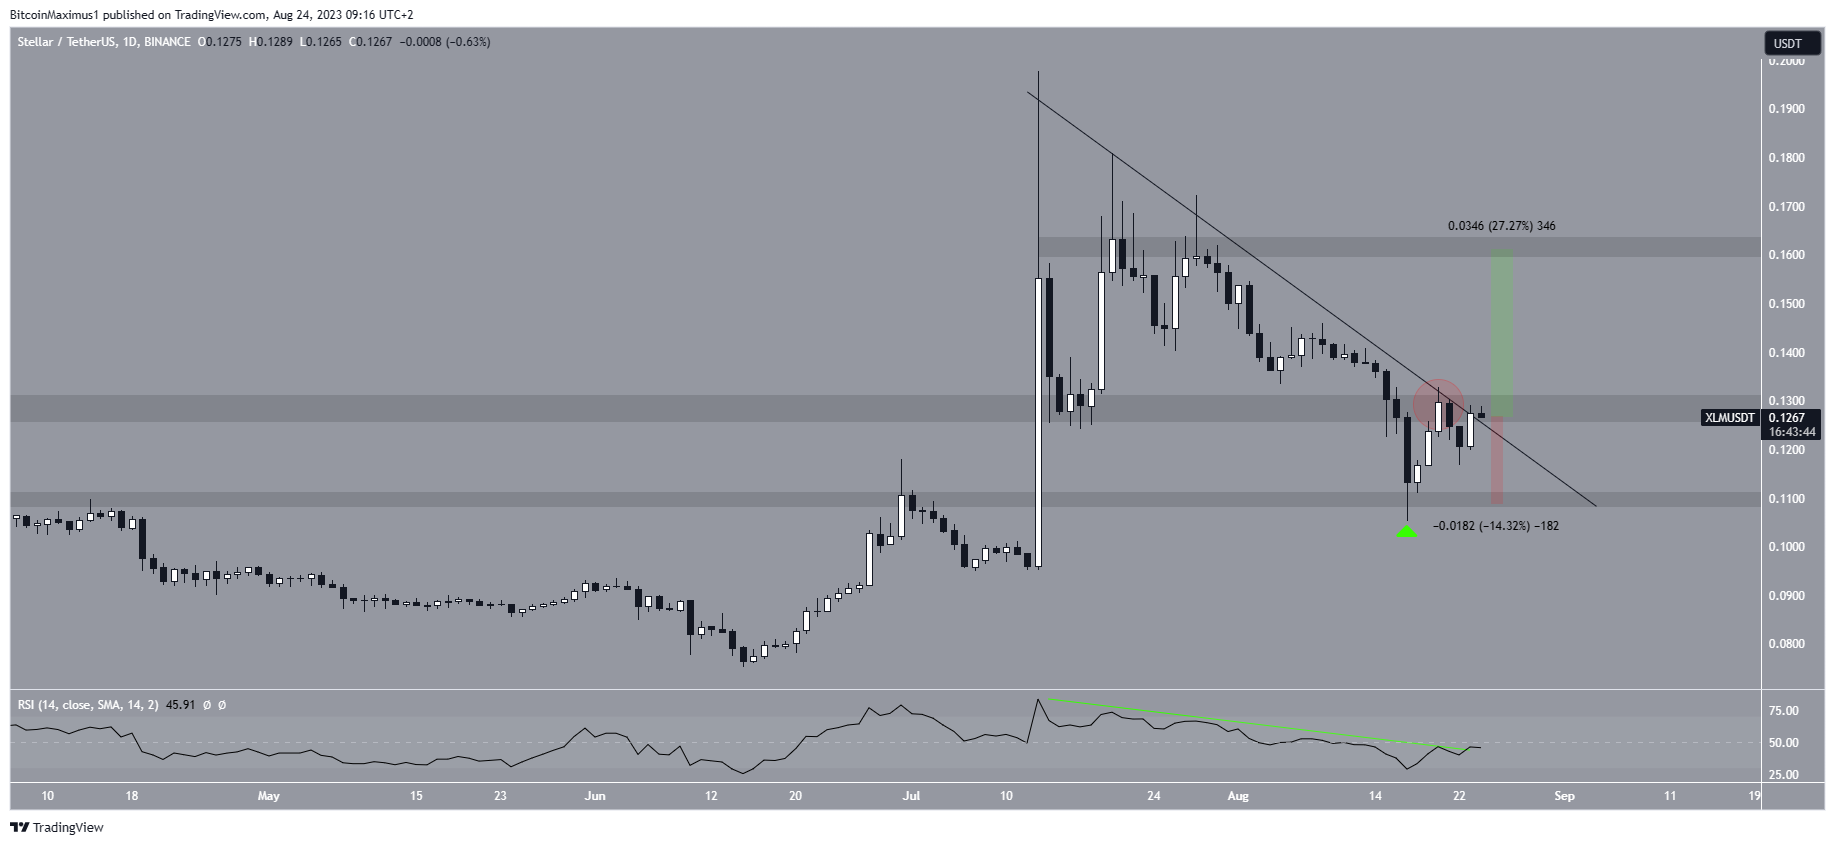
To sum up, the future of XLM‘s price hinges on whether it can breach the resistance line or if the rejection continues. A successful breakout could lead to a 27% upswing toward the $0.160 resistance, while a rejection may result in a 14% decline to $0.110.
Interested in AI Trading? 9 Best AI Crypto Trading Bots to Maximize Your Profits
For BeInCrypto’s latest crypto market analysis, click here.


