

Stellar’s (XLM) price fell sharply last week but bounced on August 17. This created a long lower wick and caused a 25% increase.
The bounce validated the $0.105 area, which is crucial for determining the future trend’s direction.
Stellar Crash Ends With a Bounce
The XLM price analysis on a weekly time frame shows that the price broke out from a 616-day resistance line in January. Breakouts from such long-term structures indicate that the previous correction is complete. Thus, a new movement is expected to begin in the other direction.
Despite first struggling to move above the $0.105 area, XLM broke out in July and reached a new yearly high of $0.195. However, Stellar Lumens has fallen since. Last week, it crashed back to the $0.105 area, creating a long lower wick and bouncing.
The wick is considered a sign of buying pressure and also served to validate the $0.105 area as support. XLM recovered better than the rest of the crypto market, which experienced significant short-term losses.
If the bounce continues, the next resistance will be at $0.23, 87% above the current price. On the other hand, a breakdown from the $0.105 area can cause a 41% drop to the yearly lows near $0.080.
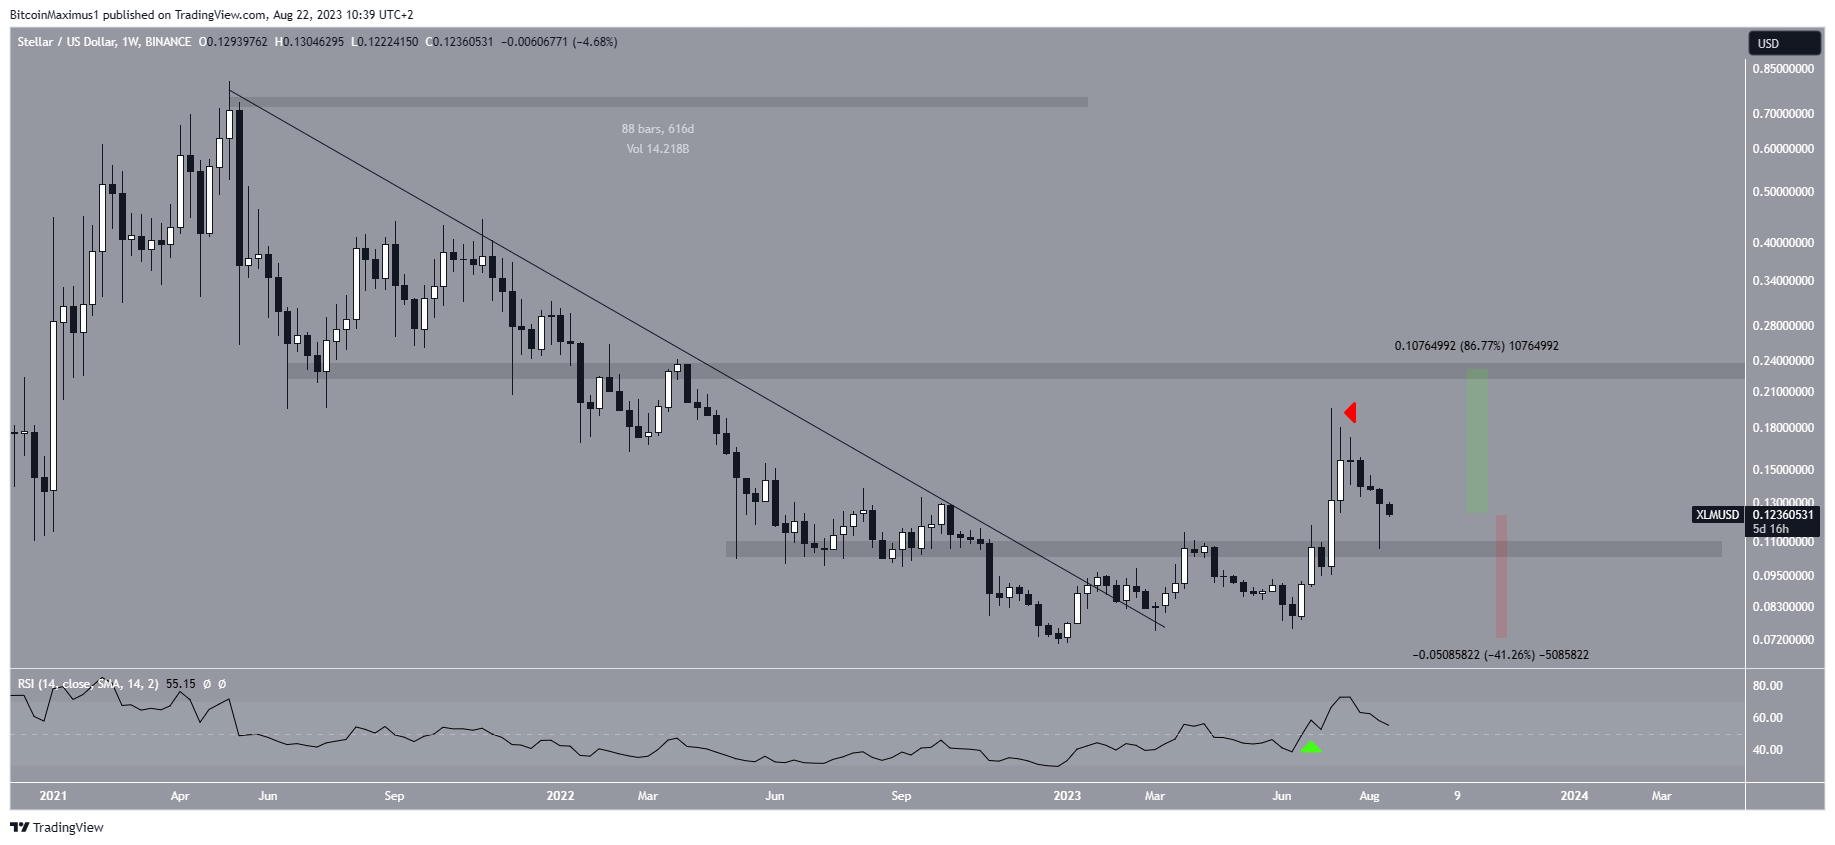
The weekly Relative Strength Index (RSI) is undetermined. Traders utilize the RSI as a momentum indicator to assess whether a market is overbought or oversold and to determine whether to accumulate or sell an asset.
If the RSI reading is above 50 and the trend is upward, bulls still have an advantage, but if the reading is below 50, the opposite is true. While the RSI is falling, it is still above 50. These conflicting signs fail to confirm the trend’s direction.
Stellar Price Prediction: Reclaim or Rejection?
The daily timeframe analysis provides an undetermined outlook. The price has fallen below a descending resistance line since July 13, leading to a low of $0.105 on August 17.
However, the price bounced afterward, validating the minor $0.110 horizontal area as support.
Despite the bounce, XLM failed to break out from the descending resistance line. On the contrary, it was rejected by the line and the $0.130 horizontal resistance area (red icon).
Due to this confluence of resistance levels, a breakout from the line is required to confirm the bullish trend.
The daily RSI provides conflicting readings. The indicator is increasing but is below 50 and below a descending resistance line. Therefore, similarly to the price action, whether the RSI breaks out or gets rejected will be crucial in identifying the future trend.
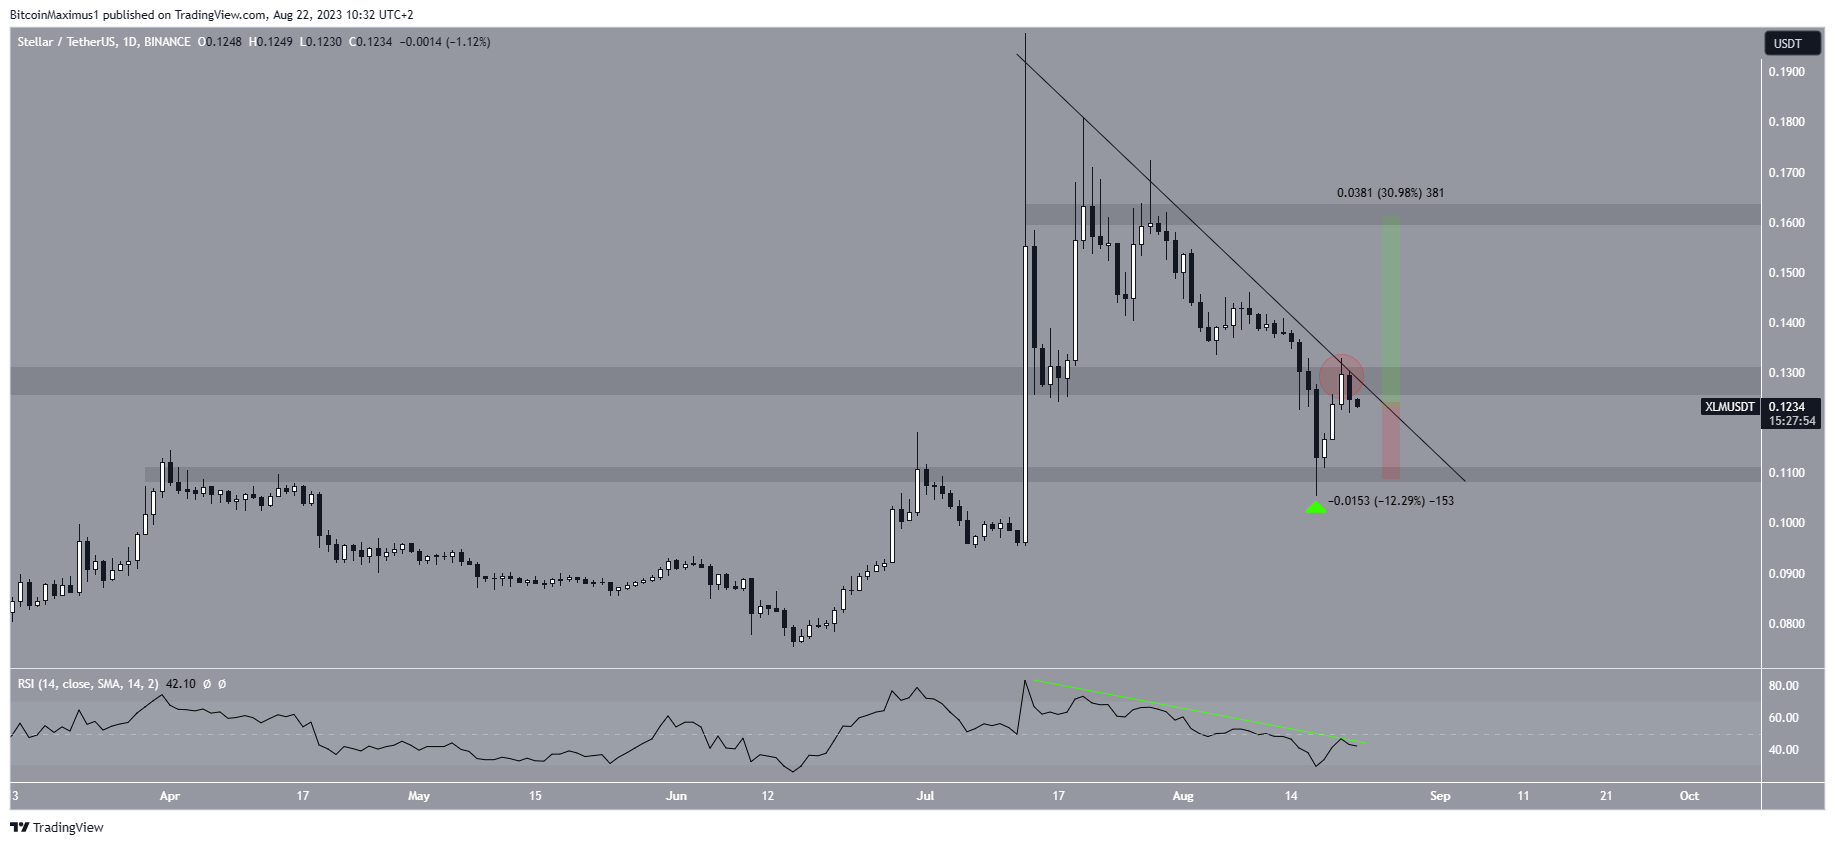
To conclude, the XLM price prediction will determine whether the price breaks out from the resistance line or continues its rejection.
A 30% increase to the $0.160 resistance will likely occur in case of a breakout, while a 12% drop to $0.110 can follow if rejection occurs.
Interested in AI Trading? 9 Best AI Crypto Trading Bots to Maximize Your Profits
For BeInCrypto’s latest crypto market analysis, click here.
Disclaimer
In line with the Trust Project guidelines, this price analysis article is for informational purposes only and should not be considered financial or investment advice. BeInCrypto is committed to accurate, unbiased reporting, but market conditions are subject to change without notice. Always conduct your own research and consult with a professional before making any financial decisions. Please note that our Terms and Conditions, Privacy Policy, and Disclaimers have been updated.
