


Stellar’s (XLM) price is trading in the middle of a long-term range, having decreased since it reached its yearly high in July.
Despite the decrease, the daily timeframe readings indicate that a breakout from the current pattern is expected. This could lead to a new yearly high.
Stellar Price Consolidates After Rejection
The weekly time frame technical analysis for XLM shows that the price broke out from a long-term descending resistance line in January. Before the breakout, the line had been in place for 616 days.
Afterward, XLM moved above the $0.105 resistance and reached a new yearly high of $0.195 in June. However, the price has fallen since, creating a long upper wick and several bearish weekly candlesticks.
The main resistance area is $0.23, while the closest long-term horizontal support is $0.105.
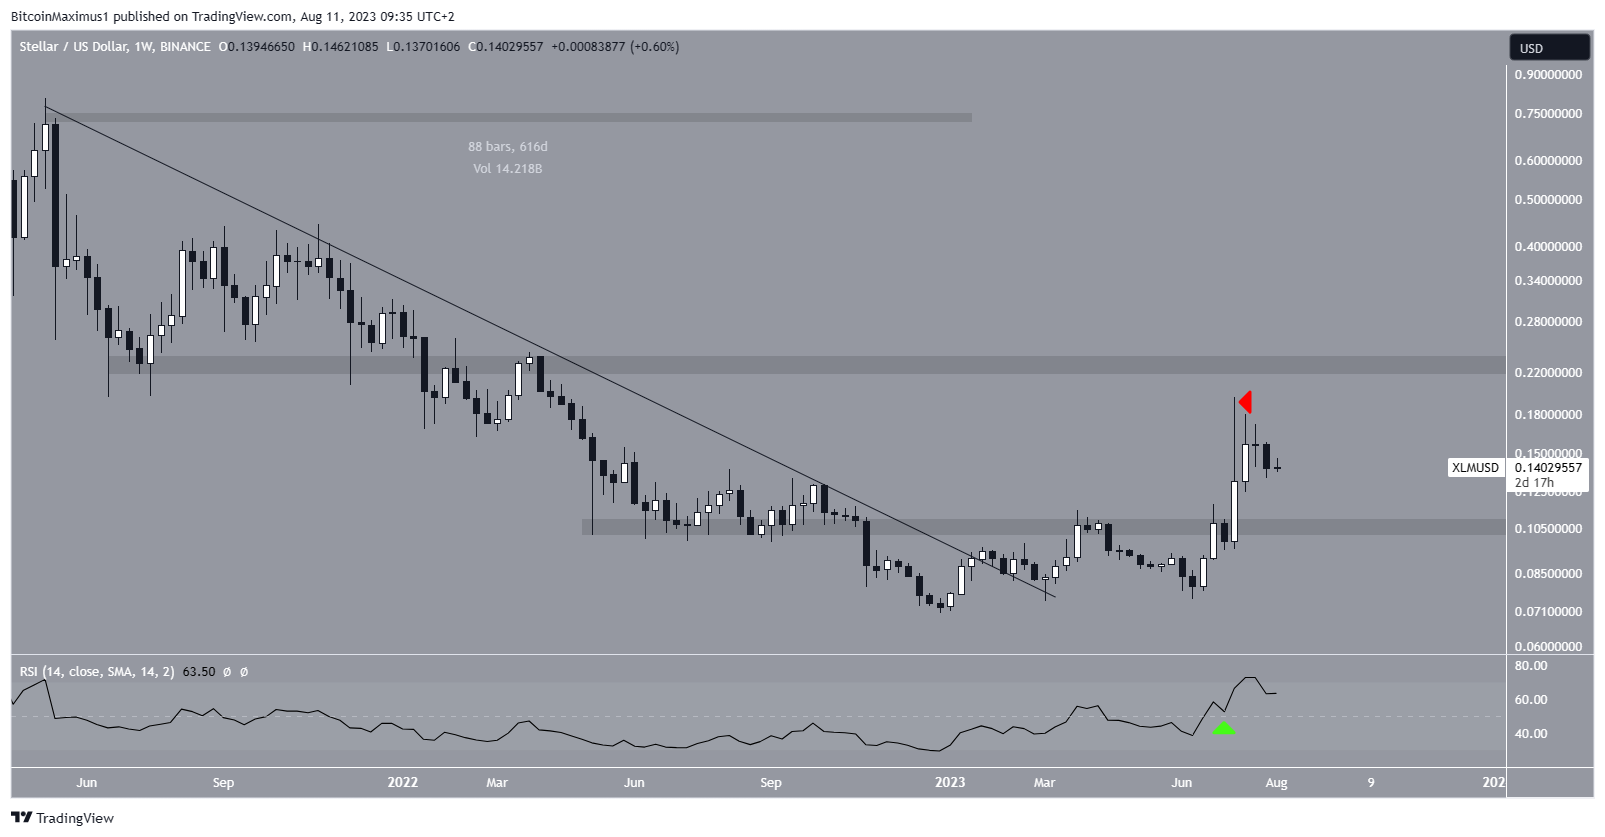
The weekly RSI gives an undetermined reading. The RSI is a momentum indicator used by traders to evaluate whether a market is overbought or oversold and to determine whether to accumulate or sell an asset.
Readings above 50 and an upward trend suggest that bulls still have an advantage, while readings below 50 indicate the opposite.
While the RSI is decreasing, it is still above 50. These conflicting signs fail to confirm the trend’s direction.
XLM Price Prediction: Has Price Reached a Bottom?
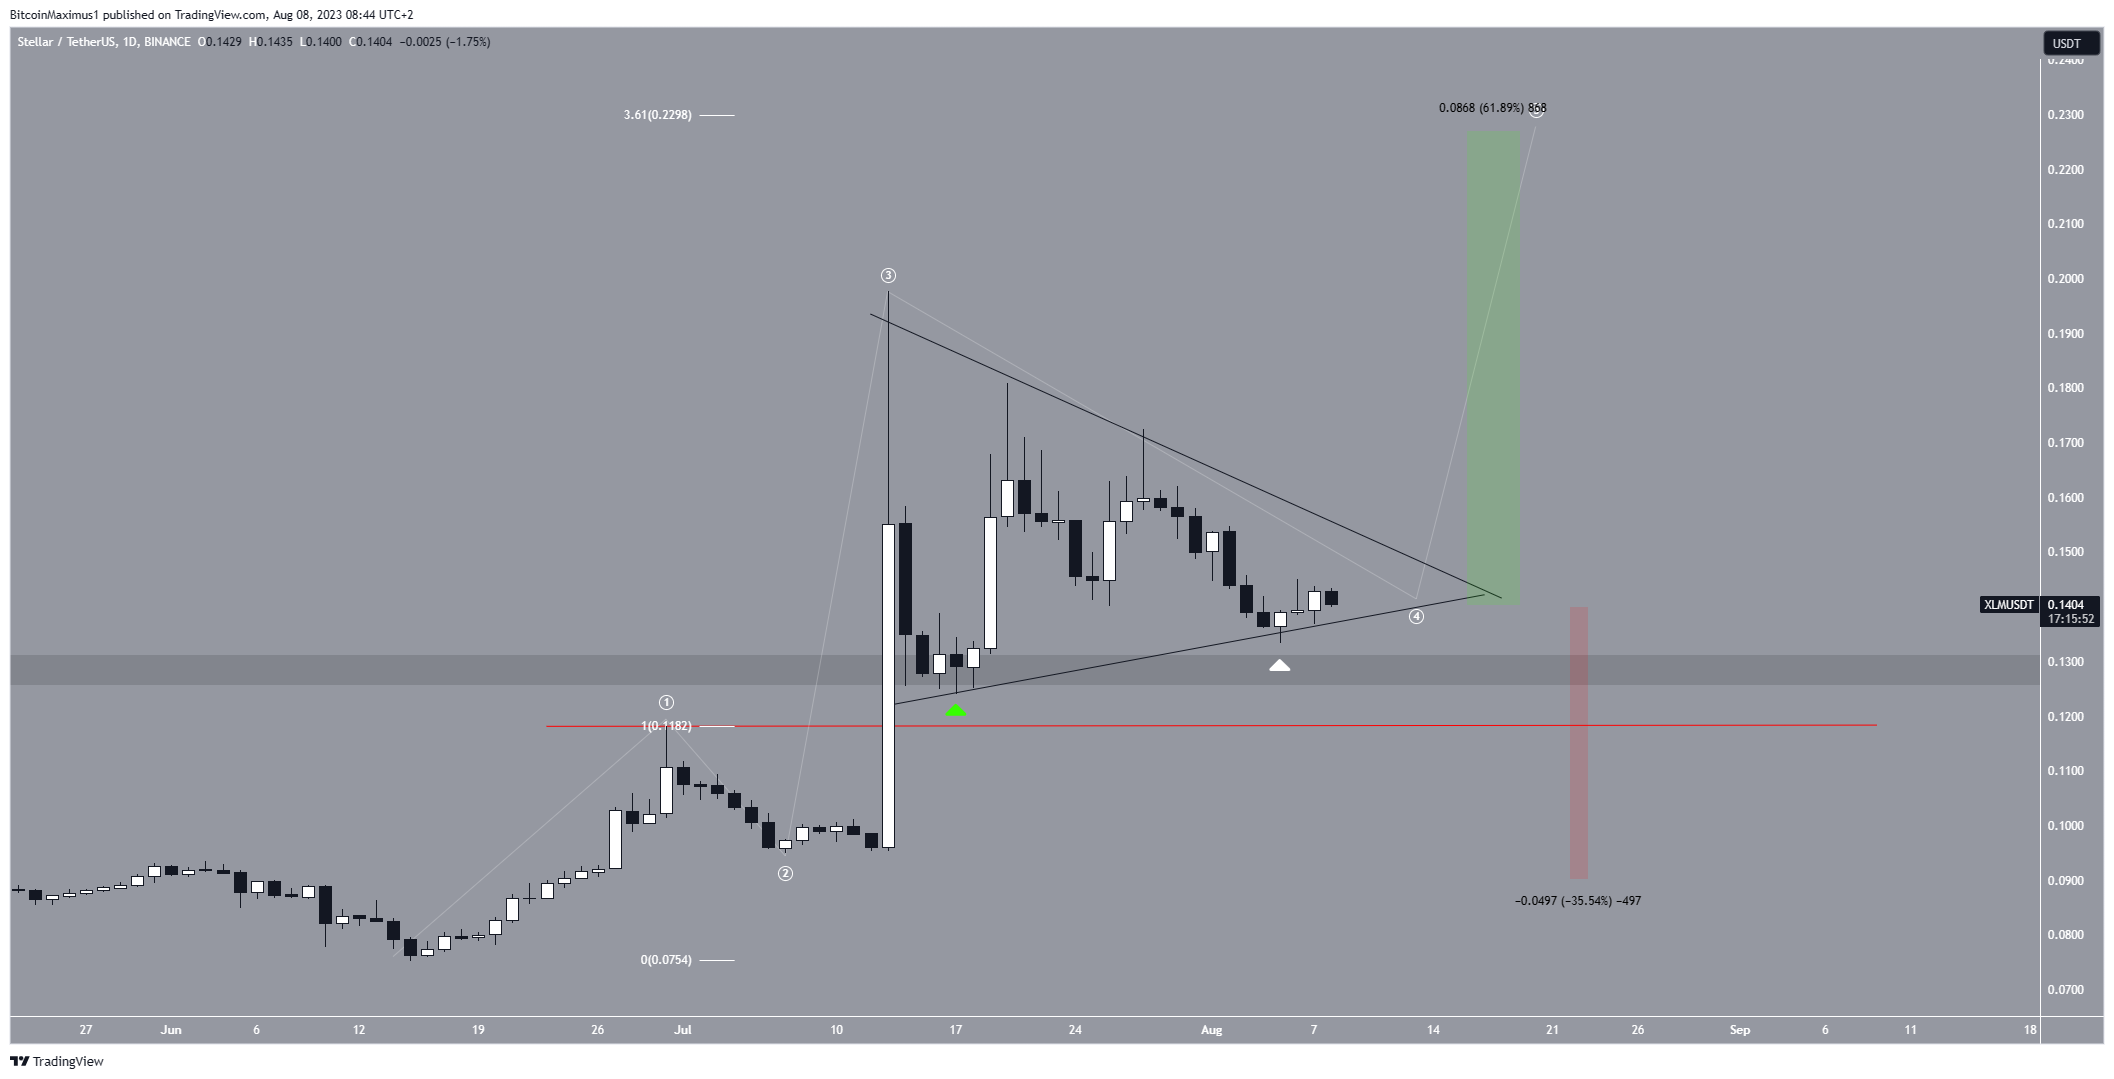
A closer look at the daily timeframe analysis gives a bullish outlook. The prediction is made using Elliot Wave Theory. The Elliott Wave theory, a tool employed by technical analysts to scrutinize long-term price trends and investor sentiment, is being utilized to predict market trends.
The wave count states that the XLM price is in the fourth wave of a five-wave increase (white). The fourth wave has taken the shape of a triangle, by far the most likely pattern for the completion of wave four. The price is approaching the end of the triangle, so a decisive movement is expected to transpire soon.
A breakout will confirm that the trend is bullish and wave five has begun. In that case, XLM could increase by 60% to the next resistance at $0.230. The target is found using the 3.61 extension of wave one.
However, if the price breaks down, it could revisit the $0.130 area again. While this would not invalidate the bullish count, a decrease below the wave one high at $0.118 would. In that case, the XLM price could fall by another 35% and reach $0.09.
To conclude, the most likely XLM price prediction is bullish. A 60% increase to the next resistance at $0.23 is expected.
However, a decrease below $0.118 will invalidate this bullish outlook and could lead to a 35% drop to $0.09.
Read More: Best Cloud Mining Sites 2023: A Beginners Guide
For BeInCrypto’s latest crypto market analysis, click here.


