


The Solana price fell by 42% last week, reaching the important and final Golden Ratio support level at $15. If this level breaks, the price could fall even further.
Currently, Solana’s price stands at the last Golden Ratio support level. Over the past week, Solana experienced a significant drop, with the price tumbling by approximately 42%.
Solana Price Is at the Last Golden Ratio Support Level
However, the cryptocurrency demonstrated resilience, managing to rally and close above the Golden Ratio support level of around $15 by the end of the same week.
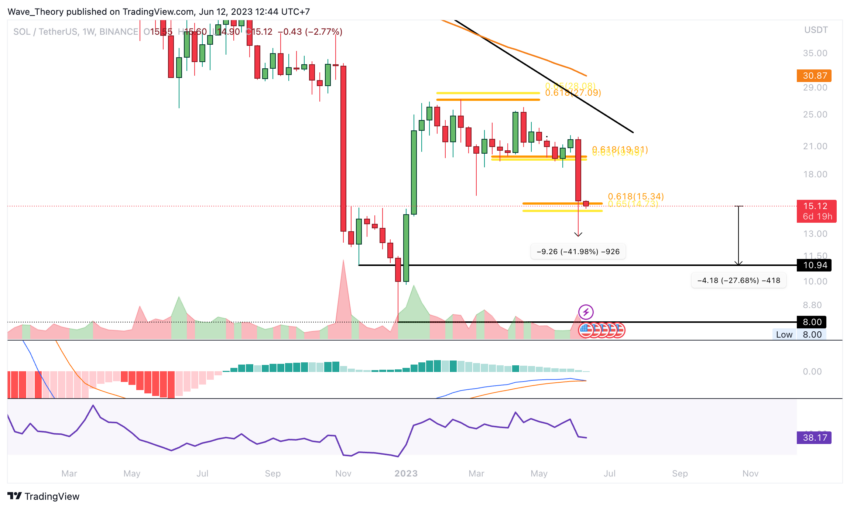
Should Solana make a comeback from this position, it will encounter the next significant Fibonacci resistance levels at approximately $16.4 and $19 respectively.
Should Solana break down further from this support, the next significant support waits between $8 and $11. This implies a downward potential of 27.7%.
Read More: 6 Best Copy Trading Platforms in 2023
Meanwhile, the MACD indicator has been ticking lower for several weeks. The MACD lines may indicate further bearish price action soon.
In general, the Solana price is showing a very bearish trend, but there’s still a chance that the Golden Ratio support level of around $15 will hold, keeping the upward movement intact.
How Low Can the SOL Price Fall?
If Solana continues its bearish trend and breaches the next support level, which stands between approximately $8 and $11, the subsequent notable support can be found in the region of $3.84 to $5.
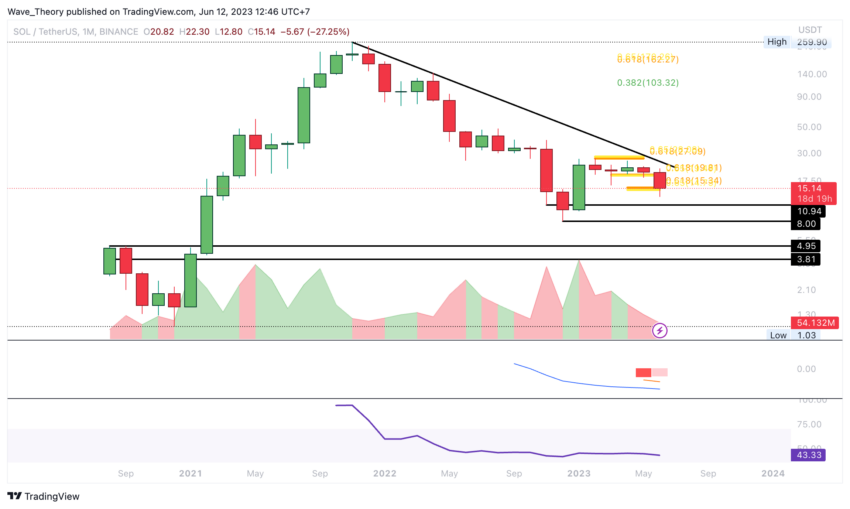
On the upward trajectory, a significant Fibonacci resistance remains at around $27. This is a level from which Solana saw strong resistance earlier this year.
For a bullish trend reversal, Solana would need to break the Fib levels at around $103 and $163, which Solana is currently still far away from.
Therefore, it seems more likely that the downtrend will continue in the medium term.
Indicators on the Daily Chart Are Also Bearish
Despite the ongoing challenges, there remains a glimmer of hope for Solana’s uptrend, provided the price sustains above the Golden Ratio level of approximately $15.
However, the daily chart indicators paint a bearish picture. A ‘Death Cross’ formation – where the Exponential Moving Averages (EMAs) cross in a way that indicates a bearish market – has emerged. This signals a potentially bearish trend in the short to medium term.
Moreover, the Moving Average Convergence Divergence (MACD) is showing a downward tick in a bearish pattern, and the MACD lines have crossed in a bearish fashion too.
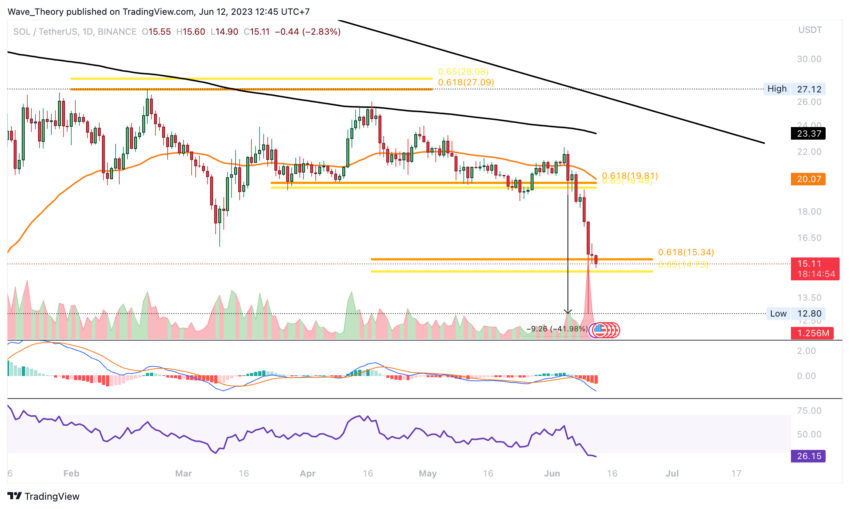
Meanwhile, the RSI has reached oversold regions, after which the price could bounce back in the short term. However, the RSI does not yet indicate a bullish divergence.
A Death Cross Is Also Present on the 4H Chart
Furthermore, a ‘Death Cross’ is also evident on the 4-hour chart, further solidifying the short-term bearish trend.
A ‘death cross’ occurs when the short-term moving average of the cryptocurrency crosses below its long-term moving average. This signals a potential bearish trend and is often seen as a negative indicator by traders, suggesting that further price declines may be ahead.
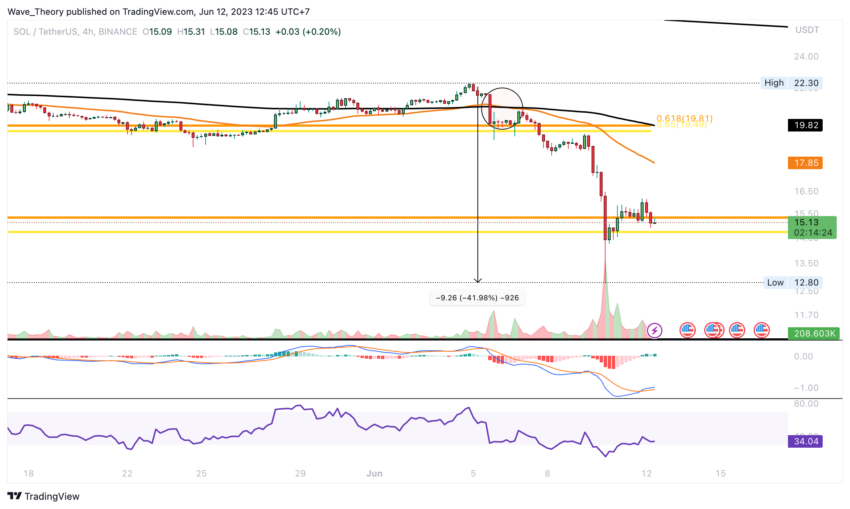
However, the MACD lines on this chart have crossed, indicating bullish momentum, with the MACD indicator ticking higher, indicating bullish activity. As for the RSI, it remains within a neutral range at this time.
Solana Reached a Critical Support Level Against BTC
The SOL price has broken the Golden Ratio support at around 0.00075 BTC. As a result, Solana has now reached critical support between approximately 0.00048 BTC and 0.0006 BTC.
If this support is also broken, Solana could plummet to around 0.000365 BTC and 0.00042 BTC.
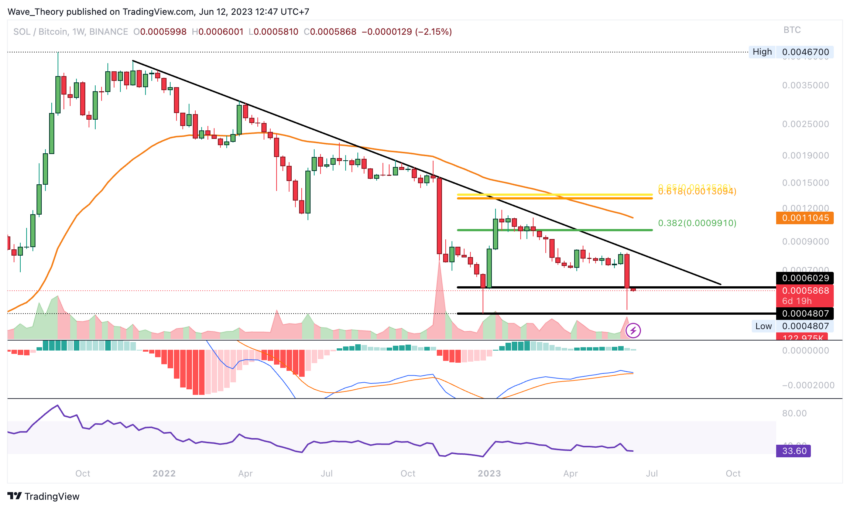
Furthermore, the MACD lines on the weekly chart are about to turn bearish, and the MACD has also been ticking lower in a bearish manner since last week.
If Solana manages to bounce back from this support level now, the next significant Fib resistances are waiting at around 0.000099 BTC and 0.0013 BTC.


