
Founded by Anatoly Yakovenko, Solana is a fast-growing network and ecosystem with the potential to compete with Ethereum. Since its launch in March 2020, it has only grown in value, though it is still early in the project’s lifespan. Here, we look at the Solana price prediction model, primed to work until 2035. We use token analysis, fundamental elements, and other factors to determine where the price might go.
KEY TAKEAWAYS
➤ Solana combines proof-of-stake and proof-of-history mechanisms, enabling high scalability and low transaction costs.
➤ SOL price is projected to reach $1751.08 by 2030, offering a 1692% ROI from current levels.
➤ Frequent network outages and competition from Ethereum pose challenges to Solana’s long-term growth.
- Solana (SOL) price prediction until 2035
- Solana (SOL) technical analysis
- Solana historical price prediction and associated patterns
- Solana (SOL) price prediction 2024 (concluded)
- Solana (SOL) price prediction 2025
- Solana (SOL) price prediction 2030
- What is Solana (SOL)?
- Tokenomics
- Why is Solana unique?
- Frequently asked questions
Solana (SOL) price prediction until 2035
Here is the table that explores the Solana price prediction levels till 2035.
| Year | Maximum price of Solana | Minimum price of Solana |
| 2024 | $312.57 | $42.25 |
| 2025 | $197.36 | $103.64 |
| 2026 | $327 | $44.20 |
| 2027 | $683.02 | $478.11 |
| 2028 | $1039.04 | $701.35 |
| 2029 | $1395.06 | $906.79 |
| 2030 | $1751.08 | $1094.43 |
| 2031 | $1488.42 | $1050.65 |
| 2032 | $1532.20 | $881.01 |
| 2033 | $1313.31 | $722.32 |
| 2034 | $1094.43 | $574.57 |
| 2035 | $875.54 | $437.77 |
Solana (SOL) technical analysis
We now delve deeper into the weekly charts and broader strokes related to the price action.
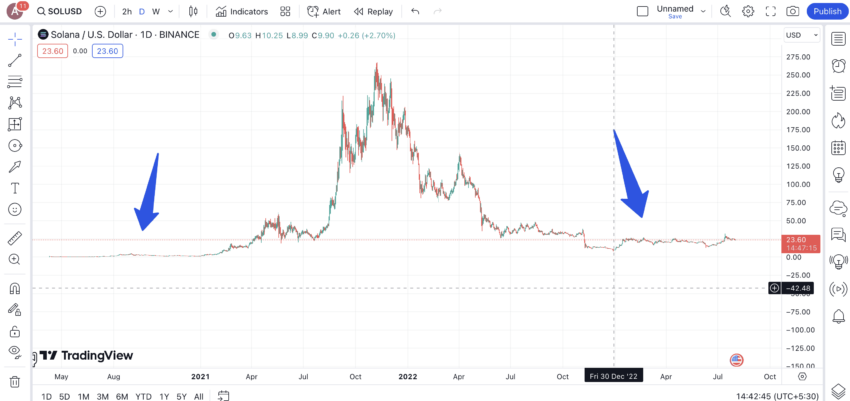
Solana historical price prediction and associated patterns
If we shift our attention to 2023 when a key pattern first surfaced, it is evident that the correction is a mirror formation or, rather, a foldback pattern similar to SOL’s broader price action.
The following chart reveals that the bearish price movements helped the foldback pattern stay true to our expectations.
Also, if we look at the corresponding RSI patterns, the correction for each phase stopped, and the prices surged every time the RSI dropped deep in the oversold region — under 30. The red arrows mark these points. Therefore, for SOL’s price to increase from here, we would need to see the RSI return to the oversold zone.
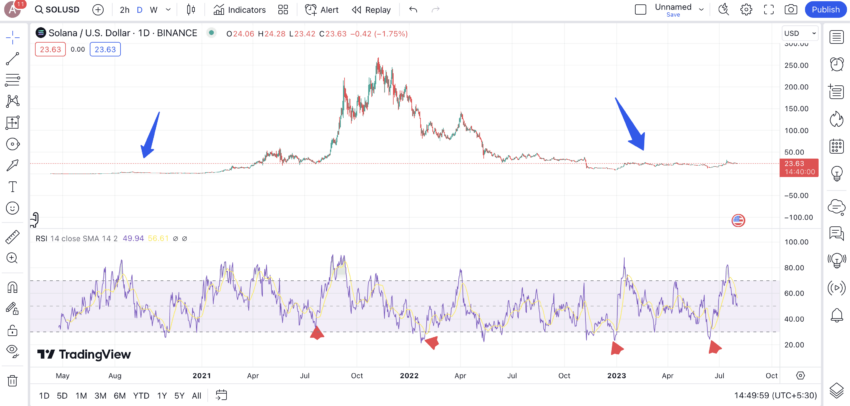
And we would need a solid bullish RSI divergence instead of the price action for a sustained uptrend. This price surge happened as predicted.
If you look at the daily chart above, a rising price followed by a bullish SAR and increased volume can push the prices towards $36.75 and then $42.43 — levels coinciding with the 0.382 and 0.236 of the Fib retracement indicator.
Solana (SOL) price prediction 2024 (concluded)
Outlook: Bullish
Calculations
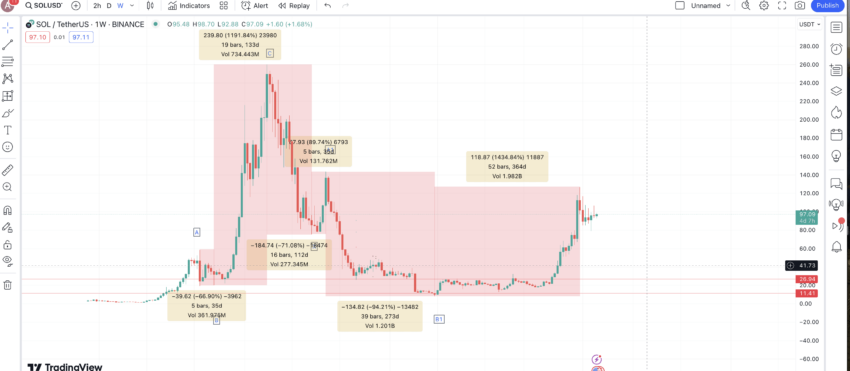
One pattern was clearly visible. A high followed by a higher high, in A to C.
| A to B | -66.90% in 35 days |
| B to C | 1191.84% in 133 days |
| C to X | -71.08% in 112 days |
| X to A1 | 89.74% in 35 days |
| A1 to B1 | -94.21% in 273 days |
Considering these values, the average price surge for SOL was expected to be around 640%.
Also, the average price correction was expected to be approximately -77.40 % in 140 days.
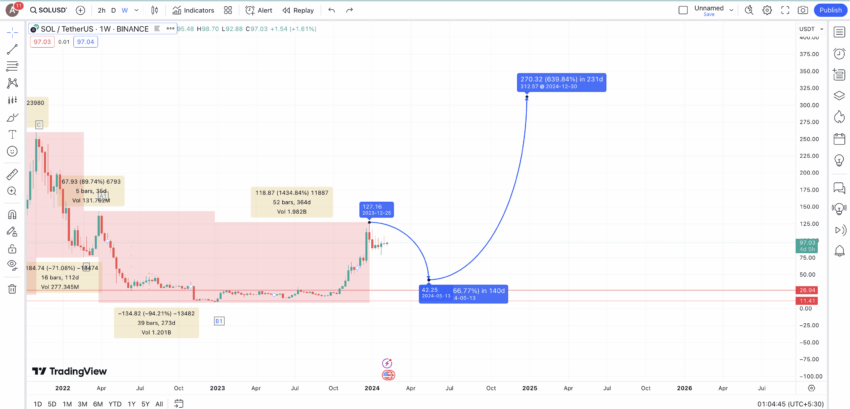
This put the 2024 high at $312.5. But then, Solana managed to come pretty close to that, which was $257.
Solana (SOL) price prediction 2025
Outlook: Bearish
Provided the price of SOL reached almost $260, we can expect a dip of 66.90% — the smallest percentage drop from the table above.
This way, the minimum price of SOL in 2025 could be $103.64. The price surge from this level could be limited to 89.74%, the lowest surge per the table above, courtesy of rapid selling and Ethereum’s growing popularity.
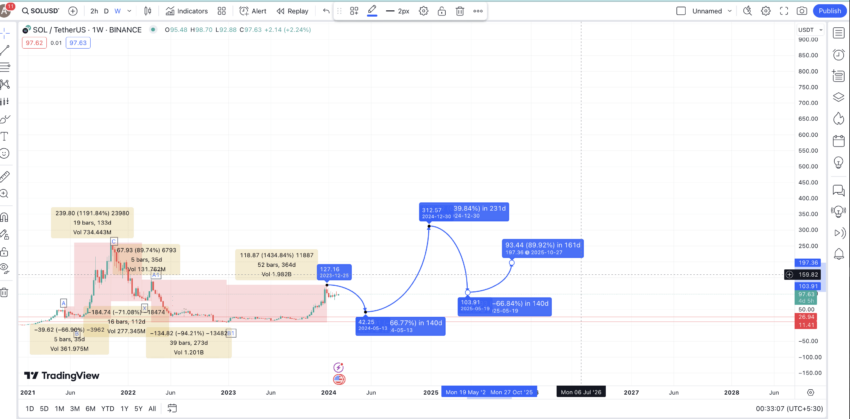
A lesser surge also aligns with our weekly pattern where A1 was formed lower than C, the current all-time high of SOL. Therefore, the SOL price prediction high for 2025 could surface at $197.36.
Projected ROI from the current level: 102%
Solana (SOL) price prediction 2030
Outlook: Bullish
If SOL reaches $197.36 by 2025, the next low might follow the average dip of 77.40%. This way, the 2026 low could surface at $44.20. By this time, new buyers could flock to SOL’s counter, priming the low prices for a massive 640% uptick, which isn’t out of the question for a coin like Solana.
Therefore, the 2026 high could surface close to $327, making a new all-time high.
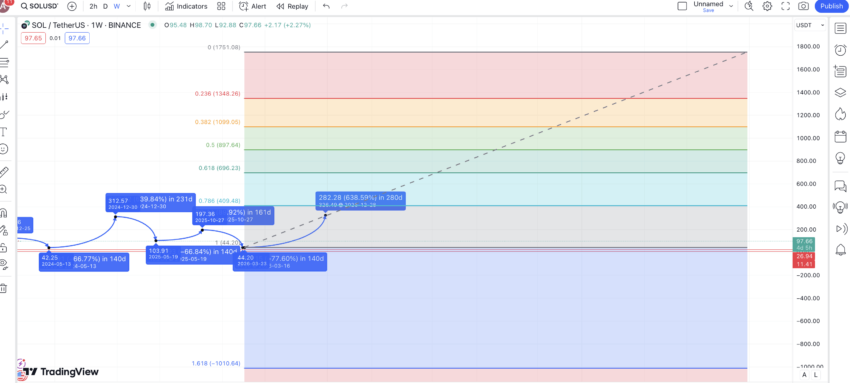
Based on the 2026 low and 2026 high, we can extrapolate the path of SOL till 2030. Per the extrapolation, the price of SOL could reach $1751.08 by 2030.
Projected ROI from the current level: 1692%
What is Solana (SOL)?
Solana is a decentralized open-source blockchain project. Its primary focus lies in the creation of decentralized applications (DApps). Currently, the Solana network boasts more than 400 projects, which span the decentralized finance (DeFi), non-fungible token (NFT), and web3 sectors.
Solana provides great scalability because it uses a proof-of-stake (PoS) and proof-of-history (PoH) consensus mechanism. Due to this hybrid mechanism, it processes a block at very fast transaction speeds of 50,000 tps (transactions per second). In addition to this, it has transaction costs of less than $0.01.
The PoH consensus runs parallel to the PoS consensus. It is a sequence of computations that makes it possible to verify the time passed between two events by using cryptography. Due to its secure cryptographic function, the input cannot predict the output. Rather, it has to be executed fully to arrive at the output.
Solana keeps growing:
It is possible to both create and trade non-fungible tokens (NFTs) in the Solana ecosystem at very low transaction fees. One such project was ”The Degenerate Ape Academy,” which was launched in August 2020 and sold 10,000 units in a matter of minutes.
Did you know? The Solana network possesses more than 4400 nodes. This makes it more decentralized when compared to other similar blockchains. However, there is a relatively high cost of between $3000–$40000 to become a validator node.
The network has seen considerable growth in 2021 since numerous well-known projects, such as ChainLink (LINK), Terra (LUNA), and Serum (SRM), have boarded the platform. However, it got embroiled in the FTX contagion, after which the price dived.
Tokenomics

The native token for the Solana platform is SOL. It has a total supply of 568,874675 SOL.
Holders can stake tokens to validate transactions due to the use of PoS in the consensus mechanism. In addition, holders have governance rights, receive periodic rewards, and pay gas fees with SOL, giving it numerous use cases. However, despite the multiple token-related use cases, Solana has faced several criticisms related to frequent network outages.
Why is Solana unique?
SOL differs from other platforms specializing in DApp creation because it combines a proof-of-stake with a proof-of-history concept. This gives it a great degree of scalability and very low transaction costs. The low transaction costs have been especially helpful in the NFT sector since gas fees have consistently provided problems in the ETH blockchain. Also, the Solana price prediction shows how aggressive and lukewarm the price movements can be compared to the broader market.
Disclaimer: This analysis highlights Solana (SOL) and its potential market trends. Cryptocurrency markets are unpredictable, and SOL’s performance may vary. Make informed decisions by conducting research and consulting a financial advisor.
Frequently asked questions
How much will Solana be worth in 2025?
What is the future of Solana?
What makes Solana’s proof-of-history mechanism unique compared to other blockchains?
Disclaimer
In line with the Trust Project guidelines, the educational content on this website is offered in good faith and for general information purposes only. BeInCrypto prioritizes providing high-quality information, taking the time to research and create informative content for readers. While partners may reward the company with commissions for placements in articles, these commissions do not influence the unbiased, honest, and helpful content creation process. Any action taken by the reader based on this information is strictly at their own risk. Please note that our Terms and Conditions, Privacy Policy, and Disclaimers have been updated.


