


Cryptocurrency traders use technical analysis as a guide to managing their trades. Certain price movements take on distinctive patterns which can help predict trends. And you may have heard of some of these popular trading terms, such as Fibonacci, death crosses, and various flag patterns. In this article, we hone in on one of the most bullish candlestick formations, aptly termed the bull flag pattern.
Learn how to spot a bull flag quickly in a trading chart. Plus, check out our tips on profiting from flag pattern trading in this comprehensive guide.
BeInCrypto Trading Community in Telegram: watch Trading Basics course, read technical analysis on coins & get answers to all your questions from PRO traders & experts!
What is a bull flag?
A bull flag is a candlestick chart pattern in technical analysis that occurs when an asset is in a strong upward trend indicating bullish sentiment. These patterns form when a consolidation, another short spike, and some more consolidation follow a substantial spike in price. In short, these bullish flag patterns indicate a pause in the uptrend that leads to uptrend continuation, and bullish flags are one of the most reliable continuation patterns.
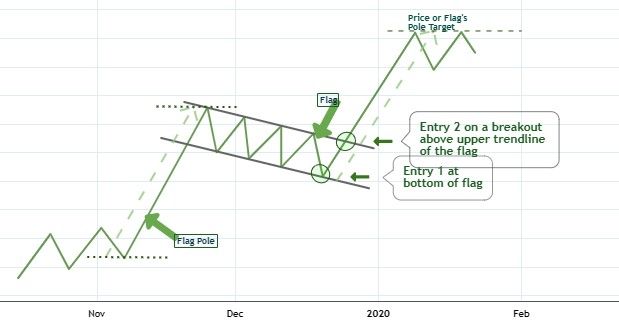
The bull flag pattern derives its name from the shape formed when traders chart out the trend lines. Two parallel upper and lower trends are plotted on the chart after the initial pullback and consolidating sideways price action. The first rally, represented by a steep vertical climb, forms the flag’s pole, while the flag is formed around the consolidation trend that can either be horizontal or a downward slope. Another variant of this pattern is referred to as a bullish pennant, where the consolidation takes the form of a symmetrical triangle.
It’s important to understand the psychology behind this type of flag pattern trading in order to take advantage of its opportunities. Bull flags usually appear in conjunction with a new market rally. Basically, the price refuses to drop substantially after a steep hike. This indicates that bulls are still sweeping in on the action and taking shares. As a result, bull flag breakouts often result in powerful rallies.
How long do bull flags last?
Cryptocurrency prices tend to be extremely volatile, so trading strategies should always reflect this. That said, chart patterns don’t always last long. The bull flag’s goal is to allow traders to profit from the market’s current momentum, which we’ve already established can be very shaky and dependent on outside factors. So pinpointing the exact time a bull flag will last is not possible. However, expect one to last between one and six weeks. Once spotted, you can look forward to a continued bull trend.
How to spot a bull flag pattern
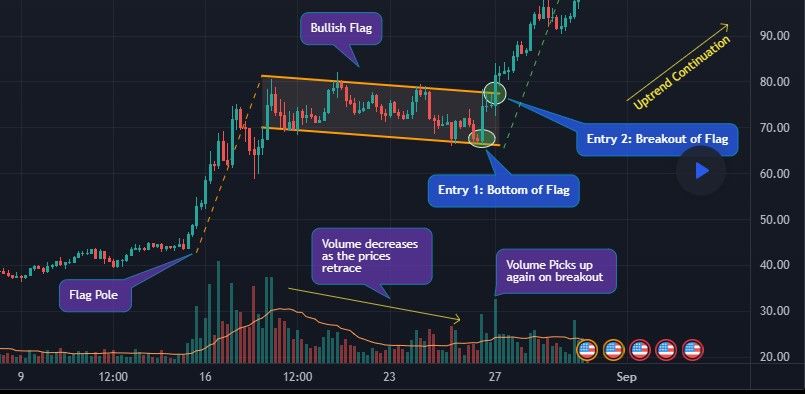
It is fairly easy to spot a bull flag just by looking at a trading chart. After plotting the trend lines, the pattern will resemble a flag on top of a pole. In this case, the bullish trend will be represented by increased volume in the pole and decreased volume in the flag where the price consolidates. These are the specific characteristics to look for when spotting a bull flag pattern in a trading chart.
Characteristics of a bull flag in charts
- A pole is formed after a strong surge in volume
- The price consolidates at the top of the pole as volume is lowered
- The asset breaks out of consolidation at a steady volume to maintain the trend
Types of bull flags
Not all bull flags look the same. Much of the sequence is dependent on several factors, including volume and the trader’s reactions to certain movements. Some flags are straight, while others form a triangle. While there may be an array of different shapes, three bull flag variants come up quite often.
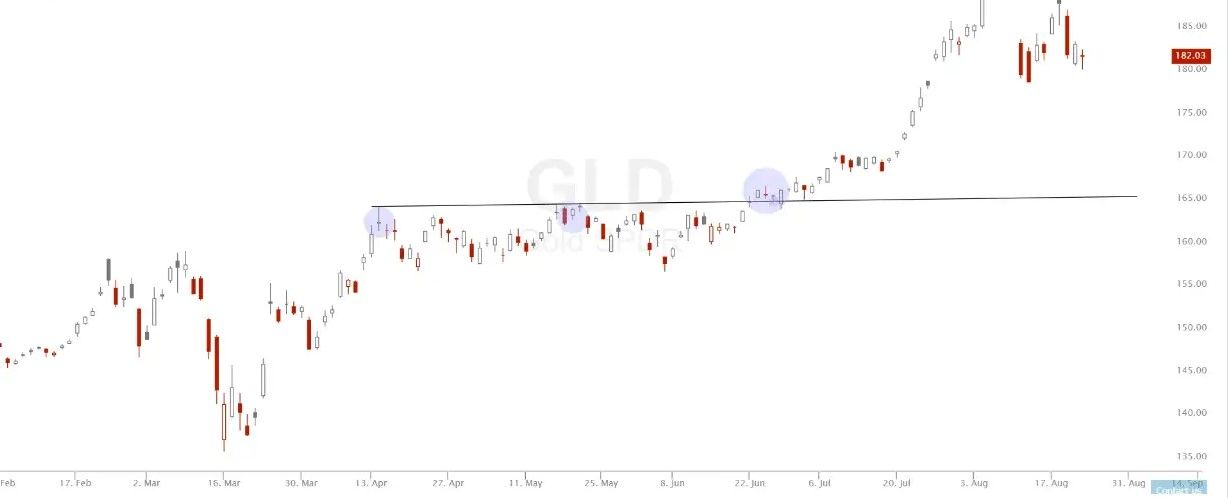
Flat top breakout pattern
In this type of pattern, resistance levels in the flag formation generally remain as high as the flag pole. The pattern creates a horizontal line across the top. Support levels at the bottom may ascend to create a triangle which we have already established as a pennant. The flat-top breakout tends to be a favorite amongst traders since it doesn’t pose any substantial pullback in the price trend. It indicates that both buyers and sellers have met and agreed on the key resistance level.
Descending flag pattern
In this flag pattern, trading results in a pullback from the top of the flag pole. Descending flag patterns are the most common variant of the bull flag. When the top and bottom lines of the flag are plotted, a parallel downward trend results. This will remain until the asset sees a breakout to the upside. In contrast to a bearish channel, this pattern tends to be short-term and indicates that buyers will need a break. In most cases, descending flags show a continuation pattern.
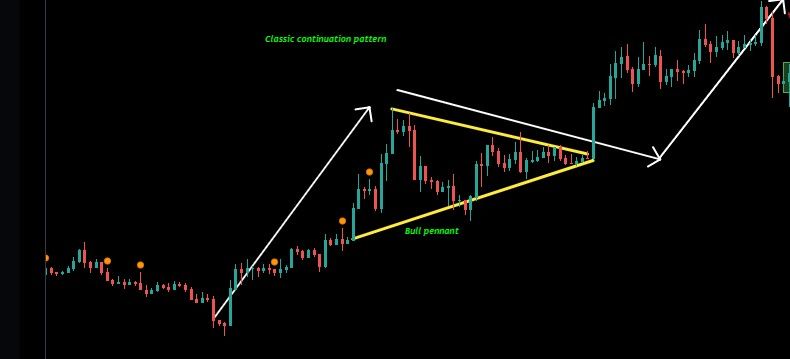
Bull pennant
The bullish pennant also shows a flagpole rise in the asset. However, instead of a rectangular outline of the flag, this pattern consolidates into a triangular form with the top line descending and the bottom line ascending. This indicates resistance and support levels will not be trading at equal distance levels; they converge in a smaller trading window before the eventual breakout. A bull pennant is a bullish continuation pattern signaling an extension of the uptrend when the consolidation is over.
How to trade a bull flag chart pattern
Once you know how to spot a bull flag in a chart, you can plot entry and exit points. Identifying which type of bull flag formation is developing will help you better navigate the price action.
The first thing to look for is the volume which can indicate major moves in the pattern. To avoid a false signal, place your entry after the breakout has been confirmed and the volume is high. Some traders even wait for the next day. You can enter the trade as soon as the candles close above the flag’s resistance.
Next, you need to set up your stop-loss. In general, your risk/reward ratio determines the success of your trade profits. So, you don’t want to risk placing a stop-loss too late. Setting it up right above the support level may be safer, but a good long position can be set directly below the lower trend line. Another method is to use the 20-day moving average as a stopping point. Finally, measure your profit target (a 2:1 risk/reward is a good start) by distinguishing the difference between the pattern’s parallel trend lines. As always, take into account the overall market trend to maximize your success.
What are the risks of using bull flag patterns in trading?
While technical analysis can provide traders with the benefit of spotting trends and reversals, there are still risks to consider. The greatest risk associated with crypto trading is the frequent price fluctuations due to extremely volatile market swings. Therefore, any pattern that is formed on a chart can easily lose its stability at a moment’s notice. And it’s the job of the trader to practice good risk management. This means knowing how much you are willing to lose and setting stop-limit orders in your trades.
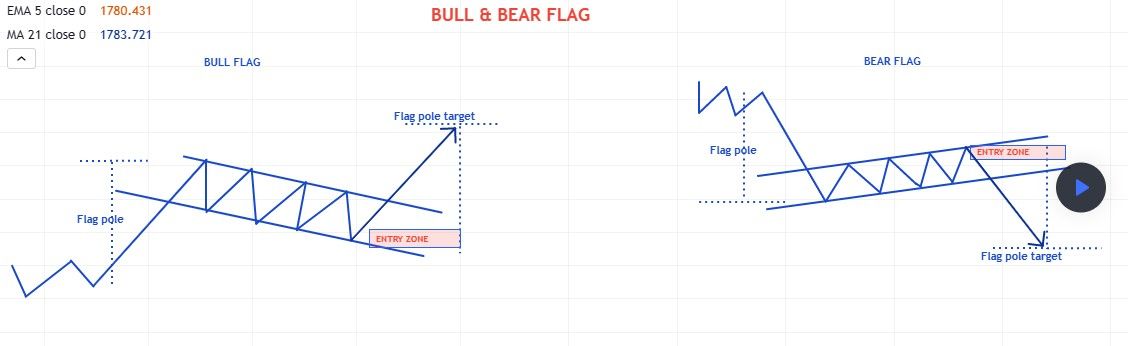
Bear flag vs. bull flag
Bull flags and bear flags look very similar, with the exception of the trending trajectory. The flag and its pole distinguish both patterns. However, in a bull flag, the trend of the flag is upward, while in a bear flag, the trend is downwards. To illustrate this, traders spot a bullish pattern after an intense rally and then watch for the price to trade sideways for a bit. In contrast, a bearish pattern is spotted when price action is in a descending trend line, followed by consolidation.
The psychology behind these patterns indicates demand is higher than supply in a bull flag, while supply is higher than demand in a bear flag. To trade a bear flag pattern, traders usually place an order after the price breaks a support level. Furthermore, in bear flags, the volume doesn’t always decline during consolidation since the declining price induces fear in traders, causing them to take action.
Bull flag patterns are essential for every trader
In general, flag patterns are considered one of the most reliable continuation patterns that traders use in their technical analysis. This is because they provide the ideal setup for entering a chart trend that is ready to continue. If a bull flag is accurate and is spotted on time, it will signal that a crypto’s price will rise once the pattern is complete. Since levels are clearly defined in these types of formations, they offer a great risk-reward ratio for traders. Those wishing to set long trades at a transparent price level should learn to chart these flags appropriately.


