
The THORChain (RUNE) price has increased by 90% over the past 11 days, culminating with a new yearly high of $2.92 today.
Despite the increase, RUNE still has not broken out above the main resistance area at $2.90, which has been in place for 525 days.
RUNE Reaches Yearly High
The RUNE price has increased rapidly during the past three weeks, creating successive bullish weekly candlesticks. During the increase, the price broke out from the $1.90 horizontal resistance area.
Today, the price reached a new yearly high of $2.92 and currently trades inside the $2.90 horizontal resistance area.
This is a crucial area since the RUNE price has not closed above it for 525 days. Additionally, there is a lack of overhead resistance if the altcoin breaks out.
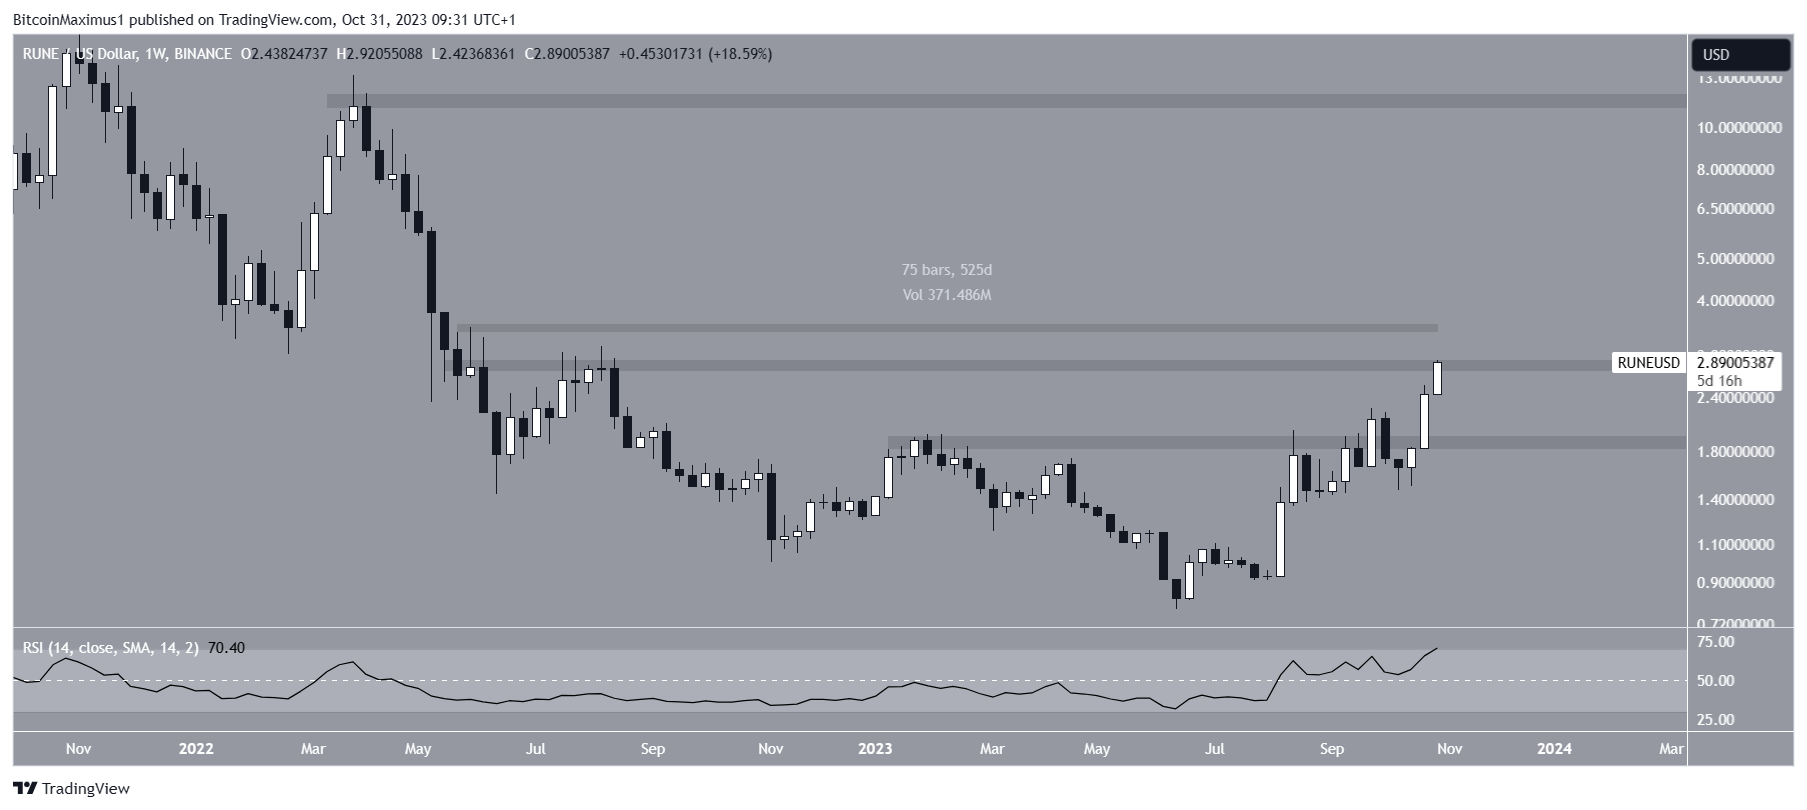
The weekly Relative Strength Index (RSI) provides a bullish reading. The RSI is a momentum indicator traders use to evaluate whether a market is overbought or oversold and whether to accumulate or sell an asset.
Readings above 50 and an upward trend suggest that bulls still have an advantage, while readings below 50 indicate the opposite.
The RSI is increasing and is above 50, both considered signs of a bullish trend.
RUNE Forecast: How Long Will Increase Continue?
The daily timeframe chart also offers a bullish RUNE price outlook, because of the Elliott Wave count and RSI readings.
By studying recurring long-term price patterns and investor psychology, technical analysts utilize the Elliott Wave theory to ascertain the trend’s direction.
The most likely RUNE price count suggests that the price began a five-wave upward movement in June. If so, it is currently in the fifth and final wave (black).
The fifth wave has extended, moving above the length of waves one and three combined. Since it moved above this level, the next most likely ratio for the top of the move is the 1.61 length of waves one and three, which is at $3.50.
The daily RSI is also bullish. The indicator is increasing and is above 50. Additionally, it broke out from its bearish divergence trendline (green), supporting the bullish count.
If the count is correct, the RUNE price will increase by another 20% and reach the $3.50 target.
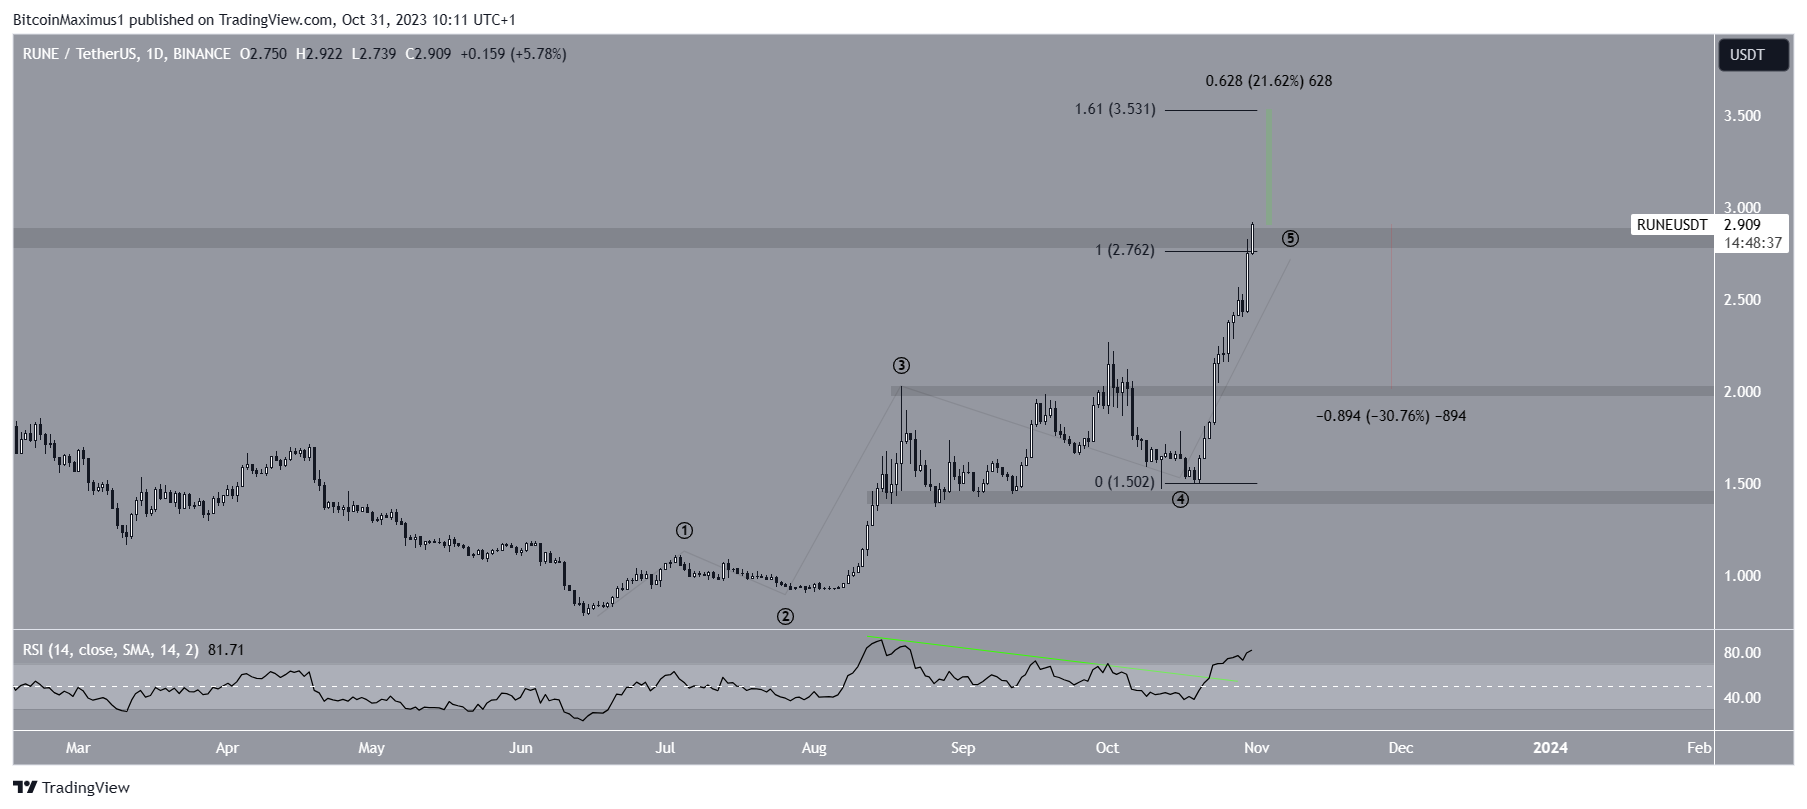
Despite this bullish RUNE price prediction, failure to close above the $2.90 resistance can initiate a 30% drop to the closest support at $2.
Read More: Best Upcoming Airdrops in 2023
For BeInCrypto’s latest crypto market analysis, click here.
Trusted
Disclaimer
In line with the Trust Project guidelines, this price analysis article is for informational purposes only and should not be considered financial or investment advice. BeInCrypto is committed to accurate, unbiased reporting, but market conditions are subject to change without notice. Always conduct your own research and consult with a professional before making any financial decisions. Please note that our Terms and Conditions, Privacy Policy, and Disclaimers have been updated.
