


The ThorChain (RUNE) price has increased swiftly since October 20. The price reached a 430-day high of $2.38 today.
Will RUNE continue increasing towards $3, or is the local top getting closer?
RUNE Reaches 430-Day High
The RUNE price has increased since June, when it was trading at a low of $0.78. The price created a higher low in August and accelerated its rate of increase afterward, reclaiming the $1.05 resistance area.
While the upward movement stalled in September, RUNE accelerated the increase further this week, culminating with a high of $2.34 today.
This was a 430-day RUNE high, since the price was at $2.96 in August 2022.
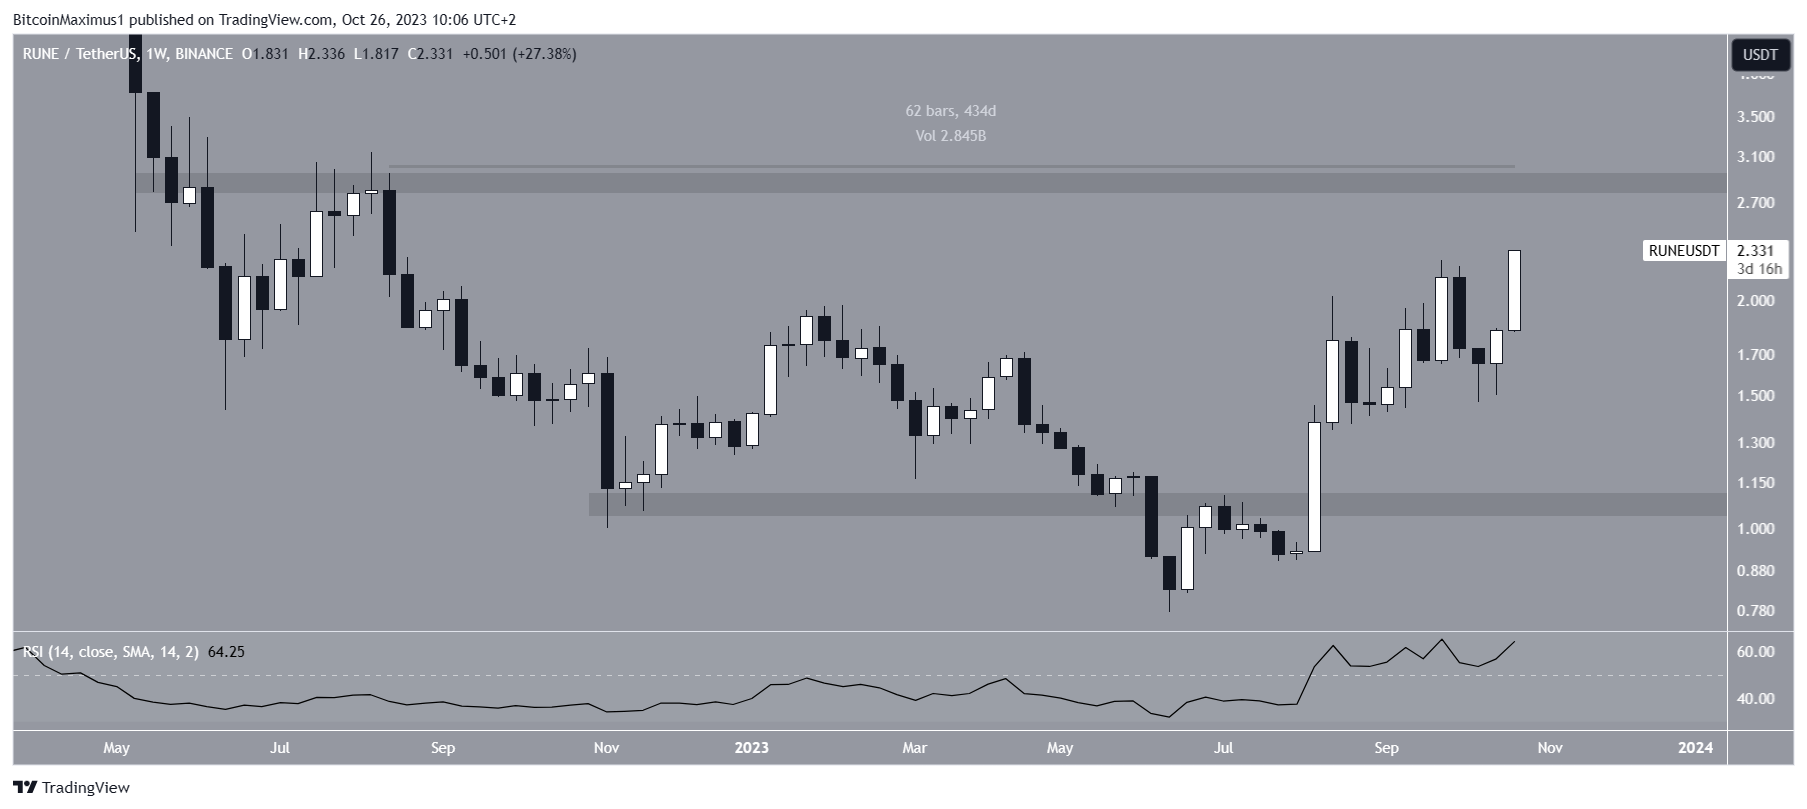
The weekly Relative Strength Index (RSI) is bullish. With the RSI as a momentum indicator, traders can determine whether a market is overbought or oversold and decide whether to accumulate or sell an asset.
Bulls have an advantage if the RSI reading is above 50 and the trend is upward, but if the reading is below 50, the opposite is true.
The RSI is increasing and is above 50, both signs of a bullish trend.
Read More: 9 Best Crypto Demo Accounts For Trading
RUNE Prediction: How Long Will Increase Continue?
Technical analysts employ the Elliott Wave theory to identify recurring long-term price patterns and investor psychology, which helps them determine the direction of a trend.
Elliott Wave theory suggests that the RUNE price is in the fifth and final wave of an upward movement that began in June.
If so, RUNE can increase to $2.73, close to the $2.80 horizontal resistance area. The target is found by projecting the length of waves one and three to the bottom of wave four.
The target is nearly 20% above the current price.
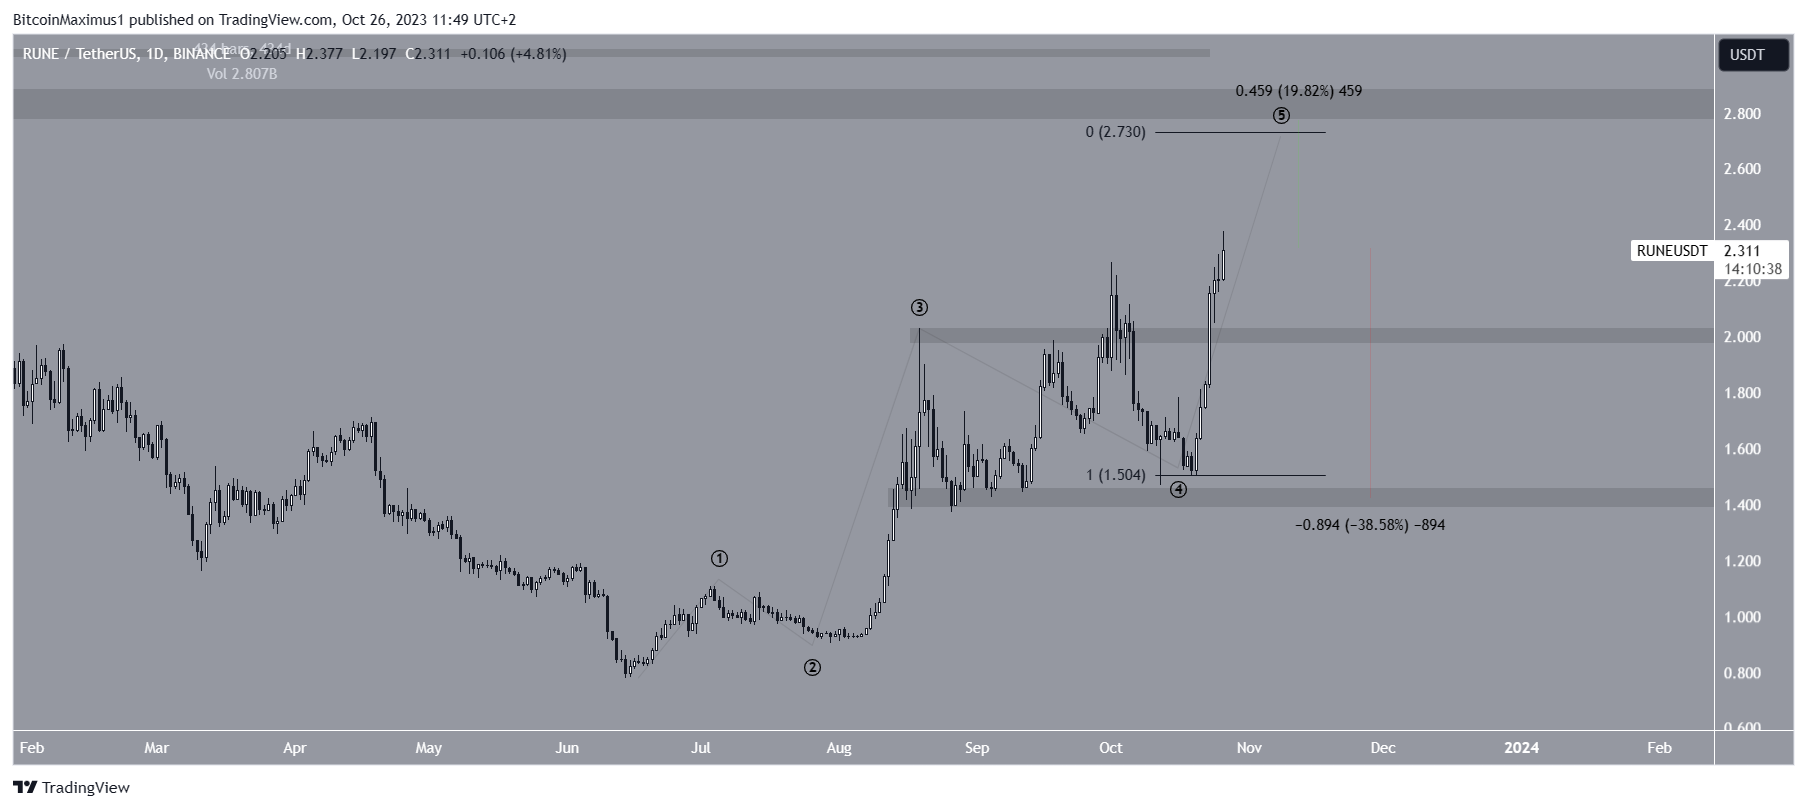
Despite this bullish RUNE price prediction, a daily close below $2 will mean the local top is in.
RUNE could fall by nearly 40% to $1.40 in that case.
For BeInCrypto’s latest crypto market analysis, click here.


