


THORChain (RUNE) moved above the $1.95 resistance area on October 1, reaching a new yearly high of $2.27 in the process.
Before this weekend’s breakout, the resistance area had been in place since the beginning of the year.
THORChain Moves Above Range High
The RUNE price has increased since bouncing at the $1.45 horizontal support area on September 4 (green icon). The increase accelerated on September 11, and the price reached the $1.95 range high on September 18 (red icon).
When the price trades in such a horizontal range, it consolidates between the high and the low before eventually moving outside of the range.
Whether the cryptocurrency moves above the high or low range determines the future trend’s direction.
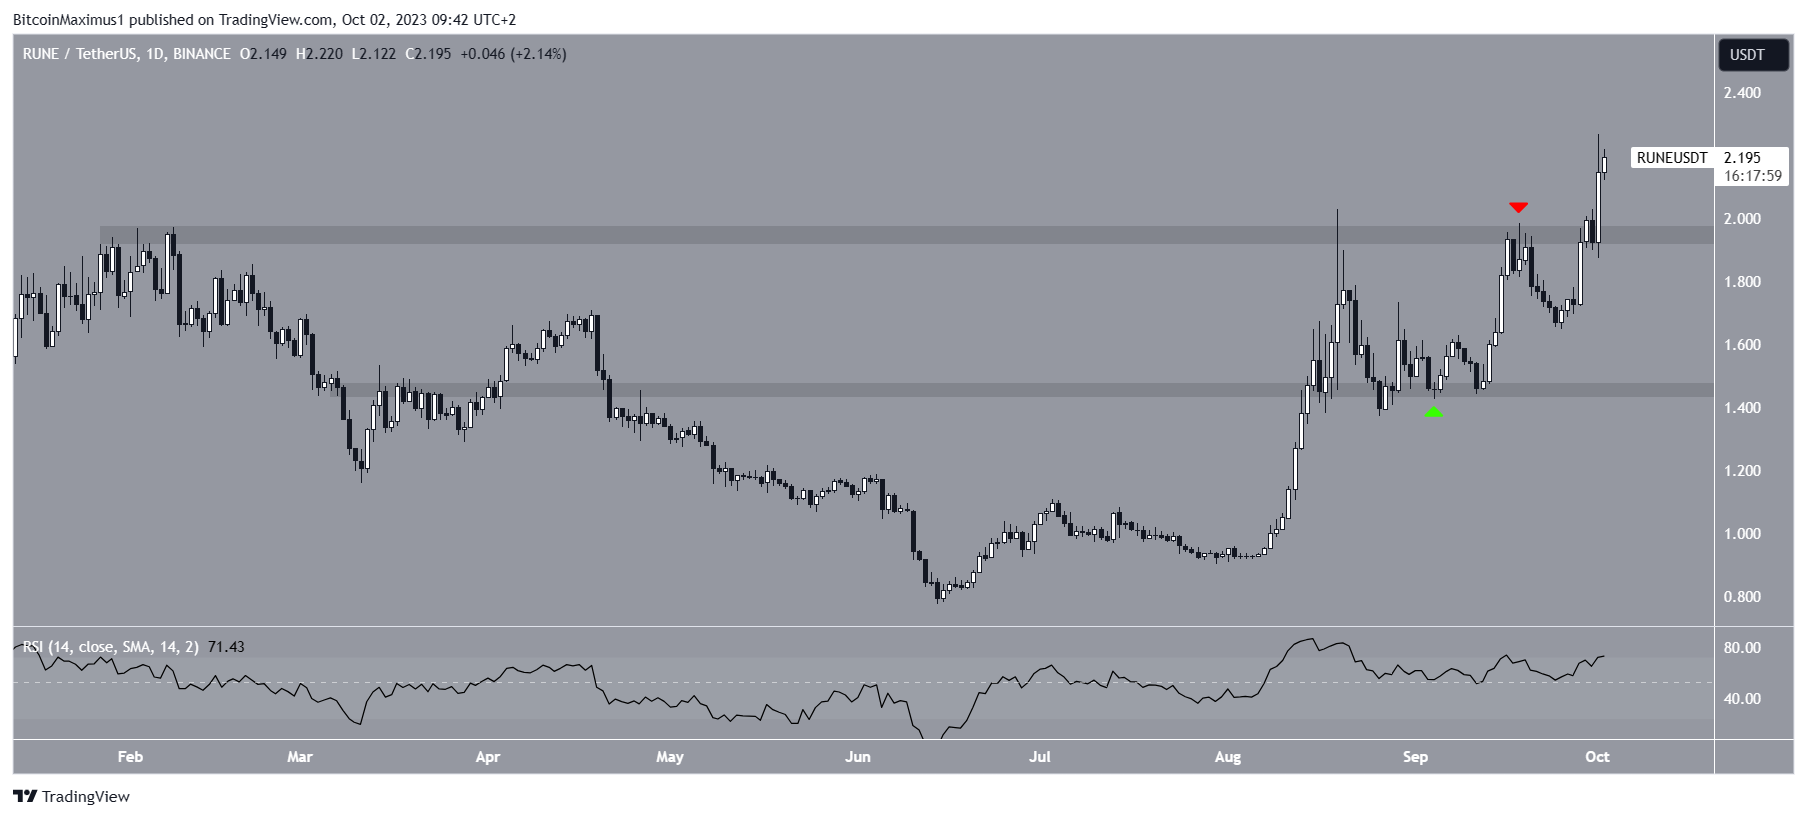
The daily RSI provides a bullish outlook. With the RSI as a momentum indicator, traders can determine whether a market is overbought or oversold and decide whether to accumulate or sell an asset.
Bulls have an advantage if the RSI reading is above 50 and the trend is upward. The opposite is true if the reading is below 50. The indicator is above 50 and moving upwards, both signs of a bullish trend.
RUNE Price Prediction: Where Will the Local Top Be?
Elliott Wave theory is a means to identify recurring long-term price patterns and investor psychology. It helps traders determine the direction of a trend. The most likely Elliott wave count states that the RUNE price is in the fifth and final wave of an increase (black) that began in June.
A symmetrical triangle pattern in wave four characterizes the increase. This pattern is most commonly seen in a wave four position.
If the count is accurate, there’s a possibility for the RUNE price to continue increasing to approximately $2.40 – $2.70, marking a 15% increase from its current value.
This target is identified through the 1.61 external Fib retracement of wave four (black) and the length of waves one and three combined (white).
The Fibonacci retracement concept proposes that following a significant price shift in one direction, the price tends to partially reverse or revert to a previous price level before resuming its initial trajectory.
This principle can be applied to determine the potential peak of future upward movements.
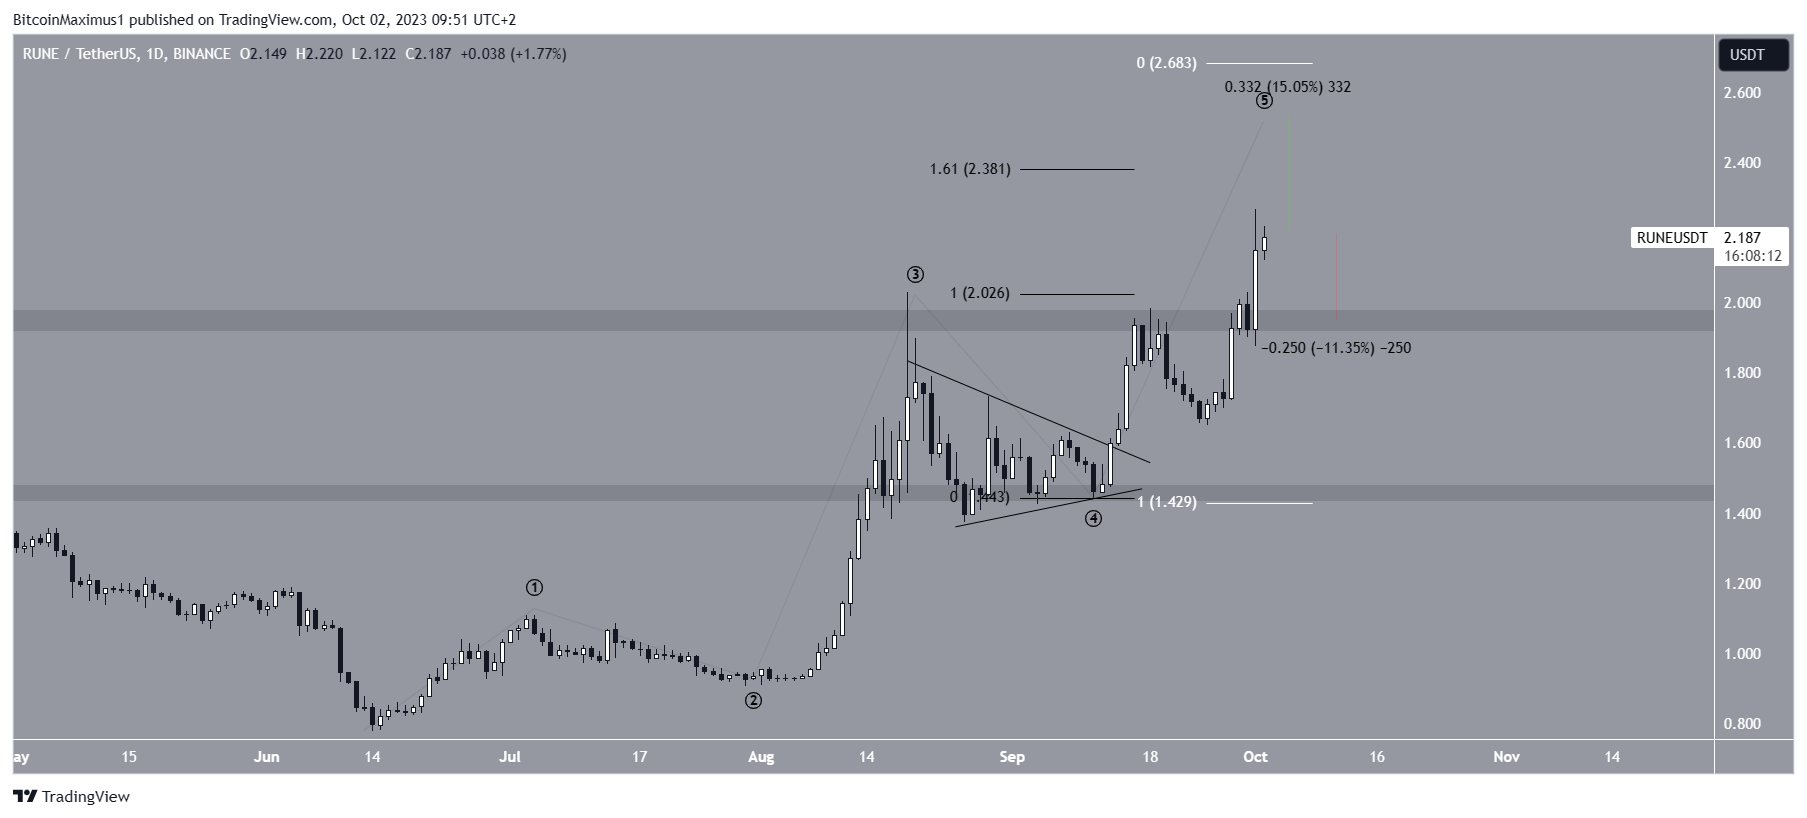
Despite this bullish RUNE price prediction, a sudden loss of momentum will take the price to the $1.95 area. This will also indicate that the local top is in.
Read More: 6 Best Copy Trading Platforms in 2023
For BeInCrypto’s latest crypto market analysis, click here.


