

Decentralized finance has always been a go-to use case for crypto enthusiasts. But centralized bodies like 3AC and FTX going belly up in 2022 further strengthened DeFi’s case. While there are several prominent DeFi projects and protocols — including the likes of AAVE and Euler — here we will discuss Compound. This reputed lending protocol’s native token is COMP. So is COMP a worthy investment? What is the likely future of the token? This comprehensive Compound price prediction uses fundamentals, on-chain analysis, and social metrics to find out.
Want to get COMP price prediction weekly? Join BeInCrypto Trading Community on Telegram: read COMP price prediction and technical analysis on the coin, ask and get answers to all your questions from PRO traders! Join now
- Compound price prediction using fundamental analysis
- Compound tokenomics
- Compound (COMP) price prediction using on-chain metrics and social growth (2022-23 insights)
- Compound price prediction using technical analysis
- Compound (COMP) price prediction 2023
- Compound (COMP) price prediction 2024
- Compound (COMP) price prediction 2025
- Compound (COMP) price prediction 2030
- Compound (COMP’s) long-term price prediction until 2035
- How accurate is the Compound price prediction?
- Frequently asked questions
This article may be outdated, we suggest you visit our new Compound Price Prediction tool.
Compound price prediction using fundamental analysis
Compound is a DeFi lending instrument allowing users to deposit their crypto to specific pools to earn interest. The protocol already has a delectable use case for those seeking passive income. Users who deposit tokens to a pool get a receipt token in return. As the exchange rate of these receipt tokens increases, users can redeem more of the deposited assets. And that’s how they keep earning passive income.
As of 2024, Compound’s DeFi presence has crossed almost three times, with the TVL standing at $3.72 billion.
While this looks like a standard business model, here’s what else we should know before forecasting Compound’s future price.
- Compound also offers secured loans against deposited collateral.
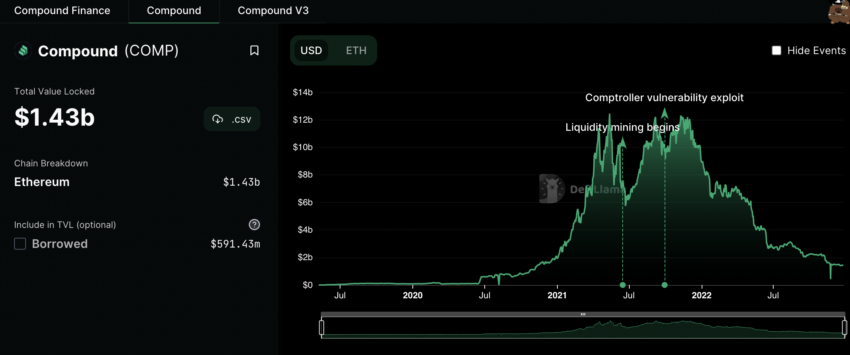
- The Compound Network has a massive DeFi presence with over $1.4 billion TVL (total value locked).
- It is built on Ethereum and works on algorithmically set interest rates.
- A new version — Compound III — came into existence in August 2022 with a focus on gas-fee-efficient lending.
- The broader financial ecosystem, also called Compound Finance, also works as a money market.
- COMP, the native ERC-20 token of this DeFi lending ecosystem, comes with governance-specific capabilities.
- It uses smart contracts for fund management across pools.
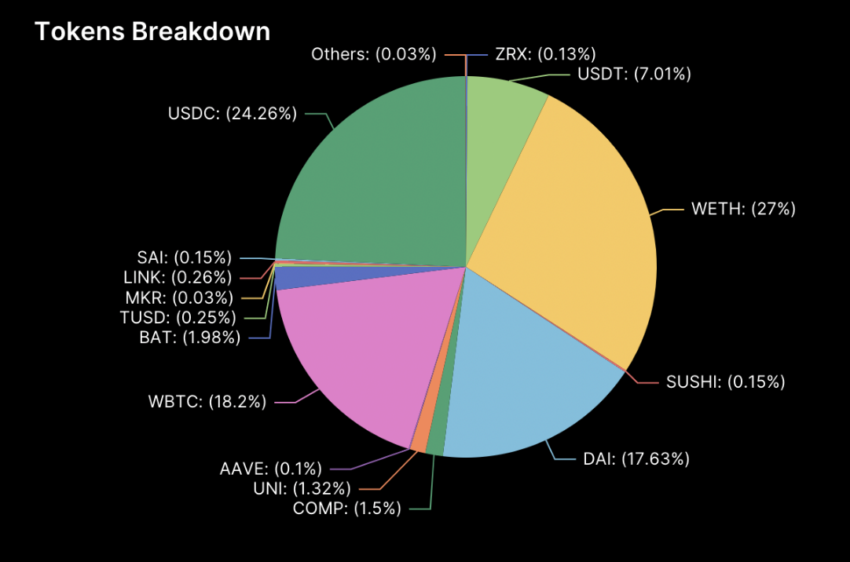
- Compound, the lending protocol, has a pretty even distribution of digital assets. WETH and USDC form the majority of the pool strength.
- Regarding DeFi presence, Compound Finance ranks 7th when Ethereum-based protocols are concerned.
Compound looks strong, fundamentally. With DeFi lending growing in popularity, the future price of COMP might improve once the bear market subsides.
Compound tokenomics
The token model of digital assets does impact their future prices. COMP tokens, relevant to the Compound network, are primarily used to determine the ecosystem’s state. They do not come with a quintessential investment structure. Eventually, token holders might be able to make ecosystem-specific decisions.
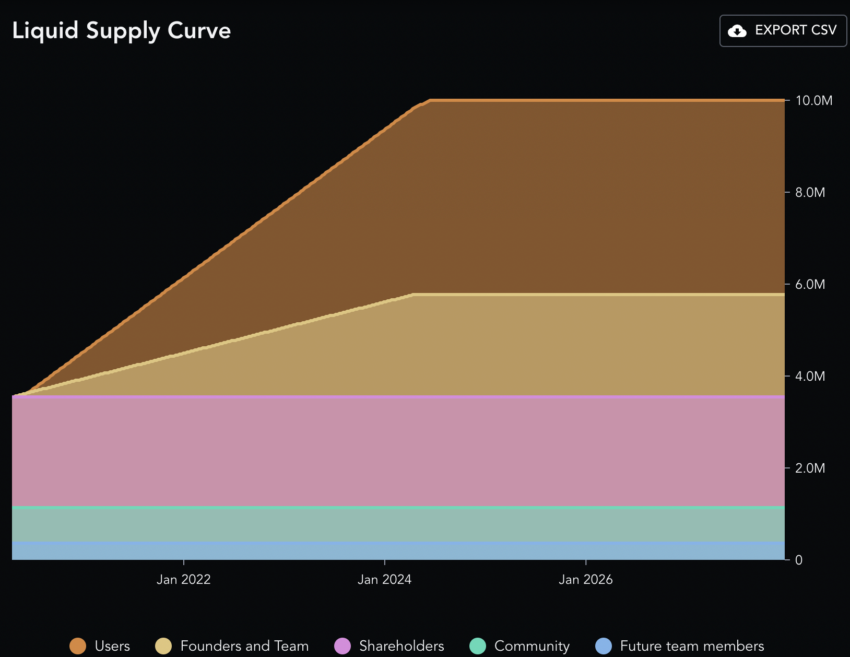
Coming to tokenomics, COMP has a maximum supply of 10 million. As of February 2024, nearly 81% comprise the circulating supply. Do note that users hold the maximum percentage of the COMP tokens. Further, the token release schedule follows a four-year period, shielding the entire structure from sudden market-wide sell-offs.
Compound (COMP) price prediction using on-chain metrics and social growth (2022-23 insights)
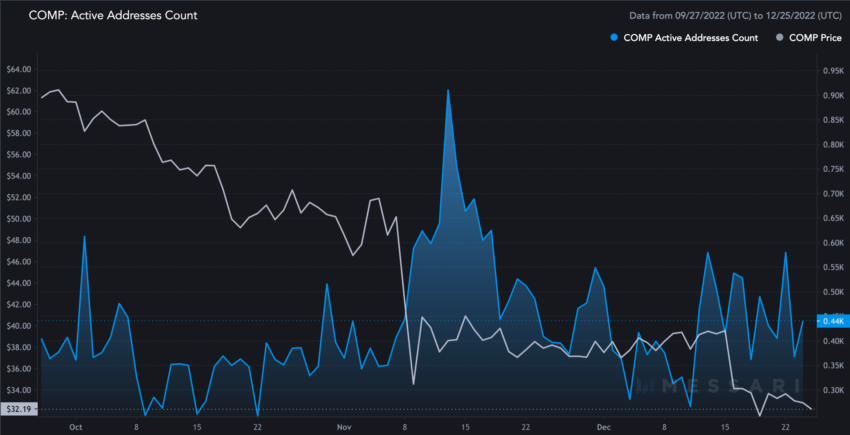
COMP’s transaction volume has flatlined over the past three months, per data from 2022. The prices have followed the same, showing high transaction volume can increase prices.
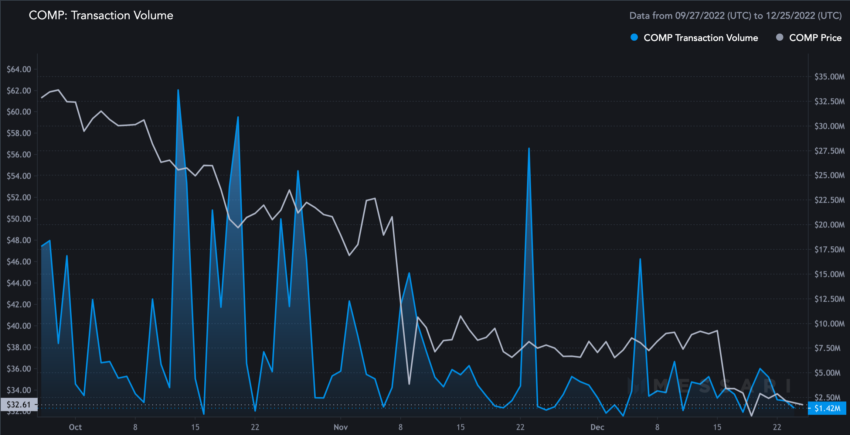
The number of active addresses peaked in mid-November 2022 as prices remained steady. However, a dip came in December 2022, and the prices followed the same.
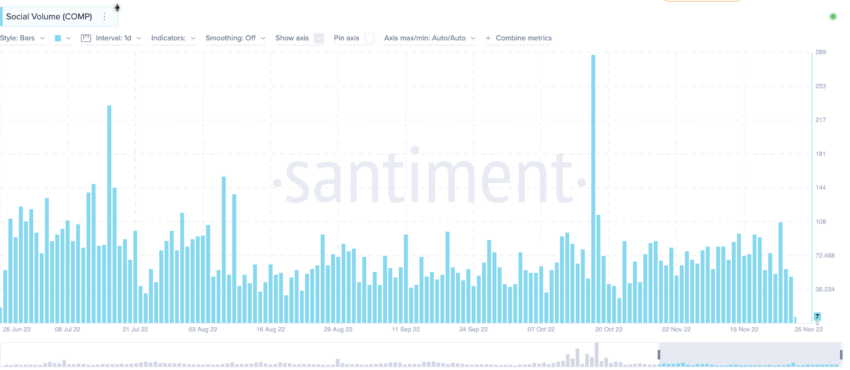
Social activity moved to its peak in mid-October 2022. Since then, it has been keeping steady over the next few months.
And finally, if you are looking at the short-term price predictions for Compound, the 90-day MVRV ratio comes across as a good metric.
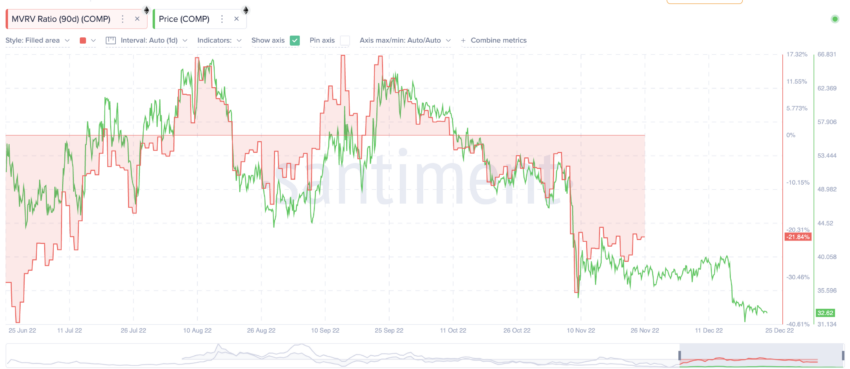
In November 2022, the MVRV was in the negative zone. Even if the current price of COMP tokens is trading low, we’ve seen low MVRV levels lead to price surges in the past.
Compound price prediction using technical analysis
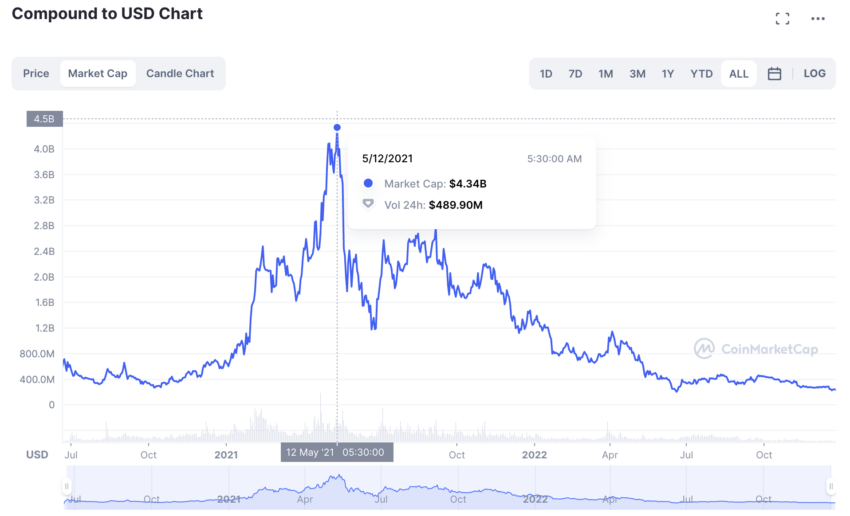
Here is the weekly price chart of COMP.
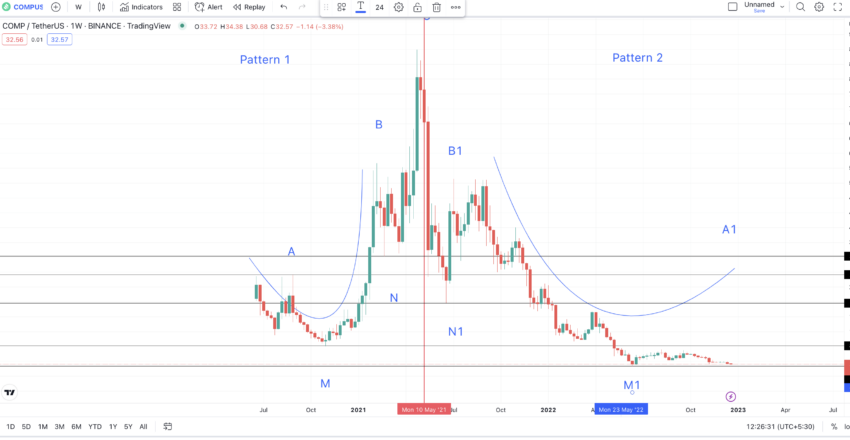
While you look at it and try to determine a pattern, let us quickly go over some of the insights that might help you make sense of COMP’s previous moves:
- The maximum price of a COMP token is $911.20, which it reached on May 12, 2021.
- The minimum price came on June 18, 2022, when COMP reached $26.52.
- The peak market cap is $4.34 billion, which surfaced on May 12, 2021 — the day prices peaked.
- The turn-over ratio (trading volume to market cap) at the peak was 0.11.
- As of Dec. 23, 2022, the market cap is $239.88 million.
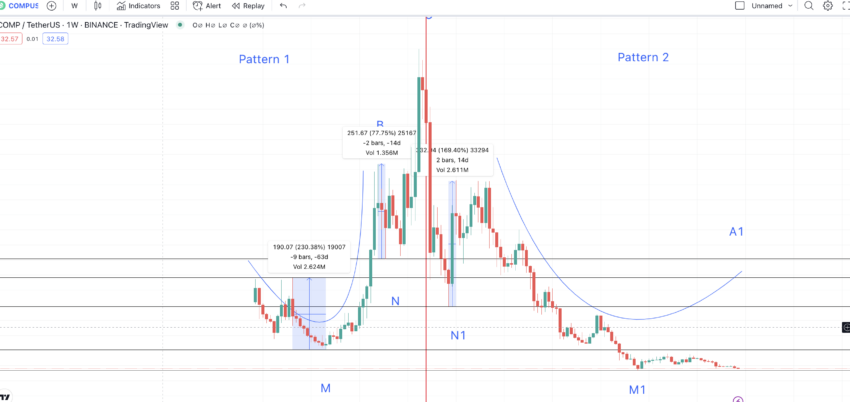
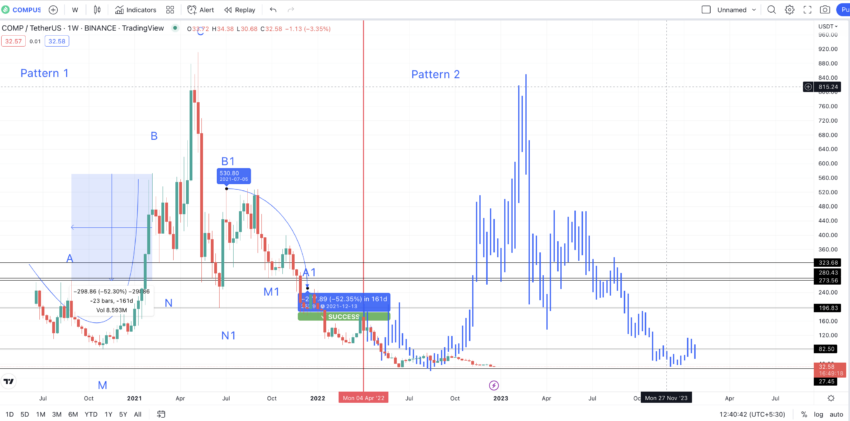
Identifying the pattern
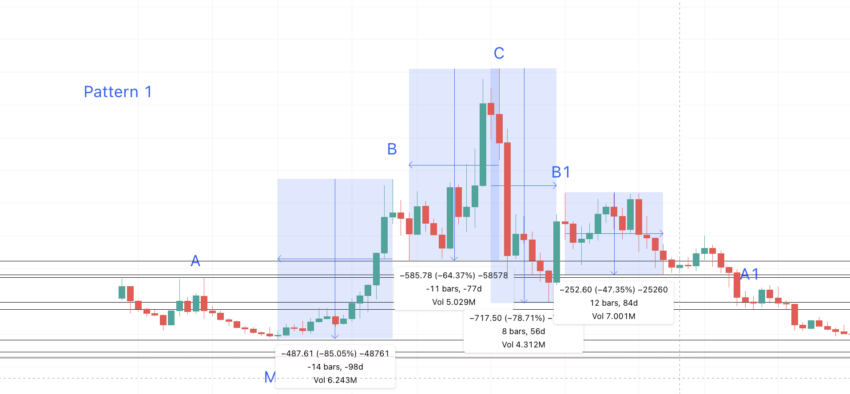
If you look at the weekly chart, you will notice a broader trend. The COMP price starts at a peak, makes a rounded bottom, and peaks again. It then forms another bottom, then finally forms the highest price peak. The mirror image of Pattern 1 follows with a bottom and then a lower high.
However, after the lower high, COMP makes another mini swing-high pattern with three lower highs. As you can see, COMP must make another high to complete the rounded bottom formation identified in pattern 1.
For the sake of understanding, let us divide the chart into two patterns and assign identifiers to the highs and lows.
Price change
Do note that the B1-M1-A1 curve in the pattern one should trace a similar path as B-M-A for the pattern theory to hold. Let us mark the lows from C to B and C to B1 as N and N1, respectively. This will help us calculate the low to high range and allow us to find the location of A1.
Data set 1 is as follows: N to B = 14 days and 77.15% price change; N1 to B1 = 14 days and 169.4% price change; M to A = 63 days and 230.68% price change.
Average percentage increase: 159.27%
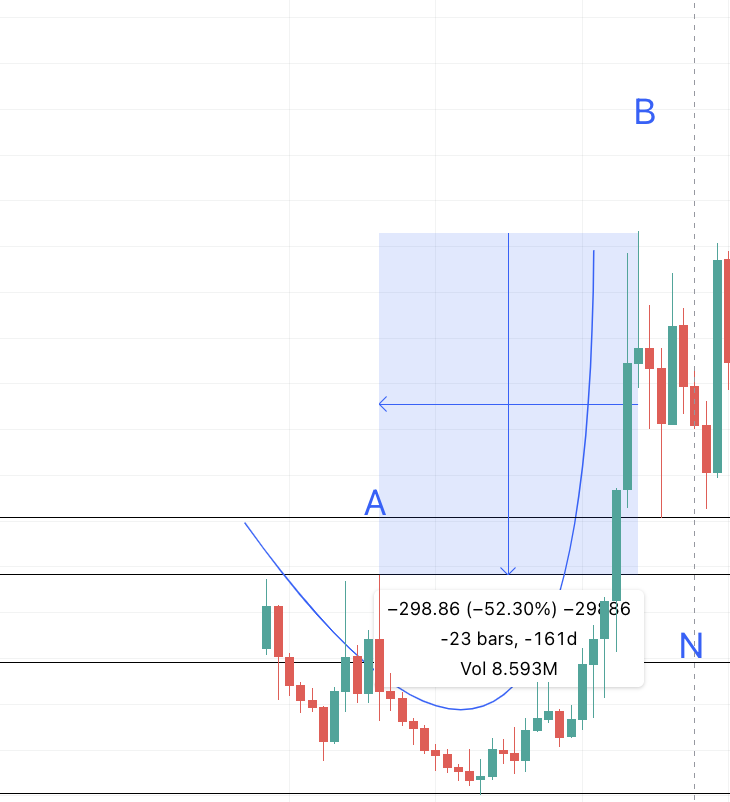
As we have fewer points here, we may be unable to calculate the distance properly using the table above. For that, let us take the distance between B and A to generalize the distance between B1 and A1.
B to A is 161 days and a 52.30% drop. Therefore, B1 to A1 might show up around the same interval and percentage drop.
If we draw the first point from B1, using the data above, A1 surfaces at $252.91 and on Dec. 13, 2021. Now see that the point is a success on the chart, showing that our prediction was accurate. So we now shift the A1 to the Dec. 13, 2021 point and realign the patterns.
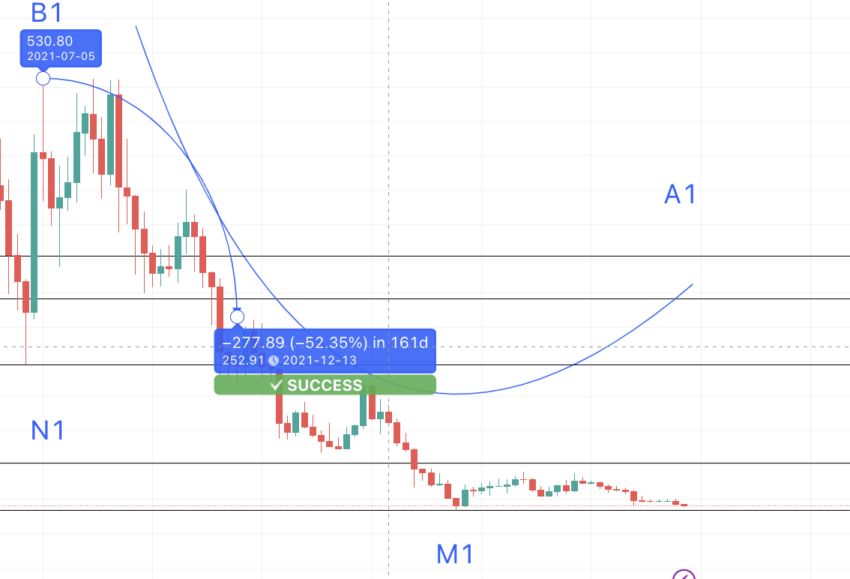
The higher-high and lower-low set becomes the first pattern. We must use the foldback pattern to create Pattern 2 from scratch. Even the M1 shifts to be between B1 and A1. If we use the bars pattern, the next pattern or the new Pattern 2 should be like Pattern 1, using historical data.
The new pattern
If we shift the bar pattern a bit, we see that the previous low, now M2, can be considered the first low of Pattern 2. The immediate high before that can be the A2 of the next pattern. Now that we have the new A2 and M2, we can extrapolate the locate the values at B2 and C2.
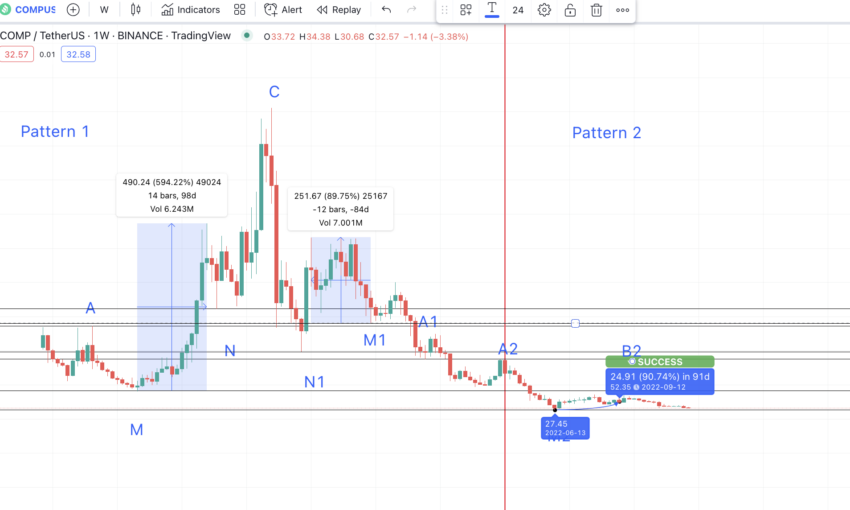
Data set 2 is therefore as follows: M to B = 98 days and 594.2% price change; M1 to B1 = 84 days and 89.75% price change
The average comes to be 91 days and 341.98%. Hence, the distance from M2 to B2 can be anywhere in the range presented in data set 2. If we draw a forecast line from here, we see that the new high is lower than A2. This proves that COMP is in a downtrend.
Now, let us take the distance and price difference between B and C and B1 and C to locate the next peak.
Data set 3 emerges as: B to C = 91 days and 59.44% price change; B1 to C = 56 days and 73.04% price change
The average comes out to be 74 days and 66.24%.
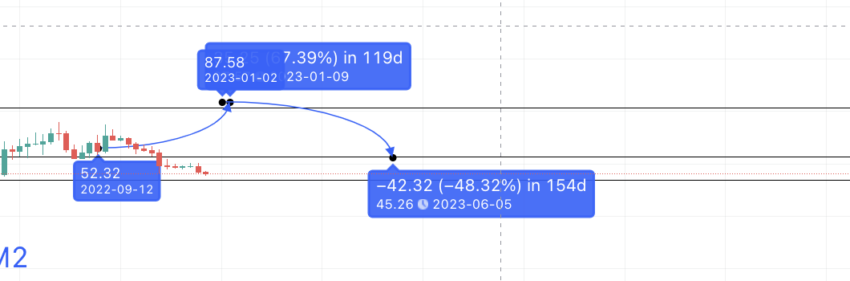
Therefore, if we plot the same from B2, we get C2 at $87.57. Note the time may increase due to the bear market. The previous data was gathered during the bull market. COMP almost reached this level in early 2024, making our price predictions hold.
Read further to know how we analyzed COMP in 2023!
Compound (COMP) price prediction 2023
Despite the bear market, realistic 2023 price predictions place the Compound high at $87.57. This might not be the maximum price, and we might see another high. But $87.57 is a safe level to presume.
The 2023 low can surface at the strong support of $45.01.
Short-term validation
We have pulled out COMP’s daily chart just to see that COMP is currently trading inside a bullish descending wedge pattern. If COMP breaks the upper trendline, prices could rise quickly.
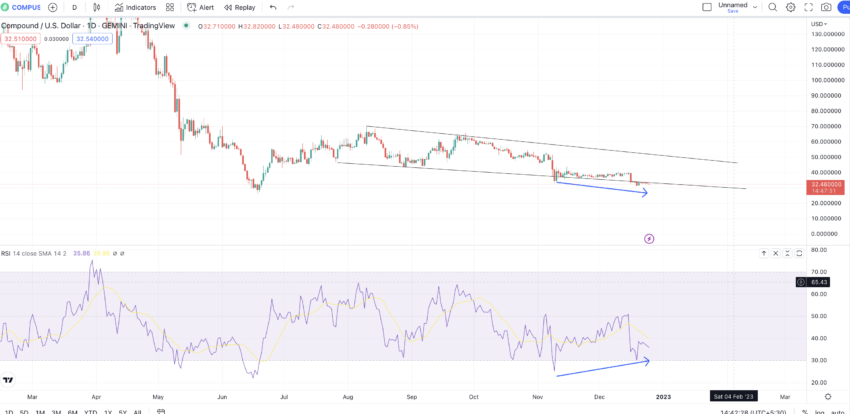
Also, the RSI shows a bullish divergence, which makes higher lows when the price chart makes higher lows. Therefore, the COMP price looks bullish in the short term, and a rally up to $87.57 in 2023 may happen.
Compound (COMP) price prediction 2024
Outlook: Bullish
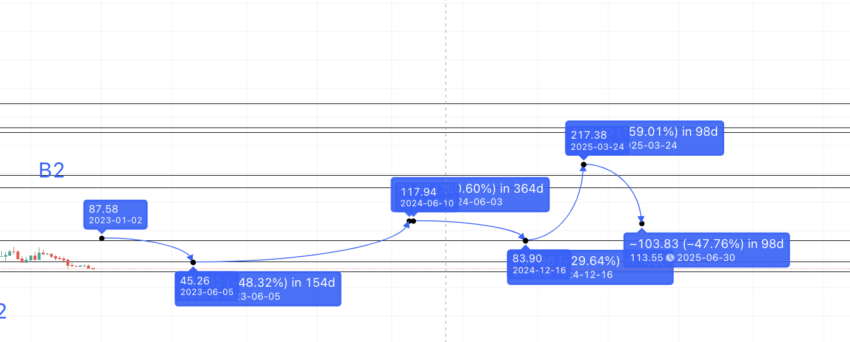
Data set 1 shows the average distance from the low to the high is 159.27%. The timeframe can vary depending on the state of the crypto market. From the 2023 low, we can plot the next line at a high of 159.27%, which surfaces at $117.94. Therefore, the COMP price prediction for 2024 puts the high at above $100.
The current state of the crypto market might put the high in a year from the previous low. The low can be at the strong support level of $82.50, which coincides with M from Pattern 1.
Projected ROI from the current level: 38%
Compound (COMP) price prediction 2025
Outlook: Bullish
The next high can again be at 159.27%. However, by this time, COMP should be able to move in close to 98 days — the distance from M to B. Therefore, the future price of COMP in 2025 can reach a high of $217.30.
We can now take the average of all high to low drops, to find the ideal low level for the following years.
Data set 4 is as follows: B to M = 98 days and -85.05%; C to N = 77 days and -64.37%; C to N1 = 56 days and -78.71%; B1 to M1 = 84 days and -47.35%
The average distance and drop come to be: 79 days and 68.87%.
So from the high of 2025, the next low might surface at $68.61. However, if COMP keeps the uptrend going, the next low could be at a 47.35% drop (the minimum point from the table above). This puts the 2025 low at $113.55.
Projected ROI from the current level: 154%
Compound (COMP) price prediction 2030
Outlook: Very bullish
Now, if we take the 2025 high and the 2024 low into consideration and draw the Fib levels, we can forecast Compound’s future price action. Do note that the path to 2030 follows the same path from 2022 to 2025. It assumes widespread growth and adoption of the lending platform.
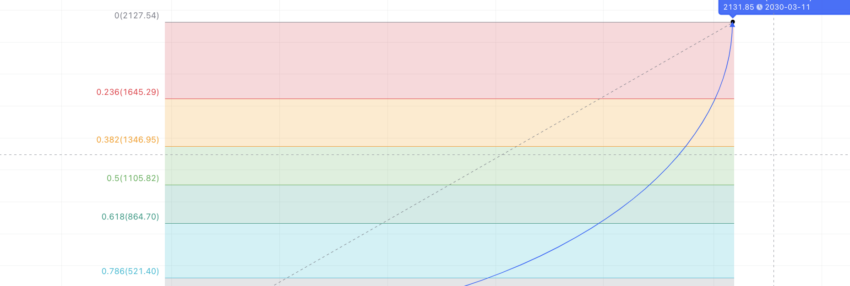
The Compound price prediction for 2030 high, as per the Fib levels, surfaces at $2127.54.
Projected ROI from the current level: 2393%
Compound (COMP’s) long-term price prediction until 2035
Outlook: Very bullish
You can easily convert your COMP to USD
For additional COMP forecasts pns, the below figures trace the price of COMP till 2035:
| Year | | Maximum price of COMP | | Minimum price of COMP |
| 2024 | $117.94 | $82.50 |
| 2025 | $217.30 | $113.55 |
| 2026 | $325.95 | $202.08 |
| 2027 | $521.52 | $260.76 |
| 2028 | $912.66 | $456.33 |
| 2029 | $1,368.99 | $684.49 |
| 2030 | $2,127.54 | $1,319.07 |
| 2031 | $2,553.04 | $1,991.37 |
| 2032 | $3,318.96 | $2,389.65 |
| 2033 | $4,148.70 | $3,235.98 |
| 2034 | $5,393.31 | $4,206.78 |
| 2035 | $6,741.64 | $5,258.47 |
Do note that percentage gain and loss for attaining the yearly highs and lows are crypto market dependent. Therefore, the focus should be on locating the average price of COMP rather than fixating on extreme price levels.
How accurate is the Compound price prediction?
This Compound price prediction model is built on detailed technical analysis, on-chain detailing, and fundamental profiling. Therefore, you can expect all the price prediction levels to be practical and attainable. As explained above, it is wise to focus on the average annual COMP price to paint a more accurate long-term picture. And for each year, you should take the existing state of the crypto market to tweak the price expectations accordingly.
Frequently asked questions
How much will Compound be worth in 2025?
Does Compound coin have a future?
Can Compound reach $10000?
Is Compound coin a good long term investment?
Is Compound safe crypto?
Disclaimer
In line with the Trust Project guidelines, the educational content on this website is offered in good faith and for general information purposes only. BeInCrypto prioritizes providing high-quality information, taking the time to research and create informative content for readers. While partners may reward the company with commissions for placements in articles, these commissions do not influence the unbiased, honest, and helpful content creation process. Any action taken by the reader based on this information is strictly at their own risk. Please note that our Terms and Conditions, Privacy Policy, and Disclaimers have been updated.