


The Injective (INJ) hackathon with a prize pool of $100,000 is ongoing until Dec. 12.
The INJ price has increased significantly in October-November and is approaching its all-time high.
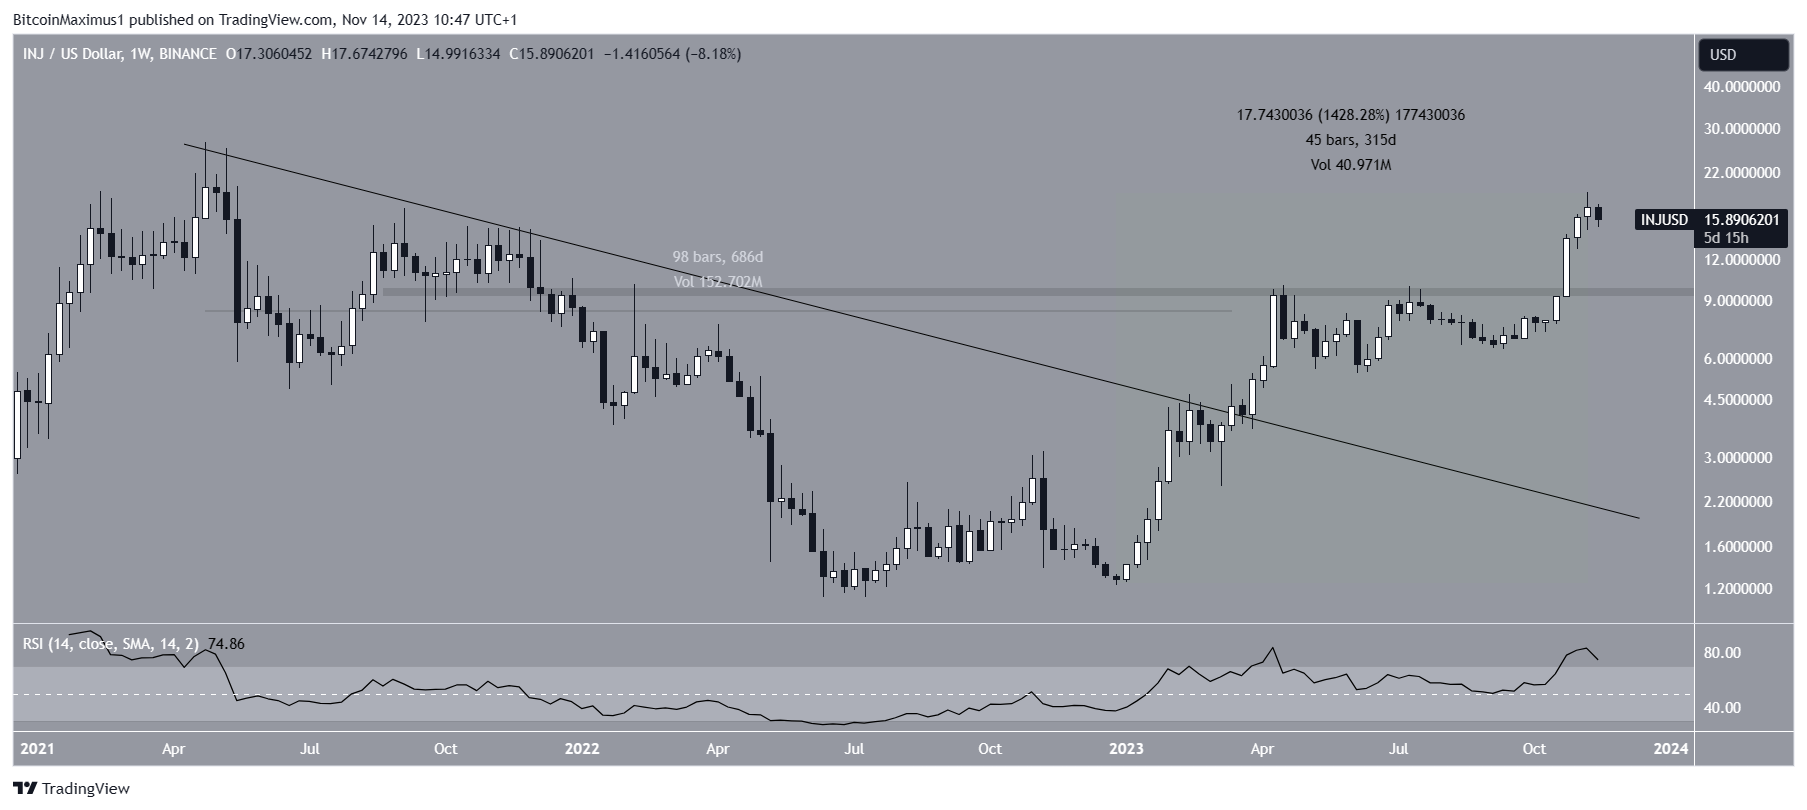
Injective Approaches All-Time High
The Injective price has been moving upwards since the start of the year. In 315 days, the INJ price increased by more than 1,400%.
In March, INJ initiated a breakout from a descending resistance trend line that had persisted for nearly 700 days.
While it encountered a temporary setback around the $9.50 resistance area, INJ resumed its upward momentum in October and has been on a swift incline since.
Read more: How to Start Copy Trading: A Definitive Guide for Beginners
Traders commonly employ the Relative Strength Index (RSI) as a momentum indicator to assess market conditions, to determine whether an asset is overbought or oversold, and to decide on buying or selling actions.
An RSI reading above 50 and an upward trend indicate an advantage for the bulls. Conversely, a reading below 50 suggests the opposite.
Presently, the weekly RSI stands above 50 and is trending upwards, but is also in overbought territory.
The Injective X Google Cloud Illuminate hackathon is ongoing until Dec. 2. The hackathon has a prize pool of $100,000 and will provide technical guidance and mentorship for builders and startups.
INJ Price Prediction – Is All-Time High Within Reach?
The Elliott Wave theory, which involves analyzing recurring long-term price patterns and investor sentiment, aligns with the notion of sustained price growth for the altcoin.
As per this theory, the altcoin is increasing in the fifth and final wave of its upward movement. The extent of the fifth wave can be analyzed utilizing Fibonacci projections. This is done by measuring the lengths of the first and third waves.
Read More: 9 Best AI Crypto Trading Bots to Maximize Your Profits
The Fibonacci retracement levels theory states that following a significant price movement in one direction, the price is anticipated to undergo a partial retracement to a prior price level before resuming its trajectory. This approach aids in identifying potential future peak levels for price increases.
Applying this framework, if wave five constitutes 0.382 of the combined length between waves one and three, it is possible to push INJ’s price to $25, marginally below its all-time high of $25.30. This would be an increase of 60%
This projection implies a 40% increase from the current INJ price. If wave five extends further, the potential for a 60% increase exists, reaching the subsequent resistance level at $36.50.
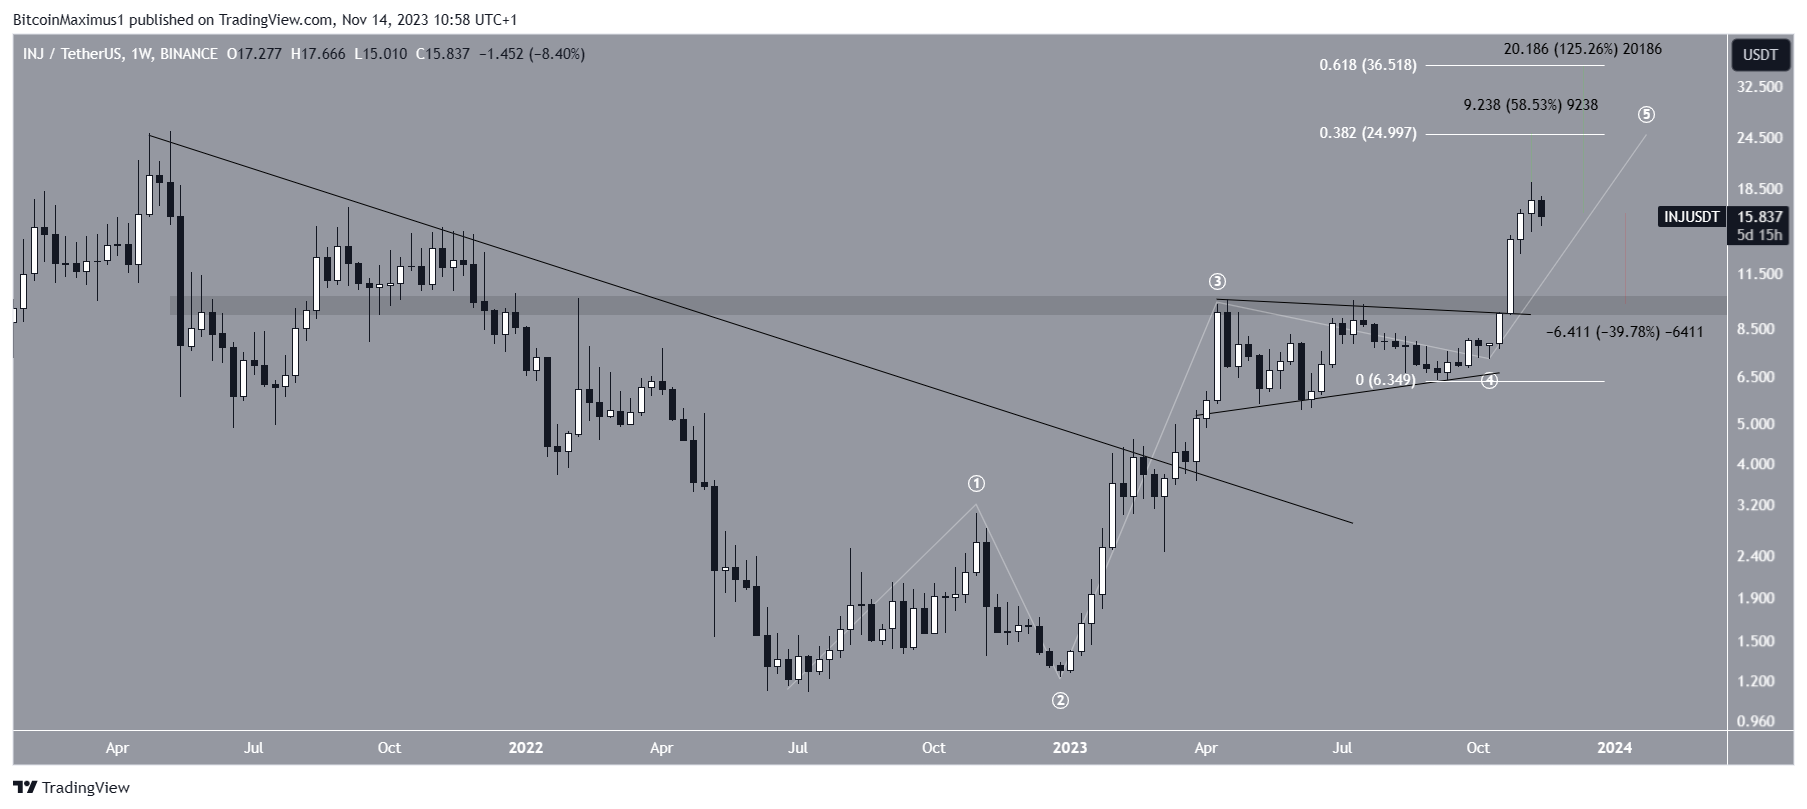
However, despite this bullish INJ price prediction, a bearish weekly close could signal that the local top is in and that a 40% drop to the closest support at $10 will occur.
For BeInCrypto‘s latest crypto market analysis, click here.


