


Bitcoin (BTC) and most large altcoins have increased significantly in October and November, with BTC reaching a new yearly high on Thursday.
In this article, BeInCrypto will look at smaller altcoins with bullish formations, possibly leading to significant gains next month. Specifically, coins between 150 and 300 in the market capitalization rankings will be analyzed.
PENDLE Price Approaches All-Time High
The PENDLE price has increased rapidly since August. The rate of increase especially accelerated during the last four weeks, leading to a high of $1.23 today.
The high caused a breakout from the $1 horizontal resistance area, which had been in place since September 2021.
While PENDLE has previously moved above this level, it has never reached a weekly close above it. Therefore, if the current price holds until the end of the week, PENDLE will reach its highest-ever weekly close.
Read more: 7 Must-Have Cryptocurrencies for Your Portfolio Before the Next Bull Run
Cryptocurrency trader UmerAsh said that he sold all his holdings after a profit of more than 100%.
The weekly Relative Strength Index (RSI) gives a positive reading. Market traders use the RSI as a momentum indicator to identify overbought or oversold conditions and to decide whether to accumulate or sell an asset.
Readings above 50 and an upward trend indicate that bulls still have an advantage, whereas readings below 50 suggest the opposite. The indicator is increasing and is above 50. Additionally, it broke out from its bearish divergence trend line (green).
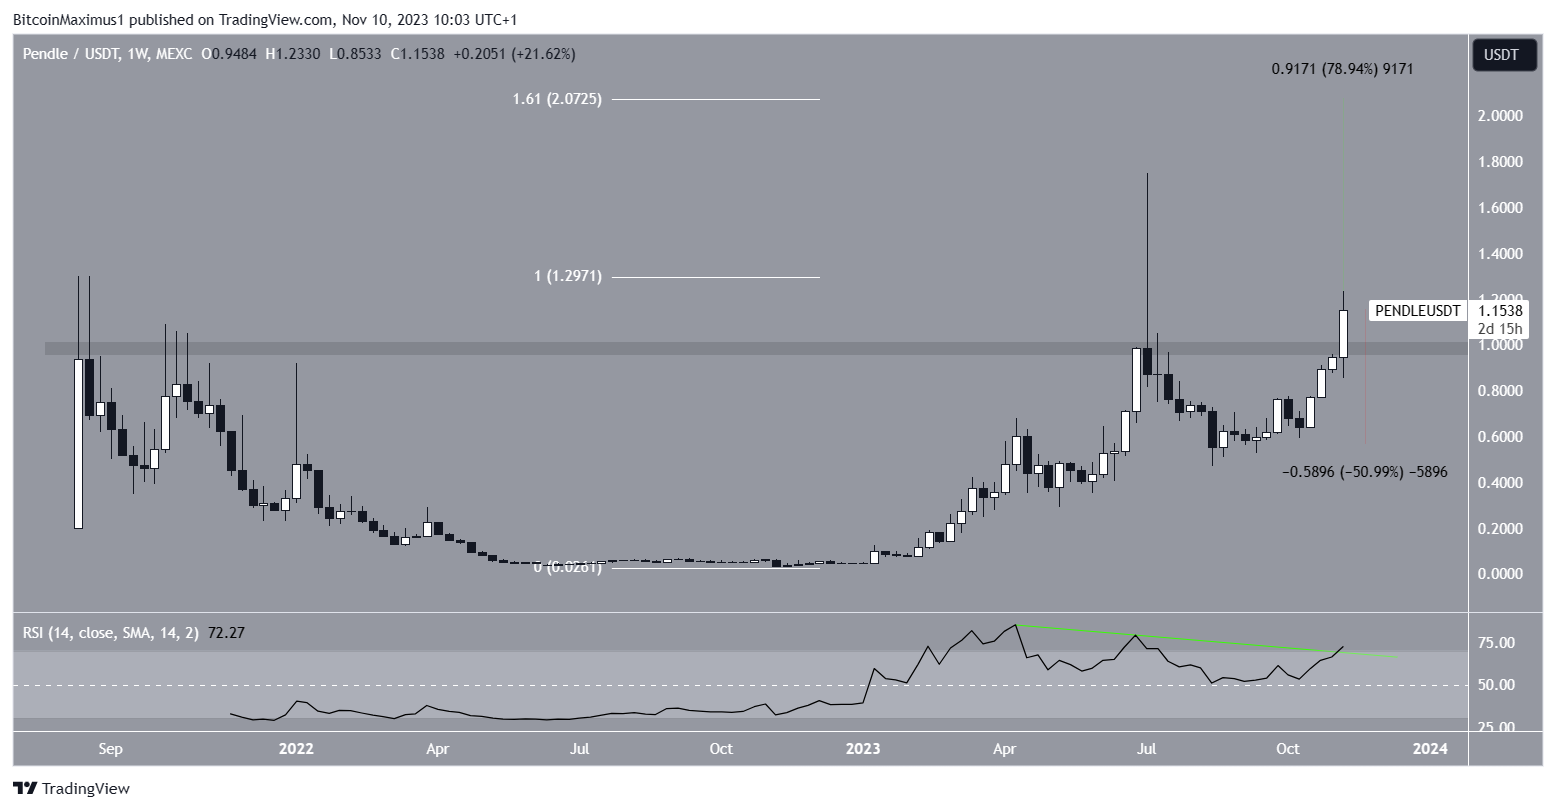
If the altcoin’s increase continues, the next resistance will be at $2.07, 80% above the current price. The target is given by the 1.61 external Fib retracement of the previous drop and constitutes a new all-time high price.
Despite this bullish price prediction, a weekly close below the $1 horizontal area can cause a 50% drop to the next closest support at $0.60.
Bancor Breaks out From Long-Term Resistance
The Bancor (BNT) price had traded below the $0.65 horizontal resistance area since May 2022. During this time, it made several unsuccessful breakout attempts.
However, the altcoin finally increased above the area this week, reaching a new yearly high of $0.84.
Read More: 9 Best AI Crypto Trading Bots to Maximize Your Profits
The weekly RSI supports this increase. The indicator is above 50 and moving upwards, considered signs of a bullish trend. Cryptocurrency trader HBJ trades believes that the price will run hard since it has already broken out of its range.
If the breakout continues, the price can increase by 250% and reach the next resistance at $2.70.
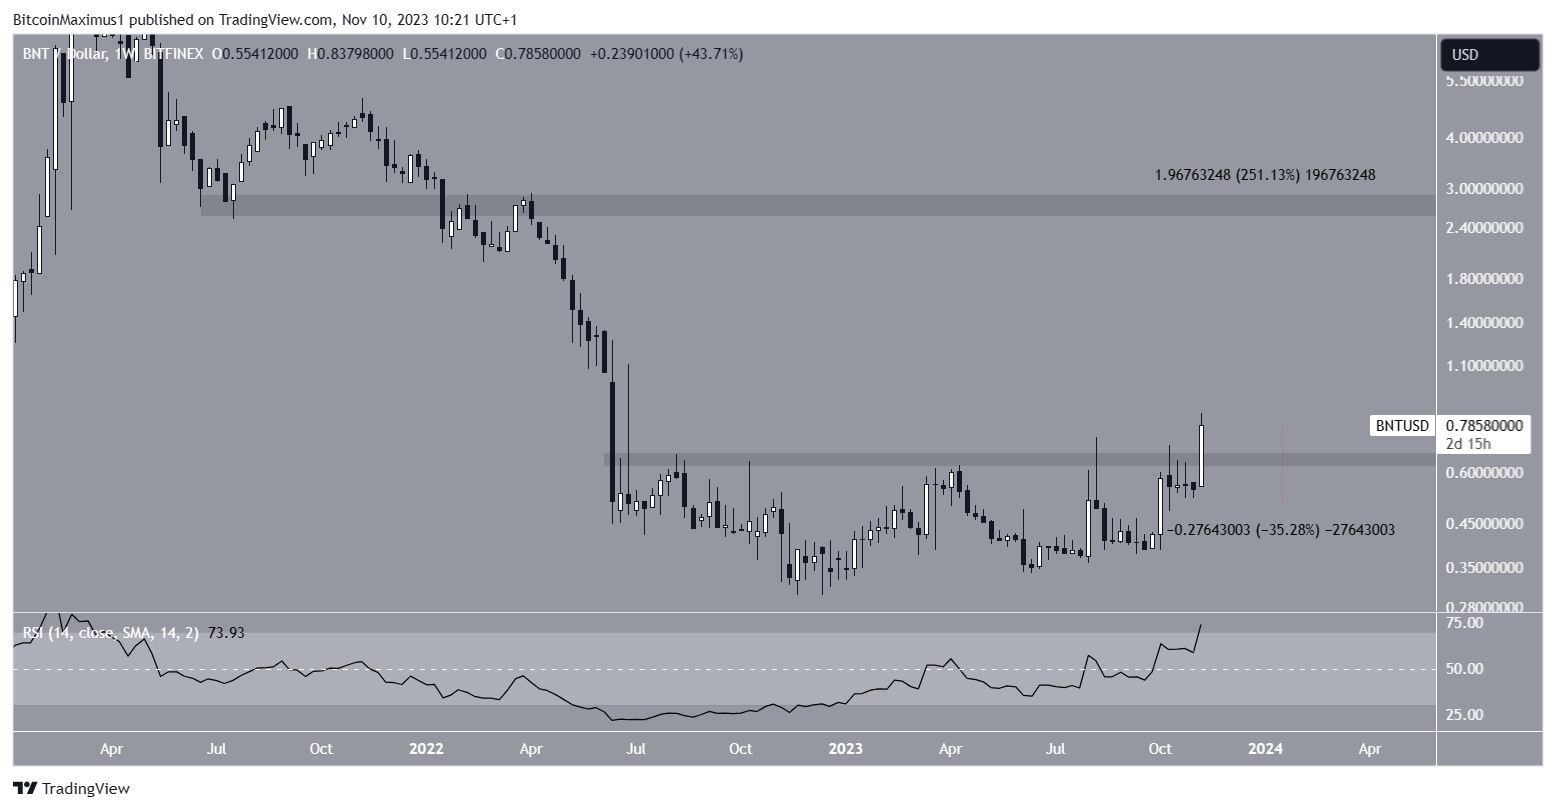
Despite this bullish BNT price prediction, a close below the $0.65 horizontal area can lead to a 35% drop to the next closest support at $0.50.
Radiant Capital Clears Long-Term Resistance
The Radiant Capital (RDNT) price had fallen under a descending resistance trend line since April 15. The decrease led to a low of $0.19 on September 11.
Read More: Top 9 Telegram Channels for Crypto Signals in 2023
After making a higher low on Oct.19, the altcoin accelerated its rate of increase and broke out from the trend line on Oct. 25. On Friday, the price reached a high of $0.30.
Cryptocurrency trader SherlockWhale believes that the price will go to at least $0.36. The target is between the 0.5-0.618 Fib retracement resistance levels and is 25% above the current price.
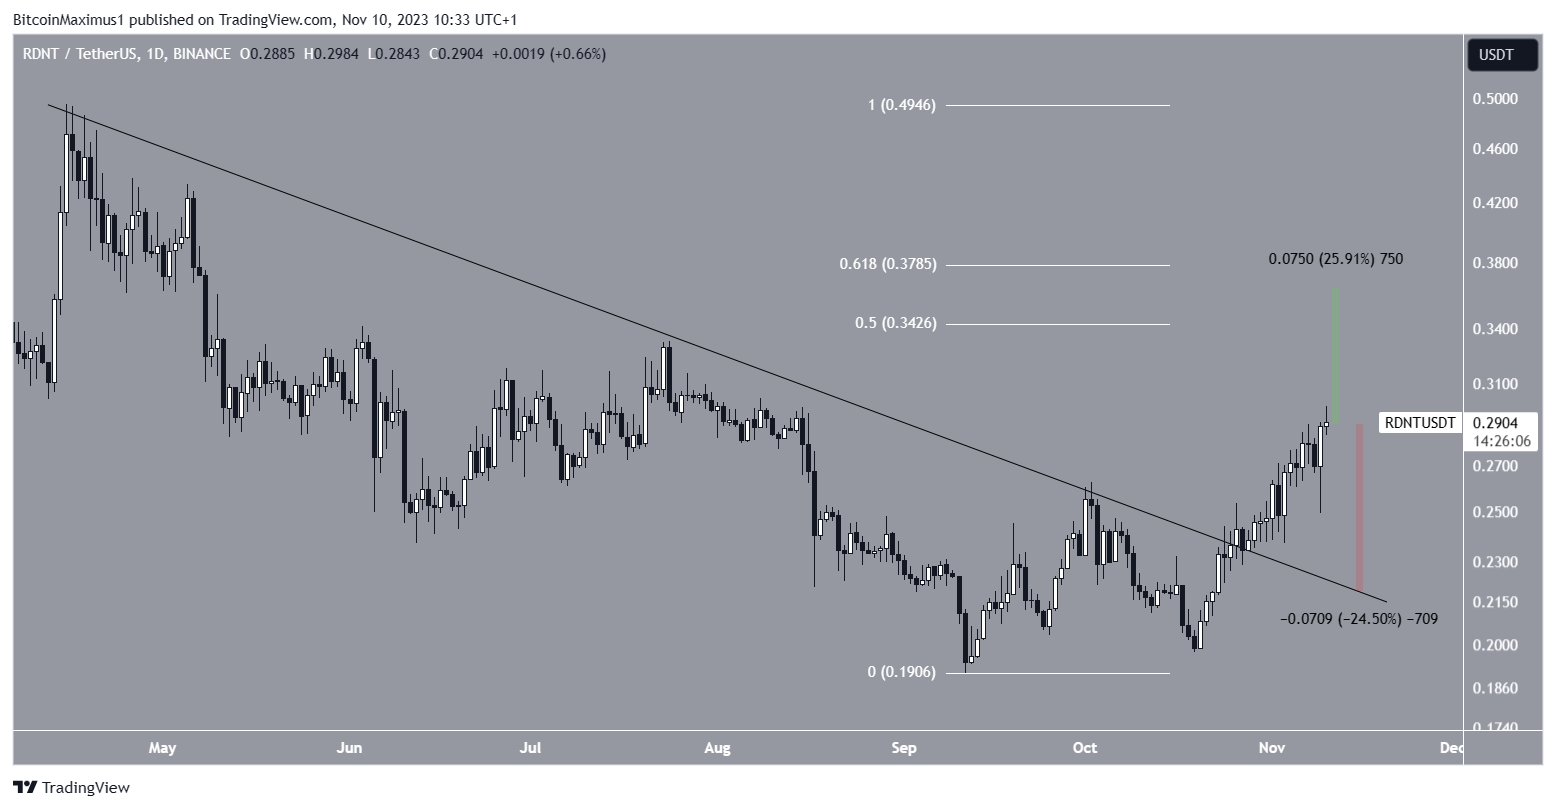
Despite this bullish RDNR price prediction, failure to sustain the increase can lead to a 25% drop that would validate the trend line at $0.22.
For BeInCrypto’s latest crypto market analysis, click here.


