


October was a bullish month for the cryptocurrency market, filled with altcoin gainers. Bitcoin (BTC) and several other cryptocurrencies reached new yearly highs.
As Halloween ushers an end to October, BeInCrypto looks at 5 altcoins that made October frighteningly profitable. The five October altcoin gainers are:
- Polymesh (POLYX) price increased by 205.13%
- Tellor (TRB) price increased by 95.60%
- Solana (SOL) price increased by 79.61%
- Injective (INJ) price increased by 71.45%
- MINA price increased by 62.92%
POLYX Price Leads October Altcoin Gainers
The POLYX price has increased quickly since October 13. The upward movement has been parabolic, leading to an all-time high price of $0.43 on October 30.
The increase caused a breakout from the $0.29 horizontal resistance area, which had been in place since April.
The all-time high was close to the 1.61 external Fib level of the most recent decrease. Once the price is at an all-time high, the Fib level often acts as the area for the top.
If POLYX breaks out above it, it can increase by 75% to the 2.61 external Fib level at $0.66.
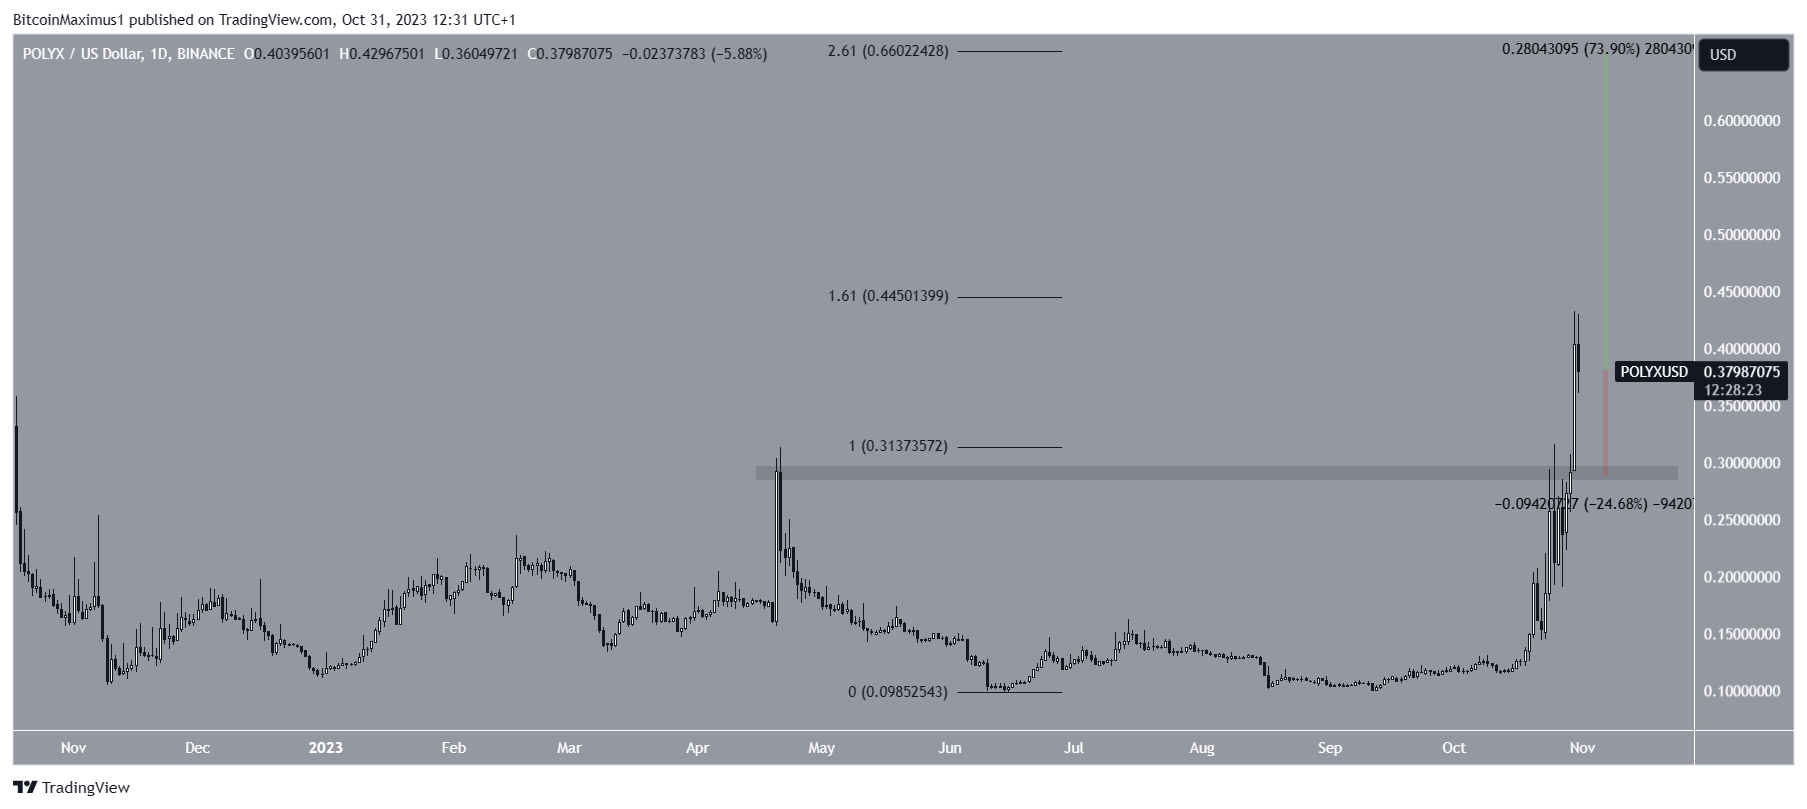
Despite this bullish prediction, failure to close above the $0.44 resistance can lead to a 25% drop to the $0.29 horizontal area, which is expected to provide support.
TRB Reaches Yearly High
The TRB price has increased alongside a parabolic ascending support line since the beginning of September. The upward movement led to a new yearly high of $125 yesterday.
Currently, TRB trades slightly above the 0.618 Fib retracement level of the entire previous decrease at $105. Whether the price moves above it or gets rejected can determine if the future trend is bullish or bearish.
A successful close above this area can lead to a 50% increase to the next resistance at $165.
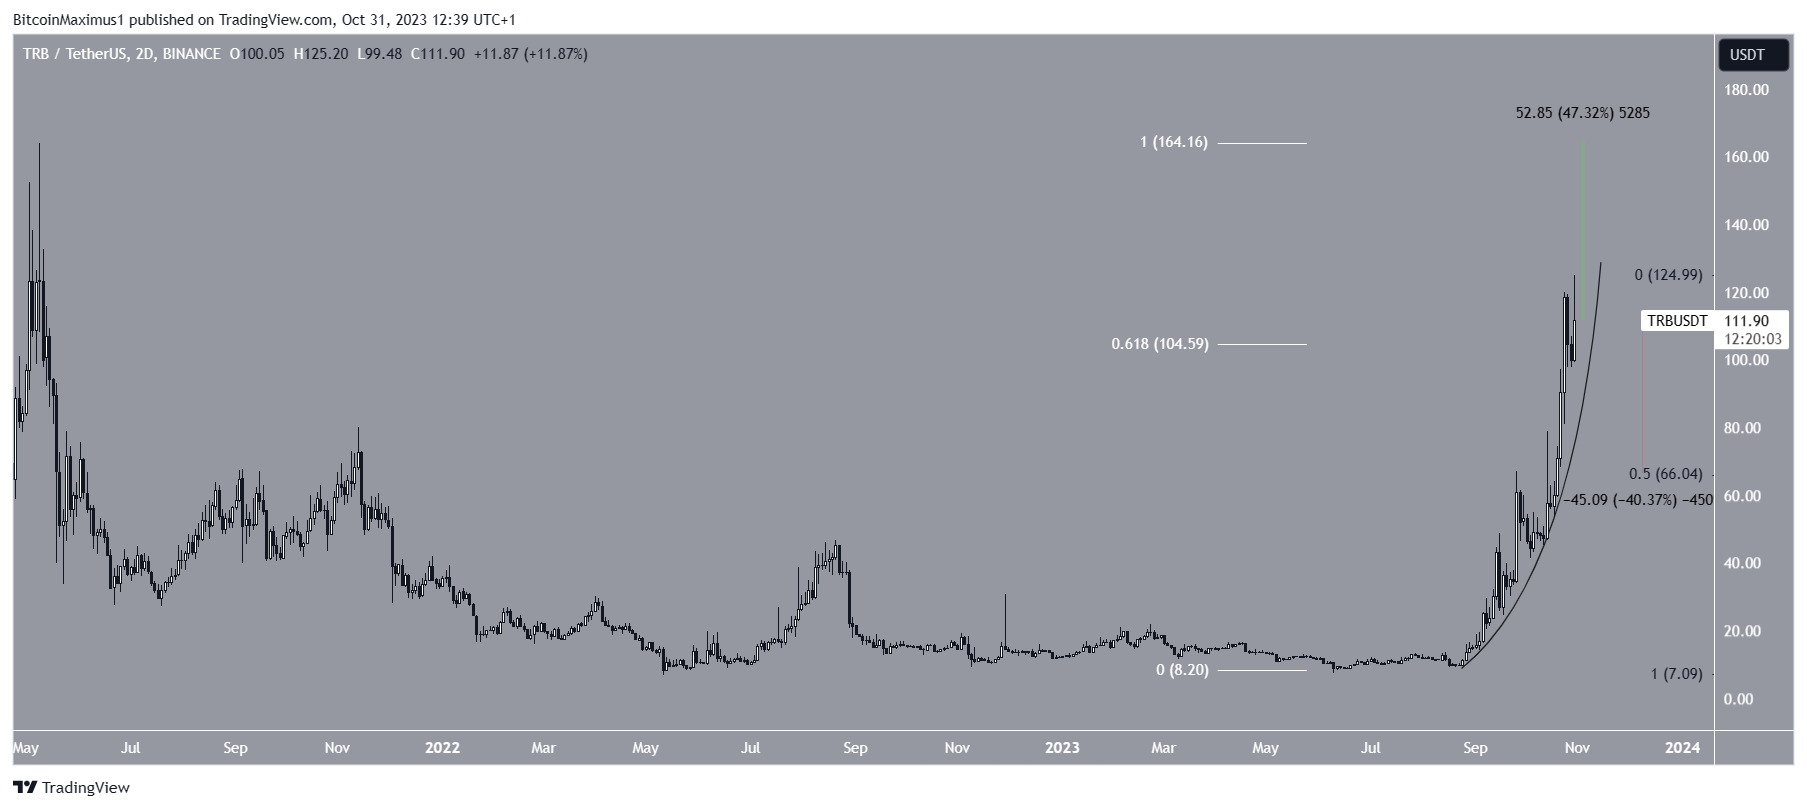
On the other hand, a rejection and breakdown from the parabolic ascending support line will mean the upward movement is complete. In that case, a 40% drop to the closest support at $66 will be likely.
Solana Resumes Rapid Ascent
The SOL price has increased alongside an ascending support trendline since the beginning of the year. More recently, it bounced above the line in September (green icon), accelerating its rate of increase.
The next month, SOL broke out from the $28 horizontal area. This was a crucial area since it had been in place since November 2022.
Read More: 9 Best Crypto Demo Accounts For Trading
Today, SOL reached a new yearly high of $37. If the price continues upwards, it can increase by another 46% and reach the next resistance at $47.
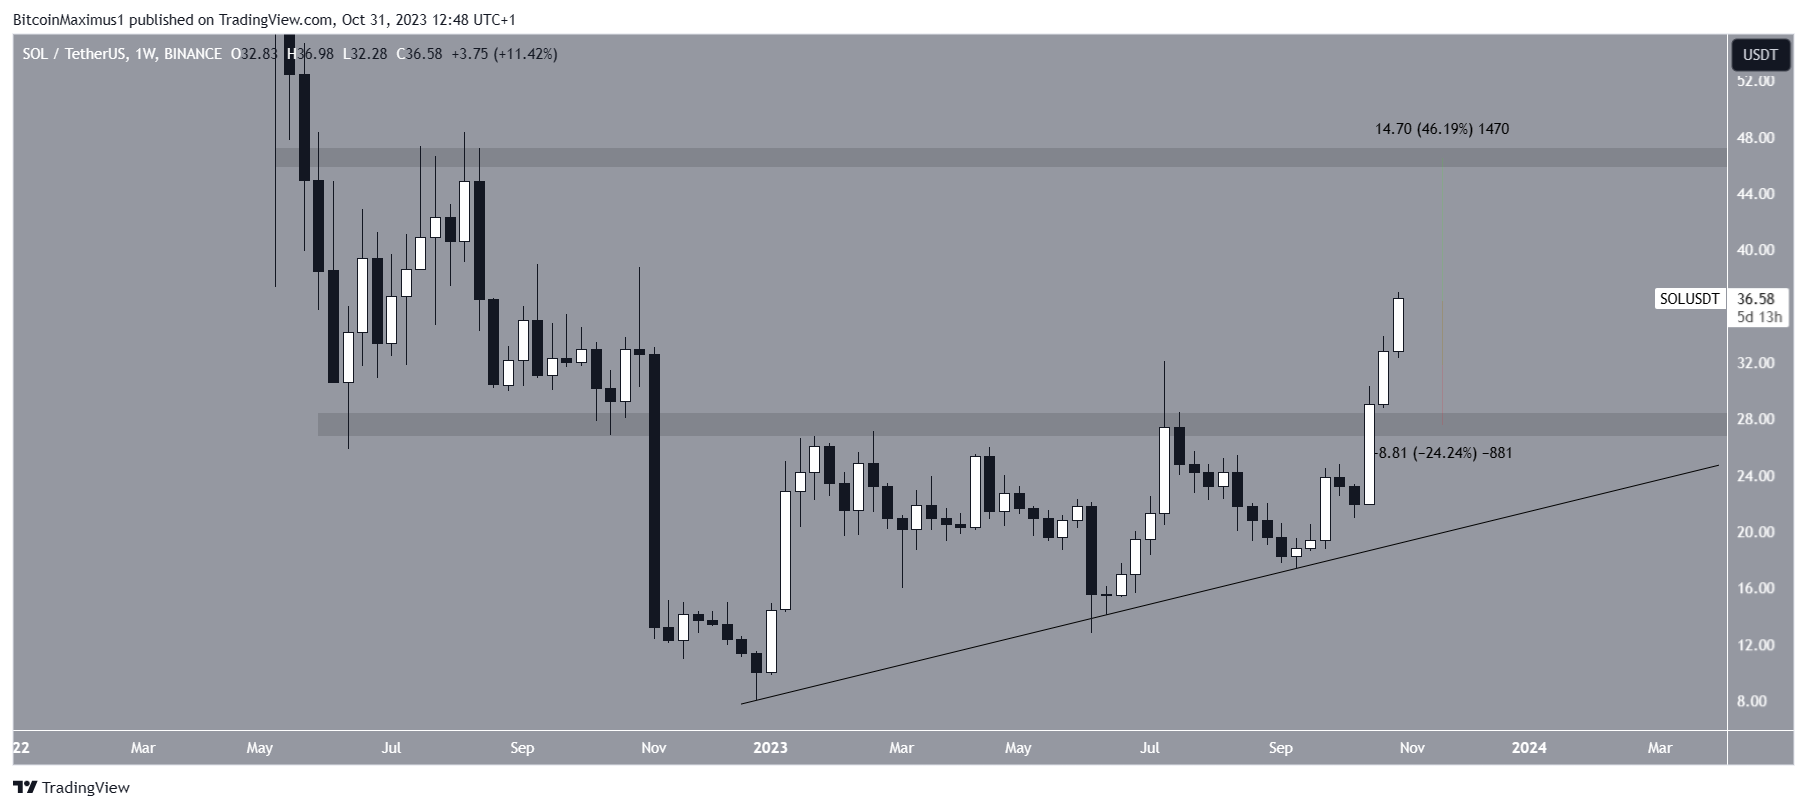
Despite this bullish SOL price prediction, failure to sustain the increase can cause a 25% drop to the $28 area, validating it as support.
Injective Increases by 50% in One Week
The INJ price increased by 50% last week, breaking out from the $9 horizontal resistance area. The price reached a new yearly high of $14.50 today. This was the highest price since November 2021.
Currently, INJ trades inside the $13.50 horizontal resistance area. This is the final resistance before the all-time high region.
So, if INJ breaks out, it can double in price and reach the all-time high of $27.
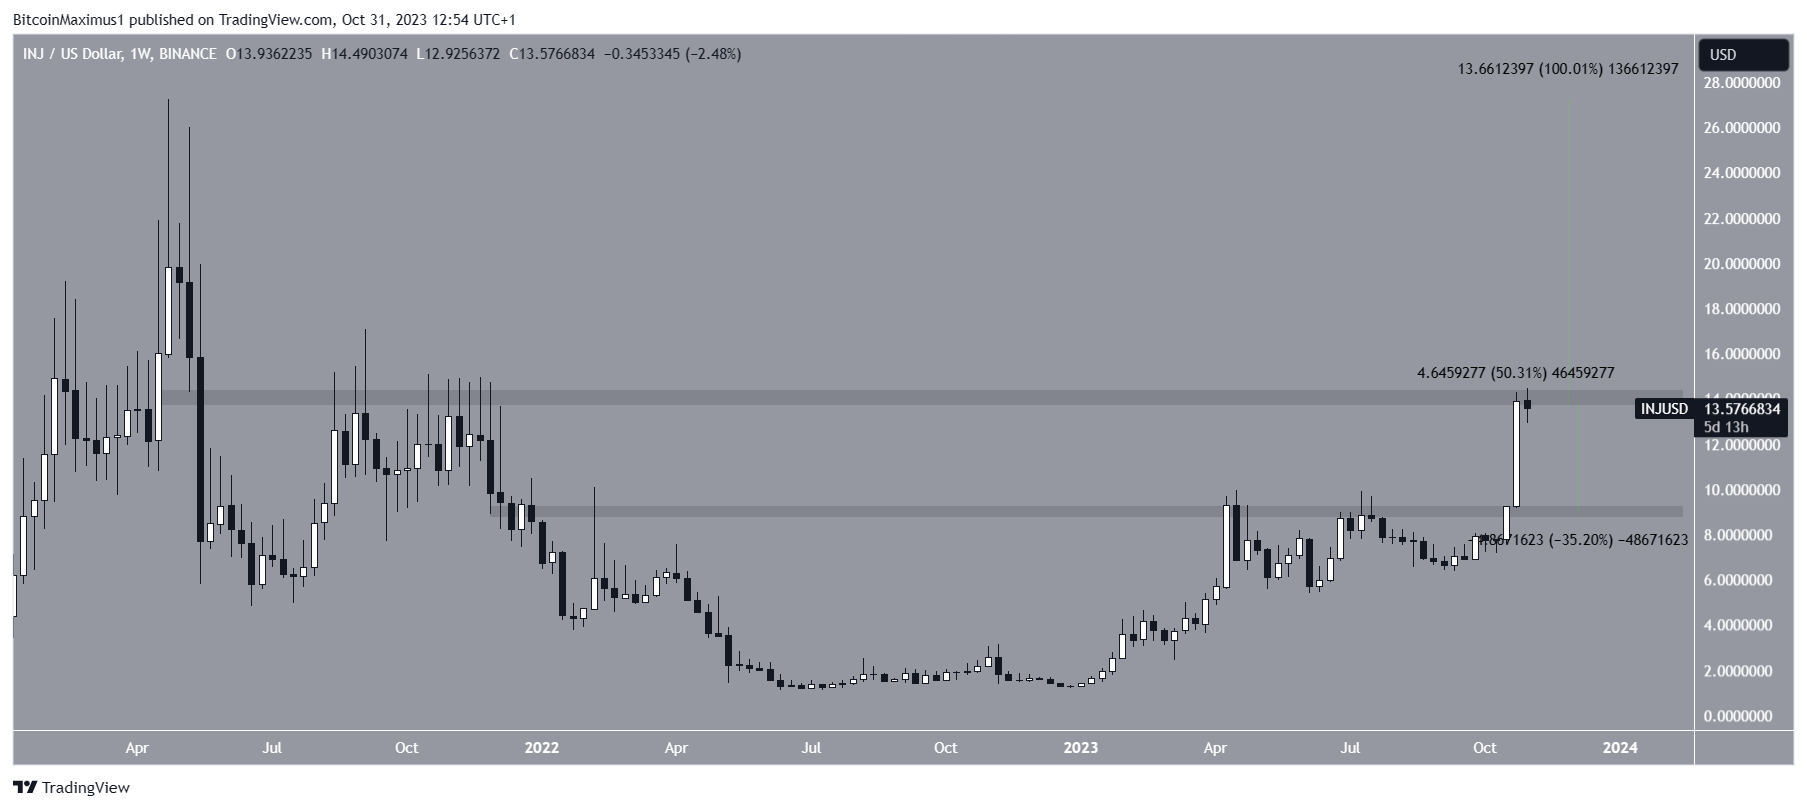
Despite this bullish prediction, a rejection from the $13.50 horizontal resistance area can trigger a 35% drop to validate the $9 support area again.
MINA Concludes October Altcoin Gainers
The MINA price has increased swiftly since its $0.36 low on October 11. On October 24 alone, the price increased by 110%, leading to a high of $0.98.
However, the upward movement could not be sustained. Rather, MINA created a long upper wick (red icon) and fell below the $0.88 horizontal resistance area.
Now, MINA trades just above the $0.58 horizontal support area. Whether it bounces or breaks down can determine the future trend’s direction.
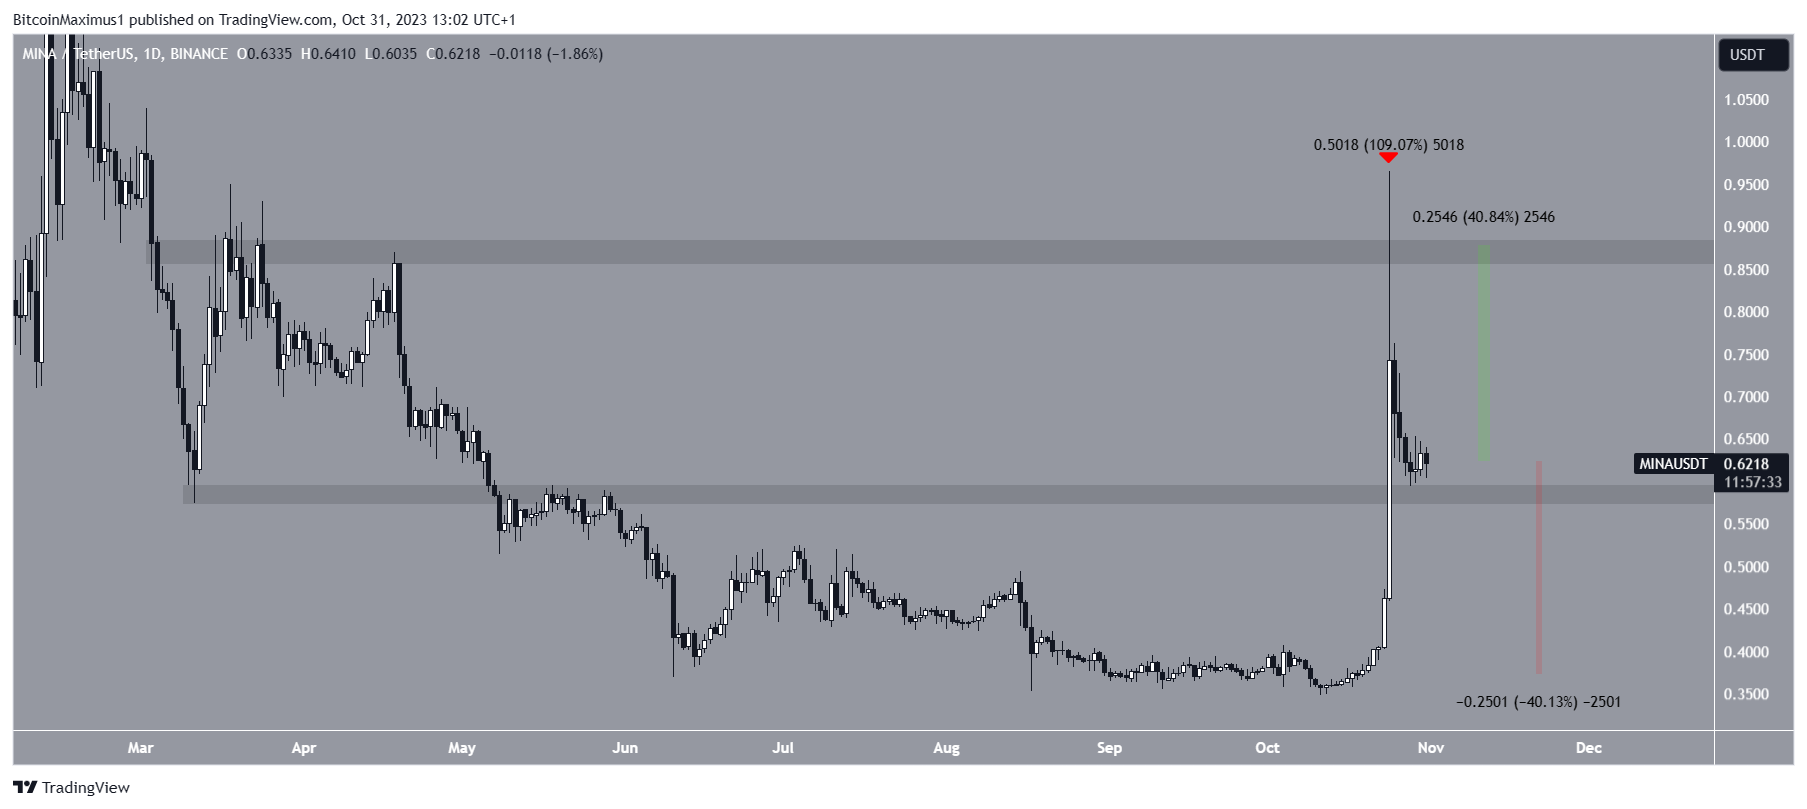
A bounce can lead to a 40% increase to the next resistance at $0.88. On the other hand, a breakdown can cause a 40% drop to $0.37.


