


The Polkadot (DOT) price reached a high of $5.90 this week but has retraced slightly since.
The decrease took DOT below the $5.50 horizontal resistance area, above which a breakout had previously occurred.
Polkadot Falls After Rejection
Analyzing the weekly timeframe for DOT shows that the price decreased below a descending resistance trend line since February, hitting a low of $3.56 in October.
This decline led to a decisive breach of the crucial horizontal support. The area has previously had a consistent level since the start of the year.
However, a positive shift has occurred in four weeks following the low. In October, the Polkadot price broke free from the descending resistance trend line, reaching a peak of $5.90 last week, marking its highest value in 200 days.
While this increase seemingly caused a breakout above the key resistance area, DOT fell below it shortly afterward. This created a bearish candlestick (red icon).
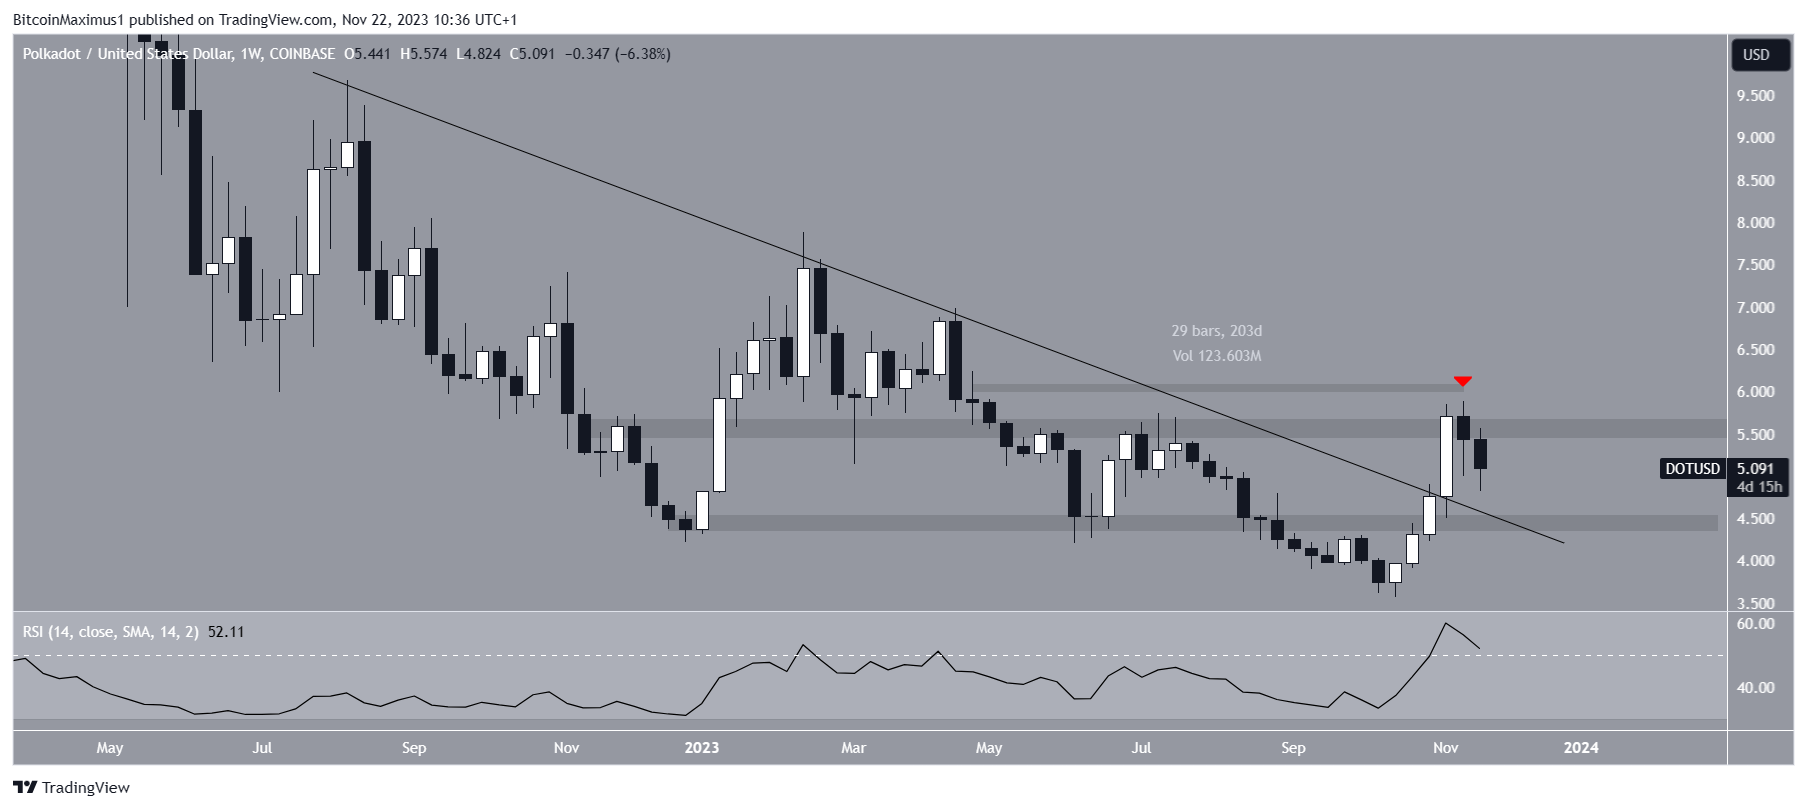
Traders frequently utilize the Relative Strength Index (RSI) as a momentum gauge to assess market conditions, helping them determine optimal times for buying or selling by identifying overbought or oversold assets.
An RSI reading above 50, combined with an upward trend, signals a favorable position for the bulls. A reading below 50 indicates the opposite.
The RSI is on an upward trajectory and stands above the 50 threshold.
Read More: What Is Polkadot (DOT)?
What Are Analysts Saying?
Cryptocurrency traders and analysts on X are predominantly bullish on the DOT price trend.
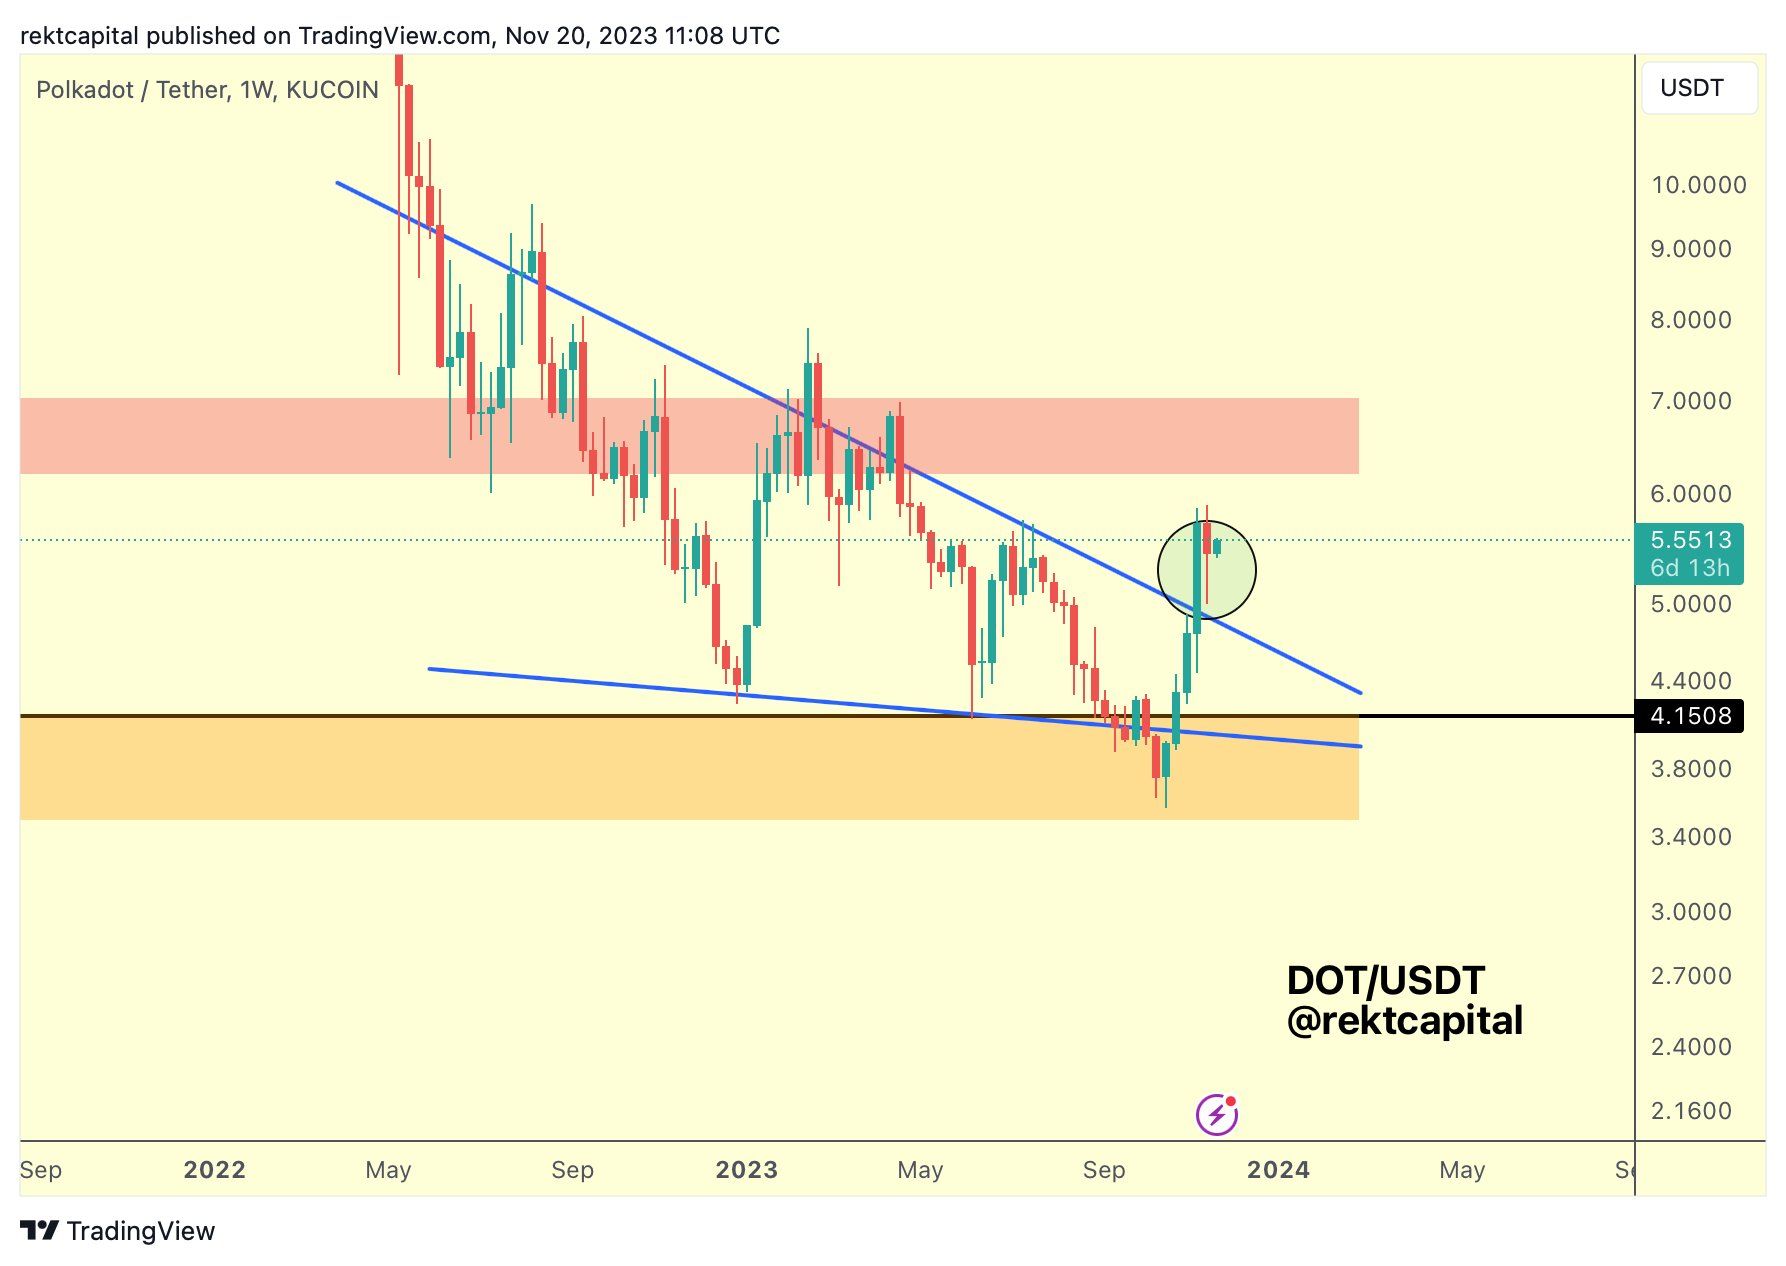
Rekt Capital noted the same descending resistance trend line breakout, stating that:
Looks like the retest was successful Now it’s all about the follow-through from here Generally, any dips into the top of the pattern even in December would still be macro bullish
Crypto Tony had a bullish short-term view since the price held above the $5.50 horizontal area. However, it is unclear if the recent decrease in the area has changed his outlook to a more negative one.
Read More: How To Stake Polkadot (DOT)
DOT Price Prediction: Is This the Beginning of a Reversal?
Technical analysts utilize the Elliott Wave theory to recognize repetitive, long-term price patterns and gain insights into investor psychology, aiding in determining trend directions.
According to the current Elliott wave count, the Polkadot price has completed a five-wave downward movement (white) since reaching its all-time high in November.
If this analysis is accurate, it suggests the beginning of a new movement in the opposite direction. Whether this signifies the start of a bullish trend reversal or an upward correction remains uncertain. But, both scenarios anticipate a substantial increase in the DOT price.
The weekly RSI shows a bullish divergence since the beginning of the year (green line), providing additional support for the ongoing upward momentum. Such divergence typically occurs at trend bottoms, a precursor to bullish trend reversals.
The significance of this bullish divergence is accentuated by its alignment with the recovery of the $4.40 area and the completion of a five-wave downward movement.
In the event of a continued increase in the altcoin’s value, the next resistance level is predicted at $10. The area would represent a substantial 110% increase from the current price.
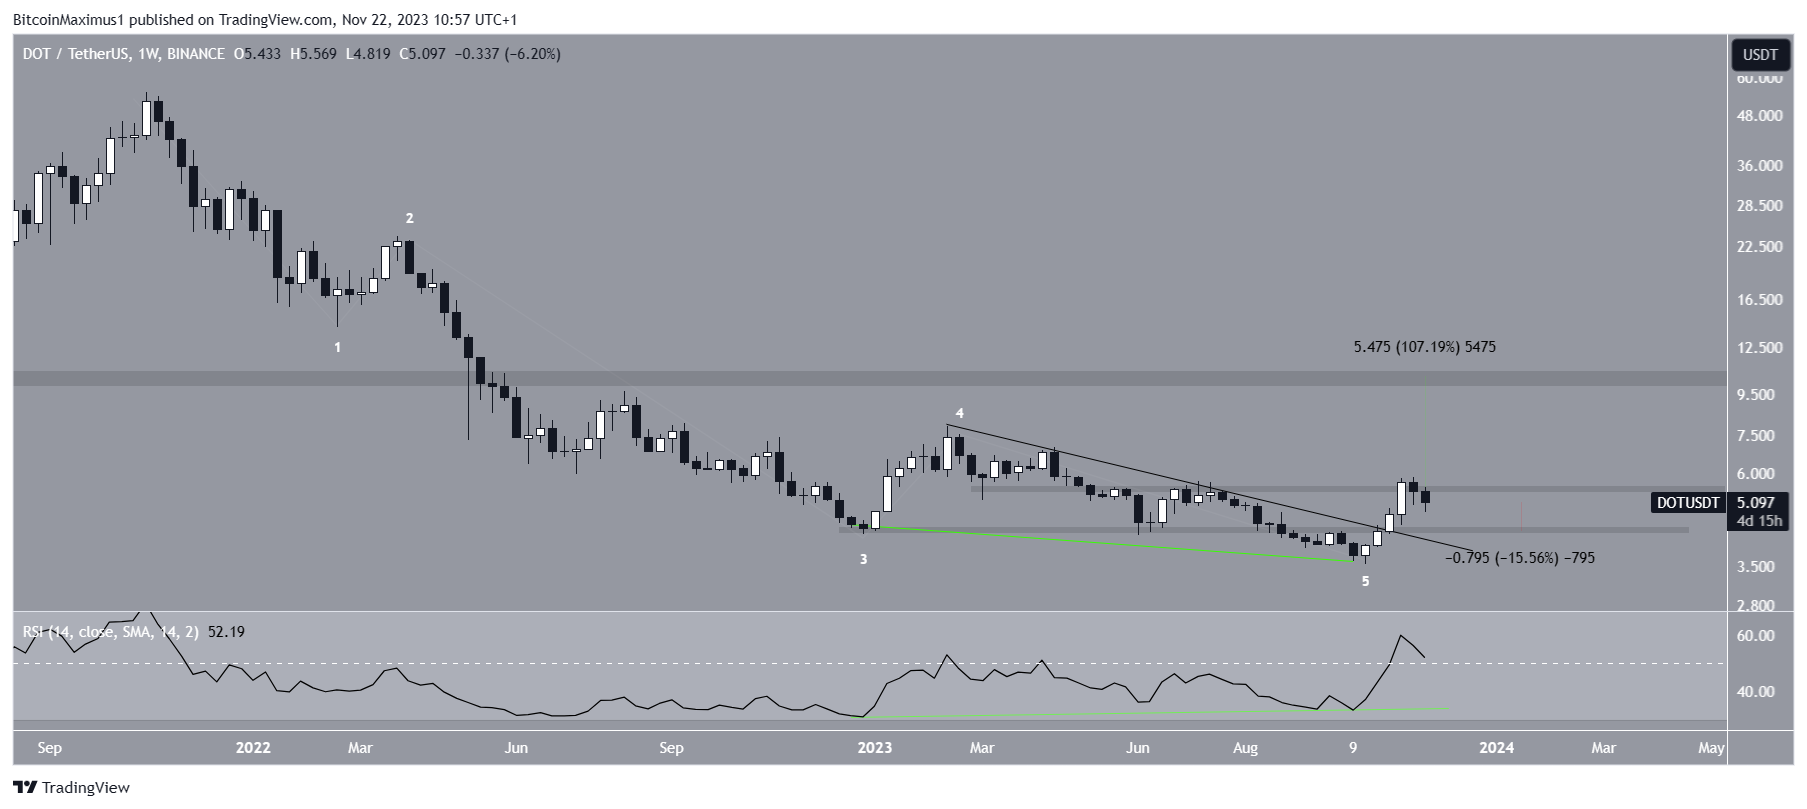
However, despite the bullish DOT price prediction, failure to reclaim the $5.50 horizontal resistance area can trigger a 15% drop to the closest horizontal support at $4.40.
For BeInCrypto’s latest crypto market analysis, click here.


